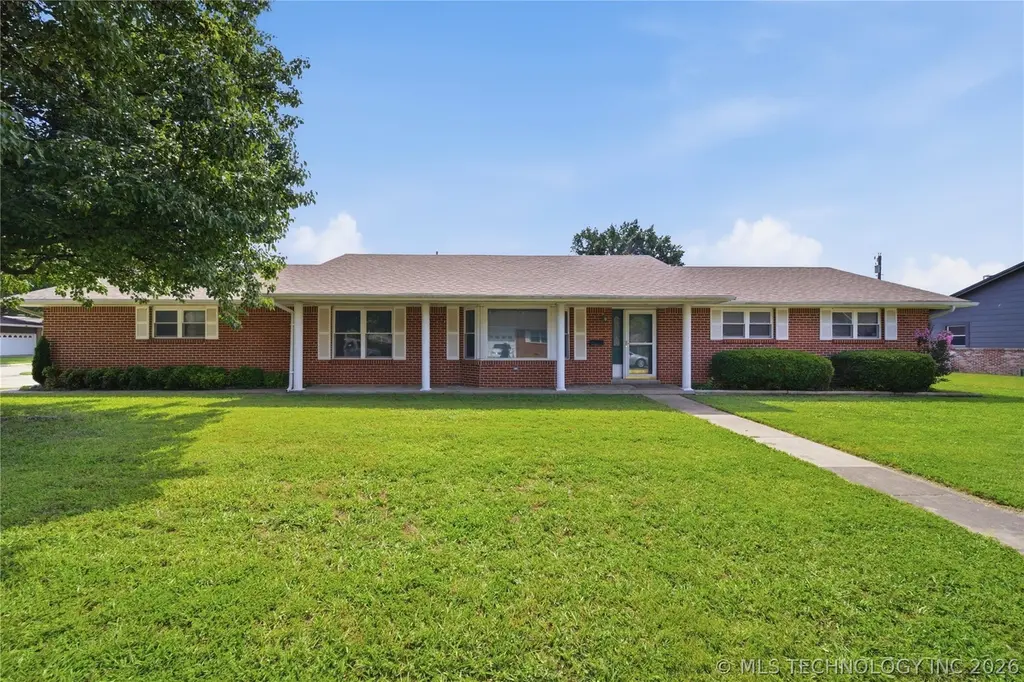
106 W Lewis Ave · Vinita, OK
Flood risk 1/10 · Minimal
- FEMA flood zone
- X (unshaded)
- Chance of flooding over 30 yrs
- 0.0%
- Est. flood insurance / yr
- $507 – $1,088
Fire risk 5/10 · Moderate
- Est. fire insurance / yr
- $2,463 – $4,575
Heat risk 6/10 · Moderate
- Hot days now (above 110°F)
- 7 days/yr
- Hot days in 30 yrs
- 21 days/yr
Wind risk 2/10 · Minimal
- Chance of severe wind over 30 yrs
- 3.0%
Air-quality risk 2/10 · Minimal
- Unhealthy air days now
- 1 days/yr
- Unhealthy air days in 30 yrs
- 2 days/yr
Risk factors via First Street. Map © Google.
Why this score? — see what drove the D- grade
The composite is a weighted blend of 9 inputs, each scored 0–100. Each bar is that input's sub-score; the figure is the points it added to the 100-point composite (weight × sub-score).
- Appreciation +10.0/10.0
- Cash flow +8.6/30.0
- ARV discount +6.1/15.0
- Livability +3.2/5.0
- Rent growth +2.5/5.0
- Condition / age +2.5/5.0
- DSCR +2.4/10.0
- 1% rule +1.9/10.0
- Schools +1.8/10.0
$189,900
🖨 Deal sheet (PDF) 📄 Offer letter ✓ Due diligence
Listing remarks MLS
Lots of curb appeal with this well maintained home on oversized lot in a small subdivision. New 40 year roof just two years old. Storage building in back yard. Two car gagage with side entry and add'l storage and work area.
Key facts
- Spacious yard
- Large corner lot
- Convenient location
Tags
Property features AI
Exterior
- Parking: Attached garage with side-facing entry; 2 garage spaces; Storage in garage
- Security: No safety shelter
- Utilities: Electricity available; Public water; Public sewer
- Home design: Single-story home; Faces west; Slab foundation
- Construction: Brick and wood frame construction; Asphalt/fiberglass roof
- Exterior features: Covered patio; Patio; Storage structure
Interior
- Kitchen: Built-in oven; Range; Microwave; Dishwasher
- Bedrooms: Master bedroom with private bath and separate closets (first level); Two additional bedrooms with shared Pullman baths (first level)
- Flooring: Carpet; Vinyl
- Bathrooms: Two full bathrooms; One half bathroom; Master bath with shower (first level); Hall full bath (first level)
- Heating & cooling: Central heating (gas); Central air conditioning
- Interior features: Aluminum window frames; Laminate countertops; Electric range connection
- Laundry & utility: Washer hookup; Electric dryer hookup; Gas water heater
Neighborhood map
What this means for you Summary
Snapshot
- This is a 3-bed/2.0-bath single-family listed at $190k.
Deal economics
- At list price, monthly cash flow is $-163 ($-2k/yr) — negative.
- To cash-flow at today's rent, offer at most $161k (15.2% below list).
- To meet the 1% rule (rent ≥ 1% of price), the offer needs to be $131k (31.1% below list).
- Recommended offer: $131k (31.1% below list) — sets the bar for 1% rule.
Location & tenants
- Location reads 63/100 on livability (#227 in OK) — a middle-class / working-renter tenant base. Strengths: cost of living A+, housing A+, crime B; Watch: amenities F, commute F, employment F.
- Vinita (town): math 24% / reading 20% proficiency, ranked #156 of 270 in OK (top 58%) — low school quality limits family demand, transient renter base, plan for 1-2y turnover.
- Zoned schools: Vinita Es (math 33% / reading 18%, grade F, #345 of 845 statewide, top 41%, 595 students, 0% FRL); Ewing Halsell Ms (math 17% / reading 20%, grade F, #182 of 345 statewide, top 53%, 307 students, 0% FRL); Vinita Hs (math 22% / reading 27%, grade F, #150 of 447 statewide, top 48%, 419 students, 0% FRL) — zoned schools average 0% FRL vs 56% district-wide (56 pts lower); this property's tenant base skews higher-income than the district average.
- Market conditions: 113 active listings in the ZIP; 24 units permitted in Craig County in 2024 (0 in 5+ unit buildings).
Forward outlook
- In year one you build about $20k of equity ($1k loan paydown + $19k appreciation (10.0% local appreciation)).
- Craig County population projected to shrink 7% by 2050 — rents likely to lag national; underwrite the cash flow, not the appreciation.
- By year 2, paydown + projected appreciation supports a ~$33k cash-out refi (75% LTV) — recoverable capital for the next deal without selling this one.
Negotiation context
- It's been on market 18 days — a 2% lower offer ($187k) is reasonable based on typical stale-listing flexibility.
- 3 sale attempts since 16y ago; this cycle's ask has dropped $10k (5%) from the opening price — seller is motivated, your offer sets the floor, not the list.
- Current owner paid $130k; 46% above their basis — modest negotiation headroom, anchor on the comps not their cost.
Risks & watch-outs
- Climate carrying-cost: moderate wildfire risk; extreme-heat days projected 7→21/yr by 2055 (HVAC capex compounding) — expect insurance premiums to compound above CPI over the hold.
Questions for the listing agent
- What do current leases actually rent for vs. the listed asking? Can we see a recent rent roll and the last 12 months of T-12 income?
- Built in 1976 — when were the roof, HVAC, electrical panel, plumbing, and water heater last replaced?
- Is there a deadline driving the sale (1031 exchange, divorce, estate, relocation)? That informs how much negotiation room exists.
- Schools are F-rated, which usually means shorter tenancies and higher turnover. Who's the typical renter profile here, and what's been the actual vacancy rate?
- The area grade is low — what's the realistic commute time and amenity access for the typical tenant pool here? Any planned neighborhood developments (good or bad) we should know about?
- What's the average days-on-market for RENTAL listings here right now (not sales)? A rising rental-DOM trend means longer vacancies and softer asking-rent achievability than the comps imply.
- What's the recent tenant-quality profile in this submarket — average credit score on applications, eviction rate, late-payment / NSF rate, and stable-employment percentage? A property-management company in the area should have these aggregated.
- How much new for-sale + rental construction is in the pipeline within 1–3 miles? Heavy new supply typically softens prices + rents 12–24 months out; constrained supply supports both.
Investment metrics
- 1% rule
- 0.69% ✗
- Cap rate
- 5.26%
- Cash-on-cash
- -3.69%
- DSCR
- 0.84
- GRM
- 12.1
CMA / ARV
- ARV (on-the-fly)
- $184,016
- Comps found
- 6
Show comp detail 6 sales within ~0.75 mi
| Address | Dist | Beds/Ba | Sqft | Sold | Price | $/sf | Match |
|---|---|---|---|---|---|---|---|
| 614 S Thompson | 0.08mi | 3/2.0 | 1,671 (+2%) | 14mo | $201,000 | $120 | 82 |
| 110 Sunset Dr | 0.13mi | 3/2.0 | 1,575 (-4%) | 11mo | $176,000 | $112 | 78 |
| 219 Sunset Dr | 0.19mi | 3/2.0 | 1,692 (+3%) | 20mo | $165,000 | $98 | 70 |
| 122 Prairie Ln | 0.16mi | 3/2.0 | 1,484 (-10%) | 15mo | $174,000 | $117 | 64 |
| 507 S Thompson | 0.17mi | 3/3.0 | 1,888 (+15%) | 2mo | $210,000 | $111 | 61 |
| 712 W South Ave | 0.55mi | 3/2.0 | 1,535 (-7%) | 15mo | $155,000 | $101 | 50 |
Match score weights: distance 35% · size 25% · config 20% · recency 20%. Top-matched comps best support the ARV.
Projected returns pro-forma
10.0% appreciation · 3.0% rent growth · sell at horizon
- IRR
- 21.6%
- Equity multiple
- 2.75×
- Total profit
- $92,972
- Equity at exit
- $171,077
- IRR
- 19.5%
- Equity multiple
- 6.30×
- Total profit
- $281,865
- Equity at exit
- $368,934
Cash invested: $53,172 (down + closing). Projections, not guarantees.
Landlord ↔ Tenant lean methodology
- Overall (STATE)
- 83 Strongly Landlord-Friendly
- State Oklahoma
- 83 Strongly Landlord-Friendly · R+20
- County
- — inherits STATE
- City
- — inherits STATE
ZIP-level market 74301
- Home prices YoY
- 7.1%
- Active inventory
- 113
- Price-to-rent
- 12.1×
Monthly cashflow live
- Estimated rent
- $1,308 medium interval (Pro) →
- Mortgage (P&I)
- −$996
- Tax from tax record
- −$122 /mo · $1,458/yr
- Insurance
- −$79
- HOA
- −$0
- Vacancy / Maint / Mgmt
- −$275
- Net cashflow
- $-163
Break-even live
Sensitivity live
| Price | -10% $-56 | -5% $-110 | +0% $-163 | +5% $-217 | +10% $-271 |
|---|---|---|---|---|---|
| Rent | -10% $-267 | -5% $-215 | +0% $-163 | +5% $-112 | +10% $-60 |
| Rate | -1.0pp $-68 | -0.5pp $-115 | base $-163 | +0.5pp $-213 | +1.0pp $-263 |
UW: 25.0% down · 7.5% · 30yr · 1.5% tax · 5.0% vac · 8.0% maint · 8.0% mgmt
Financing live
Cash to close
- Down payment
- $47,475
- Closing costs
- $5,697
- Reserves months
- —
- Total cash needed
- —
Loan-product check · same deal, 3 products live
Conventional
25% down · 7.5% · 30yr
- Down + closing
- —
- Monthly P&I
- —
- Monthly cashflow
- —
- DSCR
- —
- Eligible?
- —
Personal DTI + credit; lowest rate.
DSCR
20% down · 8.5% · 30yr
- Down + closing
- —
- Monthly P&I
- —
- Monthly cashflow
- —
- DSCR
- —
- Eligible?
- —
No personal income docs; deal must DSCR.
Hard money
10% down · 12.0% · 12mo
- Down + closing
- —
- Monthly P&I
- —
- Monthly cashflow
- —
- DSCR
- —
- Eligible?
- —
Short-term bridge; refi at stabilization.
Listing history 15 events
-
2026-06-22days on market $189,900 Active 18 DOM
-
2026-06-21days on market $189,900 Active 17 DOM
-
2026-06-21days on market $189,900 Active 16 DOM
-
2026-06-18days on market $189,900 Active 14 DOM
-
2026-06-17days on market $189,900 Active 13 DOM
-
2026-06-17price $189,900 Active 12 DOM
-
2026-06-16days on market $199,950 Active 12 DOM
-
2026-06-15days on market $199,950 Active 11 DOM
-
2026-06-13days on market $199,950 Active 9 DOM
-
2026-06-12days on market $199,950 Active 8 DOM
-
2026-06-09days on market $199,950 Active 5 DOM
-
2026-06-08days on market $199,950 Active 4 DOM
-
2026-06-08days on market $199,950 Active 3 DOM
-
2026-06-07remarks 695-char remark
-
2026-06-07$199,950 Active 2 DOM
ⓘ Source: listings_history table (triggers on properties + properties_extension) + one-shot
backfill from property_details.listing_events for pre-trigger history.
Tax reassessment forecast OK · Resets to sale price
- Current annual tax
- $1,458 · $122/mo
- Projected year-2 tax
- $1,709 · $142/mo
- Expected delta
- +$251/yr (+$21/mo · 17.2%)
ⓘ Screening estimate from a state-policy table — verify with the county assessor before closing.
Climate risk First Street
- Flood 1/10 Low FEMA zone X (unshaded) · 0% chance over 30 yrs
- Wildfire 5/10 Major
- Heat 6/10 Major 7 d/yr ≥110°F today · 21 d/yr by 30 yrs out
- Wind 2/10 Low 3% chance of damaging wind over 30 yrs
- Air quality 2/10 Low 1 unhealthy d/yr today · 2 by 30 yrs out
Nearby sold comps map
Loading sold comps map…
Walkable amenities ~0.75 mi
Loading nearby amenities…
Taxation est. · year 1
- Rental income
- $15,694
- − Mortgage interest
- −$10,637
- − Property taxes
- −$1,458
- − Insurance
- −$950
- − Repairs & maintenance
- −$1,256
- − Management
- −$1,256
- − Depreciation
- −$5,524
- Taxable loss
- −$5,386
- Est. tax savings @ 24.0%
- +$1,293
- After-tax cash flow
- $-667/yr
For passive investors: Depreciation is non-cash, so a rental often shows a tax loss while cash-flowing — sheltering income. Rental losses are passive: they offset passive income freely, and up to $25,000/yr can offset ordinary (W-2) income if you actively participate and your MAGI is under $100k (phasing out to $0 by $150k); unused losses carry forward. On sale, claimed depreciation is recaptured at up to 25%, and gains may owe capital-gains tax (a 1031 exchange can defer both). Figures are a year-1 estimate at your 24.0% rate — not tax advice; consult a CPA.
Schools (NCES district)
- District
- Vinita
- NCES district ID
- 4031290
- Math proficiency
- 24% ▼ -10.00%
- Reading proficiency
- 20% ▼ -7.00%
- Median HH income
- $37,171
- Composite
- 18.37/100
- National rank
- #8943
- State rank
- #156 of 270 in OK
Livability — Vinita
- Score
- 63/100
- State rank
- #227
- US rank
- #15843
Category grades
Schools grade is shown separately in the Schools card above.
Census & demographics
- Census place
- Vinita, OK
- Population (ZIP)
- 11,126
Population outlook (Craig County) Hauer SSP2
- Today (2025)
- 14,522 people
- By 2030
- 14,263 · -1.8%
- By 2040
- 13,814 · -4.9%
- By 2050
- 13,457 · -7.3%
- By 2075
- 13,123 · -9.6%
- By 2100
- 12,323 · -15.1%
Race, ethnicity, and origin ACS 2023
- Neighborhood character
- Diverse neighborhood (Simpson 0.64)
- Race & ethnicity
- White 60% Native American 20% Two or more races 12% Black 4% Hispanic / Latino 4% Asian 1%
- Common ancestry
- Slovak 2% Lithuanian 1% Italian 1%
- Foreign-born
- 2% · Canada, Vietnam
- Languages at home
- 96% English-only · Spanish 3% Other Asian/Pacific 1%
Political lean MEDSL · Craig
- 2024 margin
- Solid R (+58.3) · D 20.0% · R 78.3% · Other 1.7%
- 2008→2024 swing
- -28.2pp toward R · 2008: -30.1pp · 2024: -58.3pp
- All cycles
- 2024: R+58.3 2020: R+57.5 2016: R+52.4 2012: R+34.1 2008: R+30.1
Not yet ingested
- Civics
- —
Market trends
- HPI YoY
- ▲ 17.37%
- Current HPI
- 262.4336
- Rent YoY
- —
- Metro
- —
- State GDP YoY
- ▲ 1.55%
- F500 in state
- 6
Industry mix (Fortune 500 HQ in OK)
| Industry | F500 HQs | Revenue |
|---|---|---|
| Energy | 3 | $48B |
|
||
Price history
+60.0% since first listed7 events — show timeline
- 2026-06-04 Listed $199,950 MLS Technology, Inc.
- 2017-10-25 Sold (Public Records) $130,000 Public Records
- 2011-11-04 Sold (MLS) $110,000 MLS Technology, Inc.
- 2011-09-19 Sold (Public Records) $110,000 Public Records
- 2011-06-14 Listed $115,000 MLS Technology, Inc.
- 2011-05-05 Listing Removed — MLS Technology, Inc.
- 2010-11-12 Listed $125,000 MLS Technology, Inc.
Property tax history
+2.6%/yrLatest (2025): $1,458 · -7.5% YoY. Source: county tax records.
Cash-flow waterfall
monthlySold comps — $/sqft
last 12 mo · ≤1 miLoading sold comps…