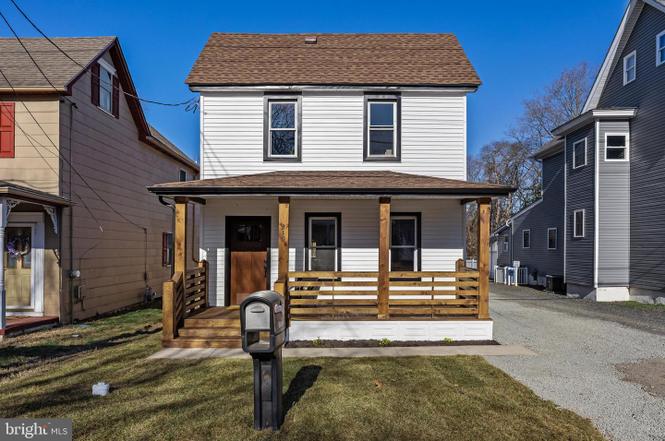
219 Lumberton Ave · Vincentown, NJ
Flood risk 1/10 · Minimal
- FEMA flood zone
- X (unshaded)
- Chance of flooding over 30 yrs
- 0.0%
- Est. flood insurance / yr
- $507 – $1,088
Fire risk 1/10 · Minimal
- Est. fire insurance / yr
- $526 – $976
Heat risk 7/10 · Major
- Hot days now (above 104°F)
- 7 days/yr
- Hot days in 30 yrs
- 15 days/yr
Wind risk 6/10 · Moderate
- Chance of severe wind over 30 yrs
- 55.0%
Air-quality risk 4/10 · Minor
- Unhealthy air days now
- 5 days/yr
- Unhealthy air days in 30 yrs
- 7 days/yr
Risk factors via First Street. Map © Google.
Why this score? — see what drove the D+ grade
The composite is a weighted blend of 9 inputs, each scored 0–100. Each bar is that input's sub-score; the figure is the points it added to the 100-point composite (weight × sub-score).
- Cash flow +13.4/30.0
- ARV discount +10.8/15.0
- Appreciation +4.3/10.0
- DSCR +4.0/10.0
- Schools +3.8/10.0
- 1% rule +3.2/10.0
- Rent growth +2.5/5.0
- Livability +2.5/5.0
- Condition / age +2.5/5.0
$389,000
🖨 Deal sheet (PDF) 📄 Offer letter ✓ Due diligence
Listing remarks
Welcome to 219 Lumberton Avenue, Hainesport, NJ. THIS HOME TRULEY HAS IT ALL! From the minute you walk up you can envision coffee on the front porch. As you enter the home you are stepping into a bright and airy Open Concept way of Living. Great for hosting family gatherings. Adequate Size Living Room with Hardwood Flooring and Ceiling Fan, Plenty of Natural Light flows nicely into the Kitchen/ Dining Area both with Hardwood Flooring, a Large Pinnacle adds to the Eating Space as well as plenty of Natural Light and Pendant Lighting and Recessed Lighting throughout. , Kitchen comes complete with Granite Counter tops with plenty of space for prepping meals and a Complete Stainless Steel Appli
Key facts
- Hardwood flooring
- Open concept
- Front porch
Tags
Property features AI
Exterior
- Parking: Two total garage/parking spaces; Driveway with two spaces; On-street parking available; Crushed stone private parking
- Utilities: Public water; Public sewer; 110 volt electric; Natural gas for heating and hot water
- Home design: Detached property; Excellent condition; Year built (effective): 2026; Living area measured by assessor
- Construction: Vinyl siding; Shingle roof; Concrete perimeter foundation; Replacement windows; Building not winterized
- Exterior features: Sidewalks; Porch(es); Patio(s); Shed
Interior
- Kitchen: Oven (self-cleaning); Refrigerator
- Bedrooms: Three bedrooms on the upper level
- Flooring: Carpet; Hardwood; Tile/brick
- Bathrooms: Two full bathrooms (both on upper level); One half bathroom on main level
- Heating & cooling: Forced air heating (natural gas); Central air conditioning (electric)
- Interior features: Attic; Combination kitchen/dining; Kitchen with table space; Master bathroom with soaking tub and tub/shower; Walk-in closet(s); Not furnished
- Laundry & utility: Washer and dryer; Laundry on main floor
Neighborhood map
What this means for you Summary
Snapshot
- This is a 3-bed/2.5-bath single-family listed at $389k.
Deal economics
- At list price, monthly cash flow is $10 ($120/yr) — positive.
- The deal already cash-flows at list — no discount required.
- To meet the 1% rule (rent ≥ 1% of price), the offer needs to be $320k (17.7% below list).
- Recommended offer: $320k (17.7% below list) — sets the bar for 1% rule.
- Cap rate 6.3% vs local median 4.5% in Vincentown — top-decile yield for the area; either an underpriced asset or a hidden risk that comps aren't pricing in. Stress-test before assuming the spread holds.
Location & tenants
- Location reads: area grade D — affects rentability + tenant quality, not the cash-flow math above.
- Hainesport Township School District (suburban): math 27% / reading 53% proficiency, ranked #205 of 472 in NJ (top 43%) — families likely to look elsewhere, expect single-tenant / working-renter base with shorter leases; only 10% free/reduced lunch — higher-income household profile.
- Market conditions: 31 active listings in the ZIP; 1 comparable units currently listed for rent nearby; 2,161 units permitted in Burlington County in 2024 (988 in 5+ unit buildings).
Forward outlook
- Local home prices are declining (-1.4%/yr); year-one equity from $3k of loan paydown is wiped out by about $5k of value loss. Plan a longer hold.
- Burlington County population projected to shrink 5% by 2050 — rents likely to lag national; underwrite the cash flow, not the appreciation.
Negotiation context
- It's been on market 100 days — a 9% lower offer ($354k) is reasonable based on typical stale-listing flexibility.
- 14 sale attempts since 25y ago; this cycle's ask has dropped $36k (8%) from the opening price — seller is motivated, your offer sets the floor, not the list.
- Current owner paid $205k; list at $389k implies a 90% gain — meaningful room to come down on a strong offer.
Risks & watch-outs
- Watch-outs: built in 1820 — expect roof / HVAC / electrical / plumbing capex.
- Climate carrying-cost: major wind risk, 55% chance of damaging wind over 30y; extreme-heat days projected 7→15/yr by 2055 (HVAC capex compounding) — expect insurance premiums to compound above CPI over the hold.
Questions for the listing agent
- It's been on market 100 days. Have you received any prior offers? Is the seller open to a 18% concession, seller financing, or rate buy-down credit?
- Built in 1820 — when were the roof, HVAC, electrical panel, plumbing, and water heater last replaced?
- Why hasn't it sold? Are there any deal-killer items the seller is aware of (foundation, flood, title, zoning, code violations)?
- Is there a deadline driving the sale (1031 exchange, divorce, estate, relocation)? That informs how much negotiation room exists.
- The area grade is low — what's the realistic commute time and amenity access for the typical tenant pool here? Any planned neighborhood developments (good or bad) we should know about?
- What's the average days-on-market for RENTAL listings here right now (not sales)? A rising rental-DOM trend means longer vacancies and softer asking-rent achievability than the comps imply.
- What's the recent tenant-quality profile in this submarket — average credit score on applications, eviction rate, late-payment / NSF rate, and stable-employment percentage? A property-management company in the area should have these aggregated.
- How much new for-sale + rental construction is in the pipeline within 1–3 miles? Heavy new supply typically softens prices + rents 12–24 months out; constrained supply supports both.
Investment metrics
- 1% rule
- 0.82% ✗
- Cap rate
- 6.32%
- Cash-on-cash
- 0.11%
- DSCR
- 1.00
- GRM
- 10.1
CMA / ARV
- ARV (on-the-fly)
- $419,584
- Comps found
- 7
Show comp detail 7 sales within ~0.75 mi
| Address | Dist | Beds/Ba | Sqft | Sold | Price | $/sf | Match |
|---|---|---|---|---|---|---|---|
| 1611 Marne Hwy | 0.37mi | 3/1.5 | 1,440 (+2%) | 9mo | $480,000 | $333 | 68 |
| 20 Lumberton Rd | 0.23mi | 3/2.0 | 1,360 (-3%) | 17mo | $430,000 | $316 | 68 |
| 117 Pine Ln | 0.70mi | 3/1.0 | 1,428 (+1%) | 1mo | $350,000 | $245 | 58 |
| 112 Pine Ln | 0.66mi | 3/2.0 | 1,472 (+4%) | 7mo | $465,000 | $316 | 54 |
| 4 Pine Ln | 0.59mi | 4/2.0 (+1) | 1,320 (-6%) | 4mo | $285,000 | $216 | 51 |
| 1007 Marne Hwy | 0.61mi | 3/1.0 | 1,342 (-5%) | 13mo | $350,000 | $261 | 47 |
| 3 Pine Ln | 0.61mi | 3/1.0 | 1,234 (-12%) | 21mo | $367,500 | $298 | 27 |
Match score weights: distance 35% · size 25% · config 20% · recency 20%. Top-matched comps best support the ARV.
Projected returns pro-forma
-1.36% appreciation · 3.0% rent growth · sell at horizon
- IRR
- -7.6%
- Equity multiple
- 0.68×
- Total profit
- $-34,953
- Equity at exit
- $87,256
- IRR
- -0.5%
- Equity multiple
- 0.96×
- Total profit
- $-4,492
- Equity at exit
- $86,077
Cash invested: $108,920 (down + closing). Projections, not guarantees.
Landlord ↔ Tenant lean methodology
- Overall (STATE)
- 21 Tenant-Leaning
- State New Jersey
- 21 Tenant-Leaning · D+6
- County
- — inherits STATE
- City
- — inherits STATE
ZIP-level market 08036
- Home prices YoY
- -0.5%
- Active inventory
- 31
- Price-to-rent
- 10.1×
Monthly cashflow live
- Estimated rent
- $3,200 medium interval (Pro) →
- Mortgage (P&I)
- −$2,040
- Tax from tax record
- −$316 /mo · $3,791/yr
- Insurance
- −$162
- HOA
- −$0
- Vacancy / Maint / Mgmt
- −$672
- Net cashflow
- $10
Break-even live
Sensitivity live
| Price | -10% $230 | -5% $120 | +0% $10 | +5% $-100 | +10% $-210 |
|---|---|---|---|---|---|
| Rent | -10% $-243 | -5% $-116 | +0% $10 | +5% $136 | +10% $263 |
| Rate | -1.0pp $206 | -0.5pp $109 | base $10 | +0.5pp $-91 | +1.0pp $-193 |
UW: 25.0% down · 7.5% · 30yr · 1.5% tax · 5.0% vac · 8.0% maint · 8.0% mgmt
Financing live
Cash to close
- Down payment
- $97,250
- Closing costs
- $11,670
- Reserves months
- —
- Total cash needed
- —
Loan-product check · same deal, 3 products live
Conventional
25% down · 7.5% · 30yr
- Down + closing
- —
- Monthly P&I
- —
- Monthly cashflow
- —
- DSCR
- —
- Eligible?
- —
Personal DTI + credit; lowest rate.
DSCR
20% down · 8.5% · 30yr
- Down + closing
- —
- Monthly P&I
- —
- Monthly cashflow
- —
- DSCR
- —
- Eligible?
- —
No personal income docs; deal must DSCR.
Hard money
10% down · 12.0% · 12mo
- Down + closing
- —
- Monthly P&I
- —
- Monthly cashflow
- —
- DSCR
- —
- Eligible?
- —
Short-term bridge; refi at stabilization.
Rent comps 1 comps
| Address | Beds | Baths | Sqft | Rent | $/sqft | DOM | Units | Dist |
|---|---|---|---|---|---|---|---|---|
| 509 Hainesport Lumberton Rd Unit 1 Hainesport, NJ | 3.0 | 2.0 | 1100 | $3,200 | $2.91 | 2d | 1 | 0.16mi |
Listing history 50 events
-
2026-06-21pricedays on market $389,000 Active 100 DOM
-
2026-06-18days on market $399,000 Active 97 DOM
-
2026-06-17days on market $399,000 Active 96 DOM
-
2026-06-16days on market $399,000 Active 95 DOM
-
2026-06-15days on market $399,000 Active 94 DOM
-
2026-06-13days on market $399,000 Active 92 DOM
-
2026-06-09days on market $399,000 Active 88 DOM
-
2026-06-08days on market $399,000 Active 87 DOM
-
2026-06-07days on market $399,000 Active 86 DOM
-
2026-06-04days on market $399,000 Active 83 DOM
-
2026-06-03days on market $399,000 Active 82 DOM
-
2026-06-02days on market $399,000 Active 81 DOM
-
2026-06-02price $399,000 Active 80 DOM
-
2026-06-01days on market $409,000 Active 80 DOM
-
2026-05-31days on market $409,000 Active 79 DOM
-
2026-05-20price $409,000
-
2026-04-28price $414,000
-
2026-04-09price $419,000
-
2026-04-09price $219,000
-
2026-03-13$425,000 Active
-
2025-09-17soldstatus $205,000
-
2023-01-07historical
-
2023-01-04status Active
-
2023-01-02historical
-
2022-12-13price $198,000
-
2022-12-01status Active
-
2022-11-19historical
-
2022-11-19price $229,000
-
2022-11-19status Active
-
2022-11-19historical
-
2022-11-19historical
-
2018-04-22historical
-
2018-04-12price $169,000
-
2018-04-10$155,000 Active
-
2016-09-30historical
-
2016-03-31$169,900
-
2015-10-16historical
-
2015-10-14soldstatus $47,324 Sold
-
2015-10-14soldstatus $47,324
-
2015-08-05status Under Contract
-
2015-08-04historical
-
2015-07-27price $55,200
-
2015-07-09status Active
-
2015-06-29historical
-
2015-06-04price $65,200
-
2015-05-27status Active
-
2015-05-19historical
-
2015-05-04price $75,120
-
2015-04-10price $83,420
-
2015-04-01$92,620 Active
ⓘ Source: listings_history table (triggers on properties + properties_extension) + one-shot
backfill from property_details.listing_events for pre-trigger history.
Tax reassessment forecast NJ · Partial reset (capped growth)
- Current annual tax
- $3,791 · $316/mo
- Projected year-2 tax
- $6,739 · $562/mo
- Expected delta
- +$2,947/yr (+$246/mo · 77.7%)
ⓘ Screening estimate from a state-policy table — verify with the county assessor before closing.
Climate risk First Street
- Flood 1/10 Low FEMA zone X (unshaded) · 0% chance over 30 yrs
- Wildfire 1/10 Low
- Heat 7/10 Severe 7 d/yr ≥104°F today · 15 d/yr by 30 yrs out
- Wind 6/10 Major 55% chance of damaging wind over 30 yrs
- Air quality 4/10 Moderate 5 unhealthy d/yr today · 7 by 30 yrs out
Nearby sold comps map
Loading sold comps map…
Walkable amenities ~0.75 mi
Loading nearby amenities…
Taxation est. · year 1
- Rental income
- $38,400
- − Mortgage interest
- −$21,790
- − Property taxes
- −$3,791
- − Insurance
- −$1,945
- − Repairs & maintenance
- −$3,072
- − Management
- −$3,072
- − Depreciation
- −$11,316
- Taxable loss
- −$6,587
- Est. tax savings @ 24.0%
- +$1,581
- After-tax cash flow
- $1,701/yr
For passive investors: Depreciation is non-cash, so a rental often shows a tax loss while cash-flowing — sheltering income. Rental losses are passive: they offset passive income freely, and up to $25,000/yr can offset ordinary (W-2) income if you actively participate and your MAGI is under $100k (phasing out to $0 by $150k); unused losses carry forward. On sale, claimed depreciation is recaptured at up to 25%, and gains may owe capital-gains tax (a 1031 exchange can defer both). Figures are a year-1 estimate at your 24.0% rate — not tax advice; consult a CPA.
Schools (NCES district)
- District
- Hainesport Township School District
- NCES district ID
- 3406420
- Math proficiency
- 27% ▼ -29.00%
- Reading proficiency
- 53% ▼ -12.00%
- Median HH income
- $88,435
- Composite
- 38.07/100
- National rank
- #4283
- State rank
- #205 of 472 in NJ
Livability — Vincentown
No livability data for this city. (Only ~50 U.S. cities are tracked.)
Census & demographics
- Population (ZIP)
- 6,028
Population outlook (Burlington County) Hauer SSP2
- Today (2025)
- 453,425 people
- By 2030
- 452,359 · -0.2%
- By 2040
- 445,033 · -1.9%
- By 2050
- 431,760 · -4.8%
- By 2075
- 406,277 · -10.4%
- By 2100
- 364,732 · -19.6%
Race, ethnicity, and origin ACS 2023
- Neighborhood character
- Predominantly White (69%)
- Race & ethnicity
- White 69% Hispanic / Latino 11% Two or more races 7% Asian 7% Black 6%
- Hispanic origin (detail)
- Puerto Rican 6% Cuban 1%
- Common ancestry
- Romanian 5% Scotch-Irish 2% Italian 1%
- Foreign-born
- 7% · Canada, South Korea, Guatemala
- Languages at home
- 88% English-only · Spanish 6% Other Indo-European 2% Tagalog/Filipino 1%
Political lean MEDSL · Burlington
- 2024 margin
- D (+16.6) · D 57.6% · R 41.0% · Other 1.3%
- 2008→2024 swing
- -2.0pp toward R · 2008: 18.6pp · 2024: 16.6pp
- All cycles
- 2024: D+16.6 2020: D+19.5 2016: D+14.8 2012: D+18.7 2008: D+18.6
Not yet ingested
- Civics
- —
Market trends
- HPI YoY
- ▼ -1.36%
- Current HPI
- 302.0676
- Rent YoY
- —
- Metro
- —
- State GDP YoY
- ▲ 2.05%
- F500 in state
- 34
Industry mix (Fortune 500 HQ in NJ)
| Industry | F500 HQs | Revenue |
|---|---|---|
| Consumer Goods | 3 | $31B |
|
||
| Pharmaceuticals | 2 | $153B |
|
||
| Technology | 2 | $21B |
|
||
| Insurance | 2 | $20B |
|
||
| Healthcare | 2 | $19B |
|
||
| Financial Services | 1 | $70B |
|
||
Price history
+643.6% since first listed45 events — show timeline
- 2026-05-20 Price Changed $409,000 BRIGHT MLS
- 2026-04-28 Price Changed $414,000 BRIGHT MLS
- 2026-04-09 Price Changed $419,000 BRIGHT MLS
- 2026-04-09 Price Changed $219,000 BRIGHT MLS
- 2026-03-13 Listed $425,000 BRIGHT MLS
- 2025-09-17 Sold (Public Records) $205,000 Public Records
- 2023-01-07 Listing Removed — BRIGHT MLS
- 2023-01-04 Relisted — BRIGHT MLS
- 2023-01-02 Listing Removed — BRIGHT MLS
- 2022-12-13 Price Changed $198,000 BRIGHT MLS
- 2022-12-01 Relisted — BRIGHT MLS
- 2022-11-19 Listing Removed — BRIGHT MLS
- 2022-11-19 Price Changed $229,000 BRIGHT MLS
- 2022-11-19 Relisted — BRIGHT MLS
- 2022-11-19 Listing Removed — BRIGHT MLS
- 2022-11-19 Coming Soon — BRIGHT MLS
- 2018-04-22 Listing Removed — BRIGHT MLS
- 2018-04-12 Price Changed $169,000 BRIGHT MLS
- 2018-04-10 Listed $155,000 BRIGHT MLS
- 2016-09-30 Listing Removed — BRIGHT MLS
- 2016-03-31 Listed $169,900 BRIGHT MLS
- 2015-10-16 Delisted — TREND
- 2015-10-14 Sold (MLS) $47,324 BRIGHT MLS
- 2015-10-14 Sold (MLS) $47,324 TREND
- 2015-08-05 Pending — TREND
- 2015-08-04 Listing Removed — BRIGHT MLS
- 2015-07-27 Price Changed $55,200 TREND
- 2015-07-09 Relisted — TREND
- 2015-06-29 Delisted — TREND
- 2015-06-04 Price Changed $65,200 TREND
- 2015-05-27 Relisted — TREND
- 2015-05-19 Delisted — TREND
- 2015-05-04 Price Changed $75,120 TREND
- 2015-04-10 Price Changed $83,420 TREND
- 2015-04-01 Listed $92,620 TREND
- 2015-04-01 Listed $55,200 BRIGHT MLS
- 2012-01-03 Listing Removed — BRIGHT MLS
- 2012-01-03 Listing Removed — BRIGHT MLS
- 2011-06-01 Listed $190,000 BRIGHT MLS
- 2011-01-02 Listed $190,000 BRIGHT MLS
- 2002-04-15 Listing Removed — BRIGHT MLS
- 2002-04-15 Listed $139,900 BRIGHT MLS
- 2001-10-26 Sold (MLS) $55,000 BRIGHT MLS
- 2001-10-03 Listing Removed — BRIGHT MLS
- 2001-09-21 Listed $55,000 BRIGHT MLS
Property tax history
+2.3%/yrLatest (2025): $3,791 · +10.6% YoY. Source: county tax records.
Cash-flow waterfall
monthlySold comps — $/sqft
last 12 mo · ≤1 miLoading sold comps…