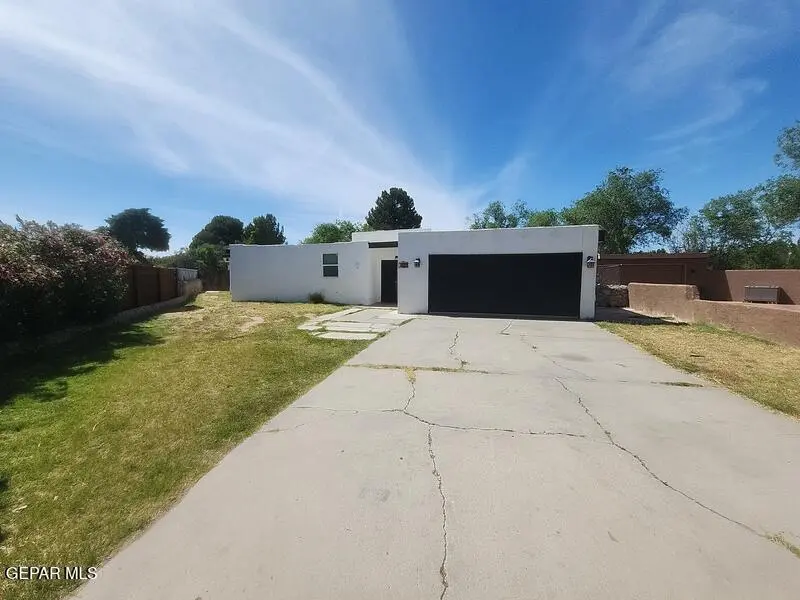
129 Serrania Dr · El Paso, TX
Flood risk 1/10 · Minimal
- FEMA flood zone
- AE
- Chance of flooding over 30 yrs
- 0.0%
- Est. flood insurance / yr
- $1,737 – $8,500
Fire risk 4/10 · Minor
- Est. fire insurance / yr
- $1,222 – $2,270
Heat risk 6/10 · Moderate
- Hot days now (above 101°F)
- 7 days/yr
- Hot days in 30 yrs
- 23 days/yr
Wind risk 1/10 · Minimal
- Chance of severe wind over 30 yrs
- —
Air-quality risk 2/10 · Minimal
- Unhealthy air days now
- 1 days/yr
- Unhealthy air days in 30 yrs
- 1 days/yr
Risk factors via First Street. Map © Google.
Why this score? — see what drove the B grade
The composite is a weighted blend of 9 inputs, each scored 0–100. Each bar is that input's sub-score; the figure is the points it added to the 100-point composite (weight × sub-score).
- Cash flow +30.0/30.0
- 1% rule +10.0/10.0
- DSCR +10.0/10.0
- ARV discount +7.5/15.0
- Livability +4.0/5.0
- Rent growth +3.8/5.0
- Schools +2.7/10.0
- Condition / age +2.5/5.0
- Appreciation +0.0/10.0
$169,000
🖨 Deal sheet 📄 Offer letter ✓ Due diligence
Listing remarks
Investors, flippers, or experienced DIY homebuyers looking for a bargain in desirable neighborhoods. 5-bedroom, 3-bathroom home nestled in the desirable Upper Valley. property sits on over a quarter-acre lot and offers both privacy and comfort in a quiet cul-de-sac setting. This property may qualify for seller financing (Vendee).
Key facts
- 0.27 acre lot
- Garage
- Built 1977
Property features AI
Finance
- Other: Property on a 0.27-acre lot; Total building area approximately 3,295
Exterior
- Home design: Single family residence
- Construction: Stucco construction; Flat roof
- Exterior features: See remarks for exterior details; Flat roof; Stucco exterior
Interior
- Kitchen: Appliances listed in remarks
- Flooring: Tile
- Bathrooms: Three full bathrooms
- Heating & cooling: Heating: see remarks; No central cooling
- Interior features: See remarks for additional interior details; Tile flooring; No window treatments; One fireplace
Neighborhood map
What this means for you Summary
Snapshot
- This is a 4-bed/2.0-bath single-family listed at $169k.
Deal economics
- At list price, monthly cash flow is $951 ($11k/yr) — positive.
- The deal already cash-flows at list — no discount required.
- Meets the 1% rule at list price ($3k rent vs $169k).
Location & tenants
- Location reads 81/100 on livability (#23 in TX, #1,375 nationally) — a professional / high-income tenant draw. Strengths: commute A+, cost of living A+, housing A+; Watch: employment D+.
- El Paso ISD (urban): math 27% / reading 37% proficiency, ranked #591 of 826 in TX (top 72%) — families likely to look elsewhere, expect single-tenant / working-renter base with shorter leases; 65% free/reduced lunch — lower-income household profile, screen leases tightly.
- Zoned schools: Don Haskins Pk-8 (1,674 students, 68% FRL); Franklin H S (math 45% / reading 63%, grade C-, #422 of 1,632 statewide, top 26%, 3,149 students, 54% FRL) — zoned schools at 61% FRL track the district average.
- Zoned-school proficiency averages 54% at this address vs 32% district-wide (+22 pts) — the actual schools serving this property are materially stronger than the El Paso ISD average implies; a family-tenant draw the district grade alone would hide.
- Market conditions: Rents rising fast (+5.0%/yr); 255 active listings in the ZIP; 5 comparable units currently listed for rent nearby; rentals at typical pace (median 14d on market — plan ~3-4 weeks tenant-placement turnaround); solid renter incomes; 2,196 units permitted in El Paso County in 2024 (143 in 5+ unit buildings).
- At $3,223/mo this rent would consume 49% of the median local household income ($78k/yr) (locally 655% of renters already pay >50% of income on rent) — very limited rent-growth headroom before tenants either downsize or default.
Forward outlook
- Local home prices are declining (-3.0%/yr); year-one equity from $1k of loan paydown is wiped out by about $5k of value loss. Plan a longer hold.
- El Paso County population projected at +10% by 2050 — modest demand growth; plan on rents tracking national, not racing it.
- At projected returns (-3.0% appreciation + 5.0% rent growth), your $47k cash investment doubles in ~5 years — after that, you're playing with house money.
Negotiation context
- Only 3 days on market — expect competitive offers; lowballing is unlikely to land.
- 10 sale attempts since 8y ago with the ask held roughly flat each time — persistent listings suggest the price (not the market) is what's stuck; bring a comps-based counter.
- Current owner paid $108k; list at $169k implies a 56% gain — meaningful room to come down on a strong offer.
Risks & watch-outs
- Watch-outs: flood insurance adds $427/mo.
- Climate carrying-cost: in FEMA flood zone AE (mandatory federal flood insurance); extreme-heat days projected 7→23/yr by 2055 (HVAC capex compounding) — expect insurance premiums to compound above CPI over the hold.
Questions for the listing agent
- Built in 1977 — when were the roof, HVAC, electrical panel, plumbing, and water heater last replaced?
- What's the actual annual flood-insurance premium (NFIP or private), and is the property in a SFHA with mandatory coverage?
- Is there a deadline driving the sale (1031 exchange, divorce, estate, relocation)? That informs how much negotiation room exists.
- Schools are B-rated — typically a magnet for longer-tenancy family renters. What's the average tenant stay here, and is there a school-zone premium baked into asking?
- What's the average days-on-market for RENTAL listings here right now (not sales)? A rising rental-DOM trend means longer vacancies and softer asking-rent achievability than the comps imply.
- What's the recent tenant-quality profile in this submarket — average credit score on applications, eviction rate, late-payment / NSF rate, and stable-employment percentage? A property-management company in the area should have these aggregated.
- How much new for-sale + rental construction is in the pipeline within 1–3 miles? Heavy new supply typically softens prices + rents 12–24 months out; constrained supply supports both.
Investment metrics
- 1% rule
- 1.91% ✓
- Cap rate
- 16.08%
- Cash-on-cash
- 34.94%
- DSCR
- 2.55
- GRM
- 4.4
CMA / ARV
No comps found within radius.
Projected returns pro-forma
-3.0% appreciation · 5.03% rent growth · sell at horizon
- IRR
- 20.2%
- Equity multiple
- 1.85×
- Total profit
- $40,237
- Equity at exit
- $25,198
- IRR
- 30.1%
- Equity multiple
- 4.02×
- Total profit
- $143,053
- Equity at exit
- $14,612
Cash invested: $47,320 (down + closing). Projections, not guarantees.
Landlord ↔ Tenant lean methodology
- Overall (STATE)
- 87 Strongly Landlord-Friendly
- State Texas
- 87 Strongly Landlord-Friendly · R+5
- County
- — inherits STATE
- City
- — inherits STATE
ZIP-level market 79932
- Home prices YoY
- -31.8%
- Rents YoY
- 5.0%
- Active inventory
- 255
- Price-to-rent
- 4.4×
Monthly cashflow live
- Estimated rent
- $3,223 high interval (Pro) →
- Mortgage (P&I)
- −$886
- Tax est. 1.5%
- −$211 /mo · $2,535/yr
- Insurance
- −$70
- Flood insurance flood zone
- −$427 /mo · $5,118/yr
- HOA
- −$0
- Vacancy / Maint / Mgmt
- −$677
- Net cashflow
- $951
Break-even live
UW: 25.0% down · 7.5% · 30yr · 1.5% tax · 5.0% vac · 8.0% maint · 8.0% mgmt
Financing live
Cash to close
- Down payment
- $42,250
- Closing costs
- $5,070
- Reserves months
- —
- Total cash needed
- —
Loan-product check · same deal, 3 products live
Conventional
25% down · 7.5% · 30yr
- Down + closing
- —
- Monthly P&I
- —
- Monthly cashflow
- —
- DSCR
- —
- Eligible?
- —
Personal DTI + credit; lowest rate.
DSCR
20% down · 8.5% · 30yr
- Down + closing
- —
- Monthly P&I
- —
- Monthly cashflow
- —
- DSCR
- —
- Eligible?
- —
No personal income docs; deal must DSCR.
Hard money
10% down · 12.0% · 12mo
- Down + closing
- —
- Monthly P&I
- —
- Monthly cashflow
- —
- DSCR
- —
- Eligible?
- —
Short-term bridge; refi at stabilization.
Rent comps 5 comps
| Address | Beds | Baths | Sqft | Rent | $/sqft | DOM | Units | Dist |
|---|---|---|---|---|---|---|---|---|
| 5233 White Oak Dr El Paso, TX | 4.0 | 3.0 | 3095 | $4,100 | $1.32 | 19d | 1 | 0.82mi |
| 4945 Vista Grande Cir El Paso, TX | 3.0 | 2.5 | 3059 | $3,100 | $1.01 | 14d | 1 | 0.99mi |
| 5525 Valley Cedar Dr El Paso, TX | 4.0 | 2.5 | 2483 | $2,850 | $1.15 | 2d | 1 | 1.32mi |
| 520 Gomez Rd El Paso, TX | 4.0 | 2.5 | 3244 | $3,900 | $1.20 | 23d | 1 | 1.35mi |
| 712 Meadowlark Dr El Paso, TX | 5.0 | 4.0 | 3400 | $2,800 | $0.82 | 11d | 1 | 1.46mi |
Listing history 33 events
-
2026-05-12status Pending
-
2026-05-09$169,000 Active
-
2025-04-28historical
-
2025-04-21$419,950 Active
-
2024-05-03historical $3,295
-
2024-04-30price $3,295
-
2024-04-02price $3,695
-
2024-01-13$3,995
-
2023-12-28soldstatus
-
2022-08-04historical
-
2022-07-27soldstatus
-
2022-07-08$390,000 Active
-
2022-06-25historical
-
2022-06-09price $315,000
-
2022-06-01$305,000 Active
-
2021-02-24soldstatus
-
2021-01-11status Pending
-
2021-01-06price $275,000
-
2020-11-20$259,950 Active
-
2020-10-29historical
-
2020-10-17price $260,000
-
2020-08-20status Active
-
2020-08-04historical
-
2020-07-21$265,000 Active
-
2018-11-01soldstatus
-
2018-08-22$235,900 Active
-
2018-04-26historical
-
2018-04-07price $244,900
-
2018-03-21price $249,500
-
2018-02-13$254,500 Active
-
2000-06-01soldstatus
-
1993-09-29soldstatus $108,296
-
1987-01-09soldstatus
ⓘ Source: listings_history table (triggers on properties + properties_extension) + one-shot
backfill from property_details.listing_events for pre-trigger history.
Climate risk First Street
- Flood 1/10 Low FEMA zone AE · 0% chance over 30 yrs
- Wildfire 4/10 Moderate
- Heat 6/10 Major 7 d/yr ≥101°F today · 23 d/yr by 30 yrs out
- Wind 1/10 Low
- Air quality 2/10 Low 1 unhealthy d/yr today · 1 by 30 yrs out
Nearby sold comps map
Loading sold comps map…
Walkable amenities ~0.75 mi
Loading nearby amenities…
Taxation est. · year 1
- Rental income
- $38,672
- − Mortgage interest
- −$9,467
- − Property taxes
- −$2,535
- − Insurance
- −$5,964
- − Repairs & maintenance
- −$3,094
- − Management
- −$3,094
- − Depreciation
- −$4,916
- Taxable income
- $9,603
- Est. tax owed @ 24.0%
- −$2,305
- After-tax cash flow
- $9,112/yr
For passive investors: Depreciation is non-cash, so a rental often shows a tax loss while cash-flowing — sheltering income. Rental losses are passive: they offset passive income freely, and up to $25,000/yr can offset ordinary (W-2) income if you actively participate and your MAGI is under $100k (phasing out to $0 by $150k); unused losses carry forward. On sale, claimed depreciation is recaptured at up to 25%, and gains may owe capital-gains tax (a 1031 exchange can defer both). Figures are a year-1 estimate at your 24.0% rate — not tax advice; consult a CPA.
Schools (NCES district)
- District
- El Paso ISD
- NCES district ID
- 4818300
- Math proficiency
- 27% ▼ -24.00%
- Reading proficiency
- 37% ▼ -7.00%
- Median HH income
- $38,704
- Composite
- 26.75/100
- National rank
- #7138
- State rank
- #591 of 826 in TX
Livability — El Paso
- Score
- 81/100
- State rank
- #23
- US rank
- #1375
Category grades
Schools grade is shown separately in the Schools card above.
Census & demographics
- Census place
- El Paso, TX
- County
- El Paso County · 761,266 people
- City population
- 630,223
- Metro
- El Paso, TX
- Population (ZIP)
- 30,786
- Household income
- $78,277
- Rent vs Own
- Severe rent burden
- 655.0
Population outlook (El Paso County) Hauer SSP2
- Today (2025)
- 897,899 people
- By 2030
- 922,694 · +2.8%
- By 2040
- 960,492 · +7.0%
- By 2050
- 982,919 · +9.5%
- By 2075
- 997,266 · +11.1%
- By 2100
- 900,630 · +0.3%
Race, ethnicity, and origin ACS 2023
- Neighborhood character
- Predominantly Hispanic (79%)
- Race & ethnicity
- Hispanic / Latino 79% Two or more races 31% White 19%
- Hispanic origin (detail)
- Mexican 72%
- Common ancestry
- Slovak 1% Romanian 1% Serbian 1%
- Foreign-born
- 21% · Canada, Vietnam, Jamaica
- Languages at home
- 35% English-only · Spanish 62% French/Haitian/Cajun 1% German/W. Germanic 1%
Political lean MEDSL · El Paso
- 2024 margin
- D (+15.1) · D 57.0% · R 41.8% · Other 1.2%
- 2008→2024 swing
- -17.4pp toward R · 2008: 32.5pp · 2024: 15.1pp
- All cycles
- 2024: D+15.1 2020: D+35.1 2016: D+43.2 2012: D+32.6 2008: D+32.5
Not yet ingested
- Civics
- —
Market trends
- HPI YoY
- ▼ -108.39%
- Current HPI
- 232.2077
- Rent YoY
- ▲ 5.03%
- Metro
- El Paso, TX
- State GDP YoY
- ▲ 3.95%
- F500 in state
- 110
Industry mix (Fortune 500 HQ in TX)
| Industry | F500 HQs | Revenue |
|---|---|---|
| Energy | 16 | $1,198B |
|
||
| Technology | 5 | $198B |
|
||
| Engineering / Construction | 4 | $72B |
|
||
| Energy Services | 3 | $60B |
|
||
| Utilities | 3 | $41B |
|
||
| Healthcare | 2 | $330B |
|
||
Price history
+56.1% since first listed33 events — show timeline
- 2026-05-12 Pending — GEPARMLS
- 2026-05-09 Listed $169,000 GEPARMLS
- 2025-04-28 Listing Removed — GEPARMLS
- 2025-04-21 Listed $419,950 GEPARMLS
- 2024-05-03 Rental Removed $3,295 GEPARMLS
- 2024-04-30 Price Changed $3,295 GEPARMLS
- 2024-04-02 Price Changed $3,695 GEPARMLS
- 2024-01-13 Listed for Rent $3,995 GEPARMLS
- 2023-12-28 Sold (Public Records) — Public Records
- 2022-08-04 Listing Removed — GEPARMLS
- 2022-07-27 Sold (Public Records) — Public Records
- 2022-07-08 Listed $390,000 GEPARMLS
- 2022-06-25 Listing Removed — GEPARMLS
- 2022-06-09 Price Changed $315,000 GEPARMLS
- 2022-06-01 Listed $305,000 GEPARMLS
- 2021-02-24 Sold (Public Records) — Public Records
- 2021-01-11 Pending — GEPARMLS
- 2021-01-06 Price Changed $275,000 GEPARMLS
- 2020-11-20 Listed $259,950 GEPARMLS
- 2020-10-29 Listing Removed — GEPARMLS
- 2020-10-17 Price Changed $260,000 GEPARMLS
- 2020-08-20 Relisted — GEPARMLS
- 2020-08-04 Listing Removed — GEPARMLS
- 2020-07-21 Listed $265,000 GEPARMLS
- 2018-11-01 Sold (Public Records) — Public Records
- 2018-08-22 Listed $235,900 GEPARMLS
- 2018-04-26 Listing Removed — GEPARMLS
- 2018-04-07 Price Changed $244,900 GEPARMLS
- 2018-03-21 Price Changed $249,500 GEPARMLS
- 2018-02-13 Listed $254,500 GEPARMLS
- 2000-06-01 Sold (Public Records) — Public Records
- 1993-09-29 Sold (Public Records) $108,296 Public Records
- 1987-01-09 Sold (Public Records) — Public Records
Property tax history
+7.8%/yrLatest (2025): $10,626 · +1.8% YoY. Source: county tax records.
Cash-flow waterfall
monthlySold comps — $/sqft
last 12 mo · ≤1 miLoading sold comps…