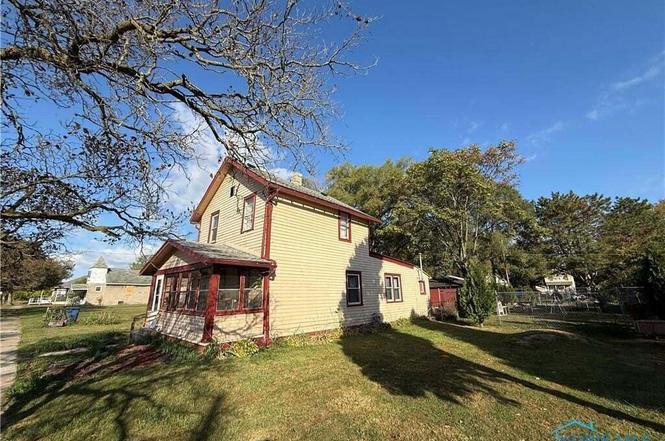
1219 Crystal St · Toledo, OH
Flood risk 1/10 · Minimal
- FEMA flood zone
- X (unshaded)
- Chance of flooding over 30 yrs
- 0.0%
- Est. flood insurance / yr
- $507 – $1,088
Fire risk 1/10 · Minimal
- Est. fire insurance / yr
- $713 – $1,323
Heat risk 3/10 · Minor
- Hot days now (above 100°F)
- 7 days/yr
- Hot days in 30 yrs
- 16 days/yr
Wind risk 2/10 · Minimal
- Chance of severe wind over 30 yrs
- —
Air-quality risk 2/10 · Minimal
- Unhealthy air days now
- 1 days/yr
- Unhealthy air days in 30 yrs
- 2 days/yr
Risk factors via First Street. Map © Google.
Why this score? — see what drove the D grade
The composite is a weighted blend of 9 inputs, each scored 0–100. Each bar is that input's sub-score; the figure is the points it added to the 100-point composite (weight × sub-score).
- Cash flow +15.0/30.0
- ARV discount +7.5/15.0
- 1% rule +5.0/10.0
- DSCR +5.0/10.0
- Rent growth +3.8/5.0
- Livability +3.3/5.0
- Condition / age +2.5/5.0
- Schools +1.6/10.0
- Appreciation +0.0/10.0
$20,000
🖨 Deal sheet 📄 Offer letter ✓ Due diligence
Listing remarks
DO NOT LOCK BOTTOM LOCK, only dead bolt. Home is back on the market due to buyer disappearing after home was cleared to close and approved by third party. This is the perfect opportunity for a savvy investor to bring a house back to its peak potential. This 3-bedroom property has a great layout, and with repair and finishing touches you will have a great home in no time!
Key facts
- 3,400 sq ft lot
- Garage
- Built 1892
Property features AI
Finance
- Other: Lot size approximately 0.08 acres
- HOA & community: Nearby community features: park, playground
Exterior
- Parking: Has garage; 2 parking spaces total; Attached garage; Alley access; Off-street and on-street parking available
- Utilities: Electricity connected (100 Amp service); Natural gas connected; Public water; Sanitary sewer connected
- Home design: Single-family residence; Residential property; Two levels / 2 stories; No shared/common walls; Entry facing details not provided
- Construction: Wood siding exterior; Shingle roof; Crawl space foundation; Built details not provided
- Exterior features: Front porch
Interior
- Kitchen: Kitchen on main level (approx. 8 x 14); Water heater
- Bedrooms: Primary bedroom on upper level (approx. 12 x 12); Bedroom 2 on upper level (approx. 10 x 12); Bedroom 3 on main level (approx. 10 x 10)
- Flooring: Other flooring
- Bathrooms: 1 full bathroom
- Heating & cooling: Forced air heating; Heating present
- Interior features: 6 total rooms; Other interior features
- Laundry & utility: Laundry located on main level
Neighborhood map
What this means for you Summary
Snapshot
- This is a 2-bed/1.0-bath single-family listed at $20k.
Deal economics
- At list price, monthly cash flow is $624 ($7k/yr) — positive.
- The deal already cash-flows at list — no discount required.
- Meets the 1% rule at list price ($965 rent vs $20k).
- Recommended offer: $18k (12.0% below list) — sets the bar for market timing.
- Cap rate 43.8% vs local median 7.6% in Toledo — top-decile yield for the area; either an underpriced asset or a hidden risk that comps aren't pricing in. Stress-test before assuming the spread holds.
Location & tenants
- Location reads 66/100 on livability (#645 in OH) — a middle-class / working-renter tenant base. Strengths: cost of living A+, housing A+, health & safety A+; Watch: amenities C-, crime F, commute F.
- Toledo City (urban): math 15% / reading 24% proficiency, ranked #634 of 656 in OH (top 97%) — low school quality limits family demand, transient renter base, plan for 1-2y turnover; 72% free/reduced lunch — lower-income household profile, screen leases tightly.
- Zoned schools: East Broadway Elementary School (math 4% / reading 11%, grade F, #1,518 of 1,584 statewide, top 96%, 411 students, 0% FRL); Waite High School (math 12% / reading 24%, grade F, #687 of 781 statewide, top 88%, 997 students, 0% FRL) — zoned schools average 0% FRL vs 72% district-wide (72 pts lower); this property's tenant base skews higher-income than the district average.
- Market conditions: Rents rising fast (+5.4%/yr); 117 active listings in the ZIP; 35 comparable units currently listed for rent nearby; rentals at typical pace (median 23d on market — plan ~3-4 weeks tenant-placement turnaround); 46% of comp listings sitting > 30 days — soft ceiling on asking rent; lower-income renter base — watch delinquency; 415 units permitted in Lucas County in 2024 (122 in 5+ unit buildings).
Forward outlook
- Local home prices are declining (-3.0%/yr); year-one equity from $138 of loan paydown is wiped out by about $600 of value loss. Plan a longer hold.
- Lucas County population projected at -16% by 2050 — secular population decline; favor cash flow + early exit over multi-decade hold.
- At projected returns (-3.0% appreciation + 5.4% rent growth), your $6k cash investment doubles in ~1 year — after that, you're playing with house money.
Negotiation context
- It's been on market 172 days — a 12% lower offer ($18k) is reasonable based on typical stale-listing flexibility.
- 3 sale attempts; this cycle's ask has dropped $5k (20%) from the opening price — seller is motivated, your offer sets the floor, not the list.
Risks & watch-outs
- Watch-outs: built in 1892 — expect roof / HVAC / electrical / plumbing capex.
Questions for the listing agent
- It's been on market 172 days. Have you received any prior offers? Is the seller open to a 12% concession, seller financing, or rate buy-down credit?
- Built in 1892 — when were the roof, HVAC, electrical panel, plumbing, and water heater last replaced?
- Why hasn't it sold? Are there any deal-killer items the seller is aware of (foundation, flood, title, zoning, code violations)?
- Is there a deadline driving the sale (1031 exchange, divorce, estate, relocation)? That informs how much negotiation room exists.
- Schools are D-rated, which usually means shorter tenancies and higher turnover. Who's the typical renter profile here, and what's been the actual vacancy rate?
- Crime grade is F in this area — have there been break-ins, vandalism, or insurance claims at this property in the last 3 years? What carrier currently insures it and at what premium?
- The area grade is low — what's the realistic commute time and amenity access for the typical tenant pool here? Any planned neighborhood developments (good or bad) we should know about?
- What's the average days-on-market for RENTAL listings here right now (not sales)? A rising rental-DOM trend means longer vacancies and softer asking-rent achievability than the comps imply.
- What's the recent tenant-quality profile in this submarket — average credit score on applications, eviction rate, late-payment / NSF rate, and stable-employment percentage? A property-management company in the area should have these aggregated.
- How much new for-sale + rental construction is in the pipeline within 1–3 miles? Heavy new supply typically softens prices + rents 12–24 months out; constrained supply supports both.
Investment metrics
- 1% rule
- 4.83% ✓
- Cap rate
- 43.75%
- Cash-on-cash
- 133.78%
- DSCR
- 6.95
- GRM
- 1.7
CMA / ARV
- ARV (on-the-fly)
- $89,936
- Comps found
- 12
Show comp detail 12 sales within ~0.75 mi
| Address | Dist | Beds/Ba | Sqft | Sold | Price | $/sf | Match |
|---|---|---|---|---|---|---|---|
| 1127 Varland Ave | 0.47mi | 2/1.0 | 1,227 (-0%) | 5mo | $28,050 | $23 | 73 |
| 1021 Liberty St | 0.29mi | 3/1.0 (+1) | 1,248 (+1%) | 8mo | $119,000 | $95 | 73 |
| 1734 Milroy St | 0.46mi | 3/1.0 (+1) | 1,204 (-2%) | 12mo | $99,900 | $83 | 60 |
| 1308 Halstead St | 0.61mi | 3/1.0 (+1) | 1,246 (+1%) | 6mo | $40,050 | $32 | 60 |
| 1537 Akron St | 0.56mi | 3/2.0 (+1) | 1,188 (-4%) | 3mo | $131,500 | $111 | 56 |
| 937 Berry St | 0.64mi | 3/1.0 (+1) | 1,282 (+4%) | 3mo | $63,000 | $49 | 56 |
| 709 Sylvester Ave | 0.45mi | 3/1.0 (+1) | 1,112 (-10%) | 8mo | $103,000 | $93 | 51 |
| 1207 E Broadway St | 0.33mi | 3/1.0 (+1) | 1,400 (+14%) | 7mo | $102,000 | $73 | 51 |
| 1225 Ellis Ave | 0.70mi | 3/1.0 (+1) | 1,253 (+2%) | 12mo | $43,000 | $34 | 50 |
| 1528 Hirzel St | 0.37mi | 3/1.0 (+1) | 1,092 (-11%) | 12mo | $53,000 | $49 | 49 |
| 1455 Oak St | 0.65mi | 3/1.0 (+1) | 1,116 (-9%) | 5mo | $63,500 | $57 | 45 |
| 1933 Watts Ave | 0.54mi | 3/1.0 (+1) | 1,075 (-13%) | 6mo | $176,500 | $164 | 44 |
Match score weights: distance 35% · size 25% · config 20% · recency 20%. Top-matched comps best support the ARV.
Projected returns pro-forma
-3.0% appreciation · 5.37% rent growth · sell at horizon
- IRR
- —
- Equity multiple
- 7.95×
- Total profit
- $38,893
- Equity at exit
- $2,982
- IRR
- —
- Equity multiple
- 18.01×
- Total profit
- $95,278
- Equity at exit
- $1,729
Cash invested: $5,600 (down + closing). Projections, not guarantees.
Landlord ↔ Tenant lean methodology
- Overall (STATE)
- 73 Landlord-Friendly
- State Ohio
- 73 Landlord-Friendly · R+6
- County
- — inherits STATE
- City
- — inherits STATE
ZIP-level market 43605
- Home prices YoY
- -25.6%
- Rents YoY
- 5.4%
- Active inventory
- 117
- Price-to-rent
- 1.7×
Monthly cashflow live
- Estimated rent
- $965 high interval (Pro) →
- Mortgage (P&I)
- −$105
- Tax est. 1.5%
- −$25 /mo · $300/yr
- Insurance
- −$8
- HOA
- −$0
- Vacancy / Maint / Mgmt
- −$203
- Net cashflow
- $624
Break-even live
UW: 25.0% down · 7.5% · 30yr · 1.5% tax · 5.0% vac · 8.0% maint · 8.0% mgmt
Financing live
Cash to close
- Down payment
- $5,000
- Closing costs
- $600
- Reserves months
- —
- Total cash needed
- —
Loan-product check · same deal, 3 products live
Conventional
25% down · 7.5% · 30yr
- Down + closing
- —
- Monthly P&I
- —
- Monthly cashflow
- —
- DSCR
- —
- Eligible?
- —
Personal DTI + credit; lowest rate.
DSCR
20% down · 8.5% · 30yr
- Down + closing
- —
- Monthly P&I
- —
- Monthly cashflow
- —
- DSCR
- —
- Eligible?
- —
No personal income docs; deal must DSCR.
Hard money
10% down · 12.0% · 12mo
- Down + closing
- —
- Monthly P&I
- —
- Monthly cashflow
- —
- DSCR
- —
- Eligible?
- —
Short-term bridge; refi at stabilization.
Rent comps 35 comps
| Address | Beds | Baths | Sqft | Rent | $/sqft | DOM | Units | Dist |
|---|---|---|---|---|---|---|---|---|
| 1537 Carlyle St Toledo, OH | 2.0 | 1.0 | 800 | $800 | $1.00 | 23d | 1 | 0.21mi |
| 1205 Liberty St Unit NA Toledo, OH | 3.0 | 1.0 | 864 | $1,195 | $1.38 | 43d | 1 | 0.24mi |
| 1411 Oakmont St Toledo, OH | 1.0 | 1.0 | 750 | $800 | $1.07 | 13d | 1 | 0.45mi |
| 1537 Remington St Toledo, OH | 3.0 | 1.0 | 1064 | $1,095 | $1.03 | 43d | 1 | 0.53mi |
| 1106 White St Toledo, OH | 3.0 | 1.0 | 1200 | $1,015 | $0.85 | 13d | 1 | 0.59mi |
| 908 Forsythe St Unit Downstairs Toledo, OH | 3.0 | 1.0 | 1164 | $950 | $0.82 | 43d | 1 | 0.66mi |
| 908 Forsythe St Unit Upstairs Toledo, OH | 2.0 | 1.0 | 1164 | $900 | $0.77 | 13d | 1 | 0.67mi |
| 948 White St Toledo, OH | 3.0 | 1.0 | 1024 | $1,135 | $1.11 | 13d | 1 | 0.69mi |
| 946 Butler St Toledo, OH | 2.0 | 1.0 | 944 | $650 | $0.69 | 43d | 1 | 0.74mi |
| 912 Willow Ave Toledo, OH | 1.0 | 1.0 | 900 | $850 | $0.94 | 43d | 1 | 0.76mi |
| 1505 Navarre Ave Toledo, OH | 3.0 | 1.0 | 1331 | $1,145 | $0.86 | 43d | 1 | 0.81mi |
| 724 Plymouth St Toledo, OH | 2.0 | 1.0 | 819 | $750 | $0.92 | 43d | 1 | 0.86mi |
| 724 Plymouth St Toledo, OH | 1.0 | 1.0 | 850 | $750 | $0.88 | 13d | 1 | 0.86mi |
| 950 Oak St Unit 1 Toledo, OH | 2.0 | 1.0 | 725 | $700 | $0.97 | 43d | 1 | 0.87mi |
| 834 Oak St Toledo, OH | 3.0 | 1.0 | 1064 | $900 | $0.85 | 43d | 1 | 0.99mi |
| 1614 Nevada St Toledo, OH | 2.0 | 1.0 | 1172 | $1,000 | $0.85 | 21d | 1 | 1.04mi |
| 1123 Nevada St Toledo, OH | 2.0 | 1.0 | 792 | $900 | $1.14 | 13d | 1 | 1.05mi |
| 557 Valleywood Dr Toledo, OH | 3.0 | 1.0 | 848 | $1,100 | $1.30 | 43d | 1 | 1.09mi |
| 2337 Burnside Ave Oregon, OH | 2.0 | 1.0 | 1025 | $1,150 | $1.12 | 13d | 1 | 1.10mi |
| 571 Howland Ave Toledo, OH | 2.0 | 1.0 | 874 | $875 | $1.00 | 43d | 1 | 1.12mi |
| 2401 Burnside Ave Oregon, OH | 2.0 | 1.0 | 1025 | $1,150 | $1.12 | 13d | 1 | 1.14mi |
| 732 Coyne Ave Toledo, OH | 3.0 | 1.0 | 968 | $1,145 | $1.18 | 13d | 1 | 1.14mi |
| 722 Coyne Ave Toledo, OH | 2.0 | 1.0 | 900 | $1,000 | $1.11 | 13d | 1 | 1.16mi |
| 508 Howland Ave Toledo, OH | 3.0 | 1.0 | 840 | $1,000 | $1.19 | 43d | 1 | 1.19mi |
| 1311 Mason St Unit 2 Toledo, OH | 1.0 | 1.0 | 950 | $703 | $0.74 | 13d | 1 | 1.24mi |
| 537 Potter St Toledo, OH | 2.0 | 1.0 | 1200 | $625 | $0.52 | 23d | 1 | 1.24mi |
| 537 Potter St Toledo, OH | 1.0 | 1.0 | 1000 | $600 | $0.60 | 43d | 1 | 1.24mi |
| 2129 Nevada St Toledo, OH | 3.0 | 1.0 | 1352 | $1,200 | $0.89 | 13d | 1 | 1.26mi |
| 653 Oswald St Toledo, OH | 2.0 | 1.0 | 920 | $800 | $0.87 | 43d | 1 | 1.38mi |
| 2480 Tracy Rd Northwood, OH | 1.0–2.0 | 1.0 | 717 | $1,015 | $1.41 | 13d | 1 | 1.38mi |
| 315 Parker Ave Unit 3 Toledo, OH | 1.0 | 1.0 | 1029 | $799 | $0.78 | 23d | 1 | 1.41mi |
| 2074 Starr Ave Toledo, OH | 3.0 | 1.0 | 1115 | $1,025 | $0.92 | 23d | 1 | 1.42mi |
| 451 5th St Apt 1 Toledo, OH | 1.0 | 1.0 | 850 | $650 | $0.76 | 43d | 1 | 1.44mi |
| 1103 S Wheeling St Oregon, OH | 2.0 | 1.0 | 825 | $1,049 | $1.27 | 43d | 1 | 1.46mi |
| 20 Greenwood Ave Toledo, OH | 3.0 | 1.0 | 1496 | $1,150 | $0.77 | 13d | 1 | 1.48mi |
Listing history 26 events
-
2026-06-16statusdays on market $20,000 Pending 172 DOM
-
2026-06-15days on market $20,000 Active 171 DOM
-
2026-06-14remarks 373-char remark
-
2026-06-14days on market $20,000 Active 169 DOM
-
2026-06-10days on market $20,000 Active 166 DOM
-
2026-06-09days on market $20,000 Active 165 DOM
-
2026-06-09remarks 332-char remark
-
2026-06-09status $20,000 Active 164 DOM
-
2026-06-08days on market $20,000 Contingent 164 DOM
-
2026-06-07days on market $20,000 Contingent 163 DOM
-
2026-06-05days on market $20,000 Contingent 160 DOM
-
2026-06-03days on market $20,000 Contingent 159 DOM
-
2026-06-02days on market $20,000 Contingent 158 DOM
-
2026-06-01days on market $20,000 Contingent 157 DOM
-
2026-05-31days on market $20,000 Contingent 156 DOM
-
2026-05-30days on market $20,000 Contingent 155 DOM
-
2026-01-29historical Contingent
-
2026-01-22status Active
-
2026-01-22price $20,000
-
2026-01-02historical Contingent
-
2025-12-18historical
-
2025-12-17$25,000 Active
-
2025-10-09$34,000 Active
-
2006-06-05soldstatus $36,000
-
2003-02-28soldstatus $24,000
-
1988-08-18soldstatus $10,000
ⓘ Source: listings_history table (triggers on properties + properties_extension) + one-shot
backfill from property_details.listing_events for pre-trigger history.
Climate risk First Street
- Flood 1/10 Low FEMA zone X (unshaded) · 0% chance over 30 yrs
- Wildfire 1/10 Low
- Heat 3/10 Moderate 7 d/yr ≥100°F today · 16 d/yr by 30 yrs out
- Wind 2/10 Low
- Air quality 2/10 Low 1 unhealthy d/yr today · 2 by 30 yrs out
Nearby sold comps map
Loading sold comps map…
Walkable amenities ~0.75 mi
Loading nearby amenities…
Taxation est. · year 1
- Rental income
- $11,583
- − Mortgage interest
- −$1,120
- − Property taxes
- −$300
- − Insurance
- −$100
- − Repairs & maintenance
- −$927
- − Management
- −$927
- − Depreciation
- −$582
- Taxable income
- $7,627
- Est. tax owed @ 24.0%
- −$1,831
- After-tax cash flow
- $5,661/yr
For passive investors: Depreciation is non-cash, so a rental often shows a tax loss while cash-flowing — sheltering income. Rental losses are passive: they offset passive income freely, and up to $25,000/yr can offset ordinary (W-2) income if you actively participate and your MAGI is under $100k (phasing out to $0 by $150k); unused losses carry forward. On sale, claimed depreciation is recaptured at up to 25%, and gains may owe capital-gains tax (a 1031 exchange can defer both). Figures are a year-1 estimate at your 24.0% rate — not tax advice; consult a CPA.
Schools (NCES district)
- District
- Toledo City
- NCES district ID
- 3904490
- Math proficiency
- 15% ▼ -16.00%
- Reading proficiency
- 24% ▼ -13.00%
- Median HH income
- $32,137
- Composite
- 15.76/100
- National rank
- #9276
- State rank
- #634 of 656 in OH
Livability — Toledo
- Score
- 66/100
- State rank
- #645
- US rank
- #11442
Category grades
Schools grade is shown separately in the Schools card above.
Census & demographics
- Census place
- Toledo, OH
- County
- Lucas County · 380,724 people
- City population
- 280,811
- Metro
- Toledo, OH
- Population (ZIP)
- 24,441
- Household income
- $39,118
- Rent vs Own
- Severe rent burden
- 1257.0
Population outlook (Lucas County) Hauer SSP2
- Today (2025)
- 420,751 people
- By 2030
- 410,187 · -2.5%
- By 2040
- 384,019 · -8.7%
- By 2050
- 355,125 · -15.6%
- By 2075
- 291,683 · -30.7%
- By 2100
- 233,670 · -44.5%
Race, ethnicity, and origin ACS 2023
- Neighborhood character
- Diverse neighborhood (Simpson 0.61)
- Race & ethnicity
- White 57% Hispanic / Latino 21% Black 14% Two or more races 14%
- Hispanic origin (detail)
- Mexican 17% Puerto Rican 2%
- Common ancestry
- Romanian 3% Lithuanian 2% Portuguese 1%
- Foreign-born
- 3% · Canada
- Languages at home
- 91% English-only · Spanish 7% Arabic 1%
Political lean MEDSL · Lucas
- 2024 margin
- D (+12.6) · D 55.8% · R 43.2%
- 2008→2024 swing
- -18.9pp toward R · 2008: 31.4pp · 2024: 12.6pp
- All cycles
- 2024: D+12.6 2020: D+16.8 2016: D+17.4 2012: D+30.4 2008: D+31.4
Not yet ingested
- Civics
- —
Market trends
- HPI YoY
- ▼ -47.85%
- Current HPI
- 138.6894
- Rent YoY
- ▲ 5.37%
- Metro
- Toledo, OH
- State GDP YoY
- ▲ 1.98%
- F500 in state
- 48
Industry mix (Fortune 500 HQ in OH)
| Industry | F500 HQs | Revenue |
|---|---|---|
| Insurance | 3 | $145B |
|
||
| Industrial Machinery | 3 | $49B |
|
||
| Financial Services | 3 | $24B |
|
||
| Consumer Goods | 2 | $93B |
|
||
| Aerospace / Defense | 2 | $47B |
|
||
| Utilities | 2 | $33B |
|
||
Price history
+100.0% since first listed10 events — show timeline
- 2026-01-29 Contingent — NORIS
- 2026-01-22 Relisted — NORIS
- 2026-01-22 Price Changed $20,000 NORIS
- 2026-01-02 Contingent — NORIS
- 2025-12-18 Listing Removed — NORIS
- 2025-12-17 Listed $25,000 NORIS
- 2025-10-09 Listed $34,000 NORIS
- 2006-06-05 Sold (Public Records) $36,000 Public Records
- 2003-02-28 Sold (Public Records) $24,000 Public Records
- 1988-08-18 Sold (Public Records) $10,000 Public Records
Property tax history
+2.6%/yrLatest (2025): $1,058 · +1.3% YoY. Source: county tax records.
Cash-flow waterfall
monthlySold comps — $/sqft
last 12 mo · ≤1 miLoading sold comps…