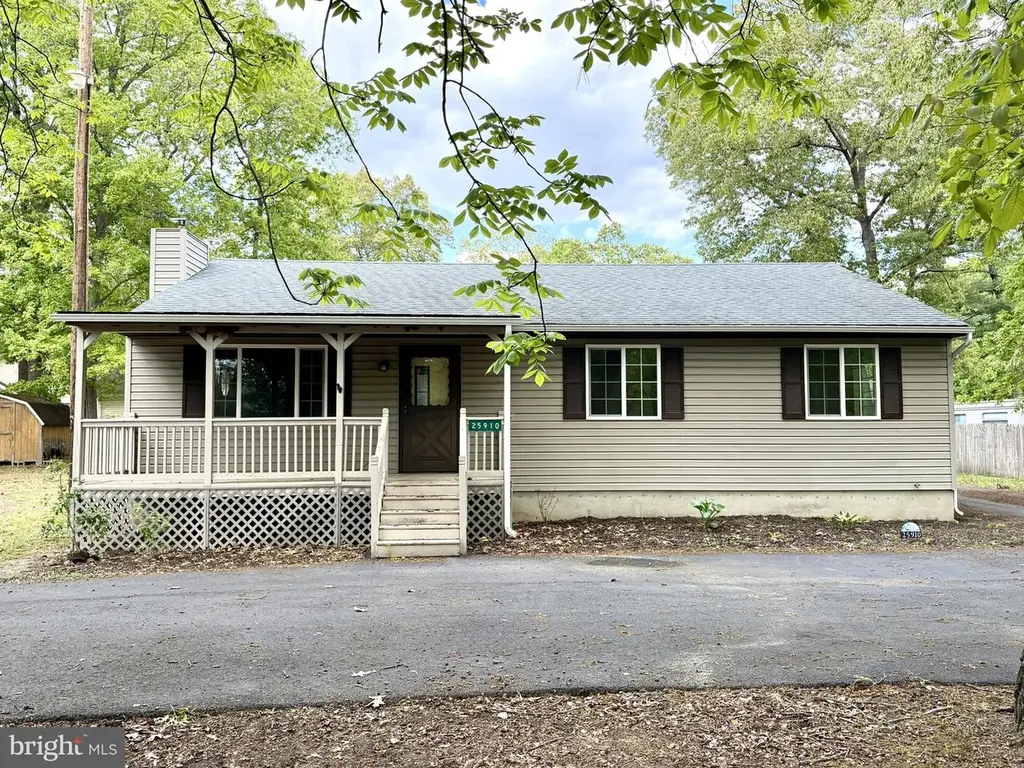
25910 Fox Grape Rd · Greensboro, MD
Flood risk 1/10 · Minimal
- FEMA flood zone
- X (unshaded)
- Chance of flooding over 30 yrs
- 0.0%
- Est. flood insurance / yr
- $507 – $1,088
Fire risk 3/10 · Minor
- Est. fire insurance / yr
- $755 – $1,403
Heat risk 8/10 · Major
- Hot days now (above 104°F)
- 7 days/yr
- Hot days in 30 yrs
- 15 days/yr
Wind risk 6/10 · Moderate
- Chance of severe wind over 30 yrs
- 41.0%
Air-quality risk 2/10 · Minimal
- Unhealthy air days now
- 2 days/yr
- Unhealthy air days in 30 yrs
- 2 days/yr
Risk factors via First Street. Map © Google.
Why this score? — see what drove the C grade
The composite is a weighted blend of 9 inputs, each scored 0–100. Each bar is that input's sub-score; the figure is the points it added to the 100-point composite (weight × sub-score).
- Cash flow +16.4/30.0
- ARV discount +14.6/15.0
- Appreciation +7.7/10.0
- DSCR +5.1/10.0
- 1% rule +3.8/10.0
- Livability +3.4/5.0
- Rent growth +2.5/5.0
- Condition / age +2.5/5.0
- Schools +1.9/10.0
$250,000
🖨 Deal sheet (PDF) 📄 Offer letter ✓ Due diligence
Listing remarks
Quiet living in Fox Grape Farms. Whether you are downsizing or just starting out, this home offers one-level living with 3 bedrooms, 2 full baths and an open living room that flows into the dining area. Situated on a 0.60 +/- parcel, the property also features two (2) storage sheds. Located approximately 7 miles from Denton, MD, 11 miles from Tuckahoe State Park and 16 miles from the Harrington Raceway & Casino in Harrington, DE. Restricted to owner-occupants, non-profits and government agencies through 05/09/2026. HUD Case #241-928326. Equal Housing Opportunity.
Key facts
- Open living room
- One-level living
- Dining area
Tags
Property features AI
Exterior
- Parking: Driveway
- Utilities: Private water source; Septic system
- Home design: Detached property
- Construction: Frame construction; Crawl space foundation; Above-grade and below-grade structures; Assessor-reported year built
- Exterior features: Detached structure; No tidal water
Interior
- Bedrooms: 3 bedrooms on the main level
- Bathrooms: 2 full bathrooms on the main level; 2 full bathrooms total
- Heating & cooling: Heat pump(s); Wall unit heating; Electric and leased propane heating fuel; Electric hot water; Other cooling (electric)
- Interior features: Estimated living area; One fireplace
Neighborhood map
What this means for you Summary
Snapshot
- This is a 3-bed/2.0-bath single-family listed at $250k.
Deal economics
- At list price, monthly cash flow is $143 ($2k/yr) — positive.
- The deal already cash-flows at list — no discount required.
- To meet the 1% rule (rent ≥ 1% of price), the offer needs to be $220k (12.0% below list).
- Recommended offer: $220k (12.0% below list) — sets the bar for 1% rule.
- Cap rate 7.0% vs local median 4.6% in Greensboro — top-decile yield for the area; either an underpriced asset or a hidden risk that comps aren't pricing in. Stress-test before assuming the spread holds.
Location & tenants
- Location reads 68/100 on livability (#202 in MD) — a middle-class / working-renter tenant base. Strengths: cost of living A+, health & safety A+, crime A-; Watch: amenities F, commute F, employment F.
- Caroline County Public Schools (rural): math 13% / reading 29% proficiency, ranked #17 of 24 in MD (top 71%) — low school quality limits family demand, transient renter base, plan for 1-2y turnover.
- Zoned schools: Greensboro Elementary School (math 9% / reading 14%, grade F, #567 of 860 statewide, top 67%, 785 students, 81% FRL); Lockerman Middle School (math 6% / reading 30%, grade F, #165 of 225 statewide, top 75%, 866 students, 66% FRL); North Caroline High School (math 39% / reading 61%, grade D+, #106 of 222 statewide, top 48%, 1,226 students, 59% FRL) — zoned schools average 69% FRL vs 48% district-wide (20 pts higher); higher-poverty schools than district average — tighter screening recommended.
- Market conditions: 42 active listings in the ZIP; 1 comparable units currently listed for rent nearby; 59 units permitted in Caroline County in 2024 (0 in 5+ unit buildings).
Forward outlook
- In year one you build about $15k of equity ($2k loan paydown + $14k appreciation (5.4% local appreciation)).
- Caroline County population projected at -19% by 2050 — secular population decline; favor cash flow + early exit over multi-decade hold.
- At projected returns (5.4% appreciation + 3.0% rent growth), your $70k cash investment doubles in ~4 years — after that, you're playing with house money.
- By year 3, paydown + projected appreciation supports a ~$38k cash-out refi (75% LTV) — recoverable capital for the next deal without selling this one.
Negotiation context
- It's been on market 46 days — a 3% lower offer ($242k) is reasonable based on typical stale-listing flexibility.
- Current owner paid $74k; list at $250k implies a 238% gain — meaningful room to come down on a strong offer.
Risks & watch-outs
- Climate carrying-cost: major wind risk, 41% chance of damaging wind over 30y; extreme-heat days projected 7→15/yr by 2055 (HVAC capex compounding) — expect insurance premiums to compound above CPI over the hold.
Questions for the listing agent
- It's been on market 46 days. Have you received any prior offers? Is the seller open to a 12% concession, seller financing, or rate buy-down credit?
- Is there a deadline driving the sale (1031 exchange, divorce, estate, relocation)? That informs how much negotiation room exists.
- Schools are D-rated, which usually means shorter tenancies and higher turnover. Who's the typical renter profile here, and what's been the actual vacancy rate?
- What's the average days-on-market for RENTAL listings here right now (not sales)? A rising rental-DOM trend means longer vacancies and softer asking-rent achievability than the comps imply.
- What's the recent tenant-quality profile in this submarket — average credit score on applications, eviction rate, late-payment / NSF rate, and stable-employment percentage? A property-management company in the area should have these aggregated.
- How much new for-sale + rental construction is in the pipeline within 1–3 miles? Heavy new supply typically softens prices + rents 12–24 months out; constrained supply supports both.
Investment metrics
- 1% rule
- 0.88% ✗
- Cap rate
- 6.98%
- Cash-on-cash
- 2.44%
- DSCR
- 1.11
- GRM
- 9.5
CMA / ARV
- ARV (median comp)
- $296,495
- List price
- $250,000
- Delta
- -15.68%
- Verdict
- UNDERPRICED
- Comps
- 20 within 1.0 mi
Show comp detail 9 sales within ~0.75 mi
| Address | Dist | Beds/Ba | Sqft | Sold | Price | $/sf | Match |
|---|---|---|---|---|---|---|---|
| 13061 Logan Ln | 0.18mi | 3/2.0 | 1,260 (-4%) | 13mo | $335,000 | $266 | 74 |
| 26056 Fox Grape Rd | 0.28mi | 3/1.5 | 1,215 (-8%) | 5mo | $290,000 | $239 | 68 |
| 13070 Ridgely Rd | 0.54mi | 3/2.0 | 1,344 (+2%) | 6mo | $360,000 | $268 | 67 |
| 142 Smugglers Way | 0.51mi | 3/2.0 | 1,360 (+3%) | 18mo | $316,000 | $232 | 56 |
| 123 Parkland Rd | 0.59mi | 3/2.0 | 1,182 (-10%) | 5mo | $269,950 | $228 | 51 |
| 107 Parkland Rd | 0.60mi | 3/2.0 | 1,219 (-8%) | 11mo | $281,990 | $231 | 50 |
| 125 Parkland Rd | 0.58mi | 4/2.0 (+1) | 1,460 (+11%) | 5mo | $292,990 | $201 | 46 |
| 111 Parkland Rd | 0.60mi | 4/2.0 (+1) | 1,460 (+11%) | 9mo | $289,990 | $199 | 42 |
| 12710 Greensboro Rd | 0.54mi | 3/2.5 | 1,472 (+12%) | 20mo | $389,900 | $265 | 37 |
Match score weights: distance 35% · size 25% · config 20% · recency 20%. Top-matched comps best support the ARV.
Projected returns pro-forma
5.43% appreciation · 3.0% rent growth · sell at horizon
- IRR
- 16.0%
- Equity multiple
- 2.04×
- Total profit
- $72,772
- Equity at exit
- $148,177
- IRR
- 16.2%
- Equity multiple
- 3.99×
- Total profit
- $209,378
- Equity at exit
- $261,281
Cash invested: $70,000 (down + closing). Projections, not guarantees.
Landlord ↔ Tenant lean methodology
- Overall (STATE)
- 27 Tenant-Leaning
- State Maryland
- 27 Tenant-Leaning · D+14
- County
- — inherits STATE
- City
- — inherits STATE
ZIP-level market 21639
- Home prices YoY
- 1.7%
- Active inventory
- 42
- Price-to-rent
- 9.5×
Monthly cashflow live
- Estimated rent
- $2,200 medium interval (Pro) →
- Mortgage (P&I)
- −$1,311
- Tax from tax record
- −$180 /mo · $2,162/yr
- Insurance
- −$104
- HOA
- −$0
- Lot rent
- −$0
- Vacancy / Maint / Mgmt
- −$462
- Net cashflow
- $143
Break-even live
Sensitivity live
| Price | -10% $284 | -5% $213 | +0% $143 | +5% $72 | +10% $1 |
|---|---|---|---|---|---|
| Rent | -10% $-31 | -5% $56 | +0% $143 | +5% $230 | +10% $316 |
| Rate | -1.0pp $269 | -0.5pp $206 | base $143 | +0.5pp $78 | +1.0pp $12 |
UW: 25.0% down · 7.5% · 30yr · 1.5% tax · 5.0% vac · 8.0% maint · 8.0% mgmt
Financing live
Cash to close
- Down payment
- $62,500
- Closing costs
- $7,500
- Reserves months
- —
- Total cash needed
- —
Loan-product check · same deal, 3 products live
Conventional
25% down · 7.5% · 30yr
- Down + closing
- —
- Monthly P&I
- —
- Monthly cashflow
- —
- DSCR
- —
- Eligible?
- —
Personal DTI + credit; lowest rate.
DSCR
20% down · 8.5% · 30yr
- Down + closing
- —
- Monthly P&I
- —
- Monthly cashflow
- —
- DSCR
- —
- Eligible?
- —
No personal income docs; deal must DSCR.
Hard money
10% down · 12.0% · 12mo
- Down + closing
- —
- Monthly P&I
- —
- Monthly cashflow
- —
- DSCR
- —
- Eligible?
- —
Short-term bridge; refi at stabilization.
Rent comps 1 comps
| Address | Beds | Baths | Sqft | Rent | $/sqft | DOM | Units | Dist |
|---|---|---|---|---|---|---|---|---|
| 102 Sycamore Ln Greensboro, MD | 3.0 | 2.0 | 1182 | $2,200 | $1.86 | 46d | 1 | 1.19mi |
Listing history 20 events
-
2026-06-22days on market $250,000 Active 46 DOM
-
2026-06-21days on market $250,000 Active 45 DOM
-
2026-06-21days on market $250,000 Active 44 DOM
-
2026-06-18days on market $250,000 Active 42 DOM
-
2026-06-17days on market $250,000 Active 41 DOM
-
2026-06-16days on market $250,000 Active 40 DOM
-
2026-06-15days on market $250,000 Active 39 DOM
-
2026-06-13days on market $250,000 Active 37 DOM
-
2026-06-12days on market $250,000 Active 36 DOM
-
2026-06-09days on market $250,000 Active 33 DOM
-
2026-06-08days on market $250,000 Active 32 DOM
-
2026-06-07days on market $250,000 Active 31 DOM
-
2026-06-07days on market $250,000 Active 30 DOM
-
2026-06-04days on market $250,000 Active 27 DOM
-
2026-06-02days on market $250,000 Active 26 DOM
-
2026-06-01days on market $250,000 Active 25 DOM
-
2026-05-31days on market $250,000 Active 24 DOM
-
2026-05-31days on market $250,000 Active 23 DOM
-
2026-05-07$250,000 Active 575-char remark
-
1988-08-02soldstatus $74,000
ⓘ Source: listings_history table (triggers on properties + properties_extension) + one-shot
backfill from property_details.listing_events for pre-trigger history.
Tax reassessment forecast MD · Partial reset (capped growth)
- Current annual tax
- $2,162 · $180/mo
- Projected year-2 tax
- $2,444 · $204/mo
- Expected delta
- +$281/yr (+$23/mo · 13.0%)
ⓘ Screening estimate from a state-policy table — verify with the county assessor before closing.
Climate risk First Street
- Flood 1/10 Low FEMA zone X (unshaded) · 0% chance over 30 yrs
- Wildfire 3/10 Moderate
- Heat 8/10 Severe 7 d/yr ≥104°F today · 15 d/yr by 30 yrs out
- Wind 6/10 Major 41% chance of damaging wind over 30 yrs
- Air quality 2/10 Low 2 unhealthy d/yr today · 2 by 30 yrs out
Nearby sold comps map
Loading sold comps map…
Walkable amenities ~0.75 mi
Loading nearby amenities…
Taxation est. · year 1
- Rental income
- $26,400
- − Mortgage interest
- −$14,004
- − Property taxes
- −$2,162
- − Insurance
- −$1,250
- − Repairs & maintenance
- −$2,112
- − Management
- −$2,112
- − Depreciation
- −$7,273
- Taxable loss
- −$2,513
- Est. tax savings @ 24.0%
- +$603
- After-tax cash flow
- $2,314/yr
For passive investors: Depreciation is non-cash, so a rental often shows a tax loss while cash-flowing — sheltering income. Rental losses are passive: they offset passive income freely, and up to $25,000/yr can offset ordinary (W-2) income if you actively participate and your MAGI is under $100k (phasing out to $0 by $150k); unused losses carry forward. On sale, claimed depreciation is recaptured at up to 25%, and gains may owe capital-gains tax (a 1031 exchange can defer both). Figures are a year-1 estimate at your 24.0% rate — not tax advice; consult a CPA.
Schools (NCES district)
- District
- Caroline County Public Schools
- NCES district ID
- 2400180
- Math proficiency
- 13% ▼ -22.00%
- Reading proficiency
- 29% ▼ -14.00%
- Median HH income
- $55,076
- Composite
- 19.16/100
- National rank
- #8823
- State rank
- #17 of 24 in MD
Livability — Greensboro
- Score
- 68/100
- State rank
- #202
- US rank
- #9657
Category grades
Schools grade is shown separately in the Schools card above.
Census & demographics
- Population (ZIP)
- 4,621
Population outlook (Caroline County) Hauer SSP2
- Today (2025)
- 31,205 people
- By 2030
- 30,204 · -3.2%
- By 2040
- 27,866 · -10.7%
- By 2050
- 25,342 · -18.8%
- By 2075
- 20,554 · -34.1%
- By 2100
- 17,415 · -44.2%
Race, ethnicity, and origin ACS 2023
- Neighborhood character
- Predominantly White (71%)
- Race & ethnicity
- White 71% Hispanic / Latino 19% Two or more races 11% Black 9% Native American 4%
- Hispanic origin (detail)
- Mexican 4% Puerto Rican 2%
- Common ancestry
- Lithuanian 5% Slovak 3% Iranian 2%
- Foreign-born
- 11% · Canada
- Languages at home
- 84% English-only · Spanish 15% Other Indo-European 1%
Political lean MEDSL · Caroline
- 2024 margin
- Solid R (+38.0) · D 29.9% · R 67.9% · Other 2.2%
- 2008→2024 swing
- -15.0pp toward R · 2008: -23.0pp · 2024: -38.0pp
- All cycles
- 2024: R+38.0 2020: R+32.9 2016: R+39.5 2012: R+24.4 2008: R+23.0
Not yet ingested
- Civics
- —
Market trends
- HPI YoY
- ▲ 5.43%
- Current HPI
- 321.0192
- Rent YoY
- —
- Metro
- —
- State GDP YoY
- ▲ 2.97%
- F500 in state
- 12
Industry mix (Fortune 500 HQ in MD)
| Industry | F500 HQs | Revenue |
|---|---|---|
| Aerospace / Defense | 1 | $71B |
|
||
| Utilities | 1 | $25B |
|
||
| Hotels | 1 | $24B |
|
||
| Consumer Goods | 1 | $7B |
|
||
| Real Estate | 1 | $6B |
|
||
| Chemicals | 1 | $2B |
|
||
Price history
+237.8% since first listed2 events — show timeline
- 2026-05-07 Listed $250,000 BRIGHT MLS
- 1988-08-02 Sold (Public Records) $74,000 Public Records
Property tax history
+2.7%/yrLatest (2025): $2,162 · +18.1% YoY. Source: county tax records.
Cash-flow waterfall
monthlySold comps — $/sqft
last 12 mo · ≤1 miLoading sold comps…