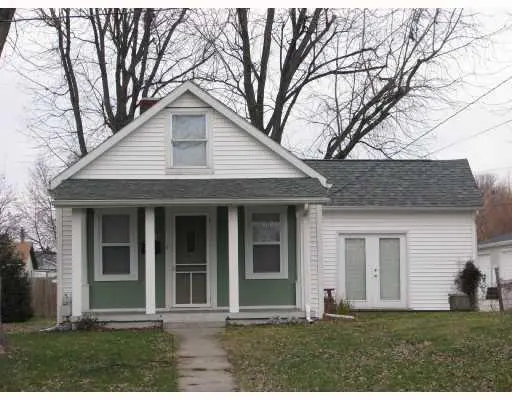
328 W Light St · Urbana, OH
Flood risk 6/10 · Moderate
- FEMA flood zone
- X (unshaded)
- Chance of flooding over 30 yrs
- 0.71%
- Est. flood insurance / yr
- $473 – $860
Fire risk 1/10 · Minimal
- Est. fire insurance / yr
- $713 – $1,323
Heat risk 3/10 · Minor
- Hot days now (above 99°F)
- 7 days/yr
- Hot days in 30 yrs
- 18 days/yr
Wind risk 2/10 · Minimal
- Chance of severe wind over 30 yrs
- —
Air-quality risk 3/10 · Minor
- Unhealthy air days now
- 3 days/yr
- Unhealthy air days in 30 yrs
- 4 days/yr
Risk factors via First Street. Map © Google.
Why this score? — see what drove the D grade
The composite is a weighted blend of 9 inputs, each scored 0–100. Each bar is that input's sub-score; the figure is the points it added to the 100-point composite (weight × sub-score).
- ARV discount +11.9/15.0
- Appreciation +10.0/10.0
- Cash flow +6.5/30.0
- Schools +3.7/10.0
- Livability +3.6/5.0
- Rent growth +2.5/5.0
- Condition / age +2.5/5.0
- DSCR +0.8/10.0
- 1% rule +0.7/10.0
$156,000
🖨 Deal sheet (PDF) 📄 Offer letter ✓ Due diligence
Listing remarks
Cape Cod-style home located near the heart of Urbana, offering 2-3 bedrooms, and 1.5 baths. This home features a functional layout with main-level half bath and a fully fenced backyard, providing space for pets, outdoor use, or future improvements. A covered front porch adds to the home's charm, while the side patio offers a spot to relax or entertain. New roof in 2025. Floors have been repaired to resolve sagging.
Key facts
- 0.24 acre lot
- Built 1900
- Listed 65 days
Neighborhood map
What this means for you Summary
Snapshot
- This is a 3-bed/1.5-bath single-family listed at $156k.
Deal economics
- At list price, monthly cash flow is $-263 ($-3k/yr) — negative.
- To cash-flow at today's rent, offer at most $109k (29.8% below list).
- To meet the 1% rule (rent ≥ 1% of price), the offer needs to be $89k (43.1% below list).
- Recommended offer: $89k (43.1% below list) — sets the bar for 1% rule.
- Cap rate 4.3% vs local median 3.3% in Urbana — top-decile yield for the area; either an underpriced asset or a hidden risk that comps aren't pricing in. Stress-test before assuming the spread holds.
Location & tenants
- Location reads 71/100 on livability (#404 in OH) — a middle-class / working-renter tenant base. Strengths: cost of living A+, housing A+, crime A-; Watch: amenities F, commute F, employment D-.
- Urbana City (town): math 43% / reading 45% proficiency, ranked #509 of 656 in OH (top 78%) — families likely to look elsewhere, expect single-tenant / working-renter base with shorter leases.
- Zoned schools: Urbana Elementary School (math 46% / reading 48%, grade D-, #942 of 1,584 statewide, top 61%, 871 students, 56% FRL); Urbana Junior High School (math 41% / reading 38%, grade F, #519 of 654 statewide, top 80%, 433 students, 50% FRL); Urbana High School (math 42% / reading 57%, grade D, #390 of 781 statewide, top 54%, 550 students, 47% FRL) — zoned schools at 51% FRL track the district average.
- Market conditions: 91 active listings in the ZIP; 4 comparable units currently listed for rent nearby; rentals at typical pace (median 22d on market — plan ~3-4 weeks tenant-placement turnaround); 42 units permitted in Champaign County in 2024 (0 in 5+ unit buildings).
Forward outlook
- In year one you build about $17k of equity ($1k loan paydown + $16k appreciation (10.0% local appreciation)).
- Champaign County population projected at -25% by 2050 — secular population decline; favor cash flow + early exit over multi-decade hold.
- By year 3, paydown + projected appreciation supports a ~$42k cash-out refi (75% LTV) — recoverable capital for the next deal without selling this one.
Negotiation context
- It's been on market 65 days — a 6% lower offer ($147k) is reasonable based on typical stale-listing flexibility.
- 10 sale attempts since 19y ago; this cycle's ask has dropped $9k (5%) from the opening price — seller is motivated, your offer sets the floor, not the list.
- Current owner paid $72k; list at $156k implies a 117% gain — meaningful room to come down on a strong offer.
Risks & watch-outs
- Watch-outs: built in 1900 — expect roof / HVAC / electrical / plumbing capex.
- Climate carrying-cost: major flood risk — expect insurance premiums to compound above CPI over the hold.
Questions for the listing agent
- What do current leases actually rent for vs. the listed asking? Can we see a recent rent roll and the last 12 months of T-12 income?
- It's been on market 65 days. Have you received any prior offers? Is the seller open to a 43% concession, seller financing, or rate buy-down credit?
- Built in 1900 — when were the roof, HVAC, electrical panel, plumbing, and water heater last replaced?
- Why hasn't it sold? Are there any deal-killer items the seller is aware of (foundation, flood, title, zoning, code violations)?
- Is there a deadline driving the sale (1031 exchange, divorce, estate, relocation)? That informs how much negotiation room exists.
- The area grade is low — what's the realistic commute time and amenity access for the typical tenant pool here? Any planned neighborhood developments (good or bad) we should know about?
- What's the average days-on-market for RENTAL listings here right now (not sales)? A rising rental-DOM trend means longer vacancies and softer asking-rent achievability than the comps imply.
- What's the recent tenant-quality profile in this submarket — average credit score on applications, eviction rate, late-payment / NSF rate, and stable-employment percentage? A property-management company in the area should have these aggregated.
- How much new for-sale + rental construction is in the pipeline within 1–3 miles? Heavy new supply typically softens prices + rents 12–24 months out; constrained supply supports both.
Investment metrics
- 1% rule
- 0.57% ✗
- Cap rate
- 4.27%
- Cash-on-cash
- -7.23%
- DSCR
- 0.68
- GRM
- 14.6
CMA / ARV
- ARV (median comp)
- $172,962
- List price
- $156,000
- Delta
- -9.81%
- Verdict
- FAIR
- Comps
- 20 within 1.0 mi
Show comp detail 12 sales within ~0.75 mi
| Address | Dist | Beds/Ba | Sqft | Sold | Price | $/sf | Match |
|---|---|---|---|---|---|---|---|
| 535 W Light St | 0.20mi | 3/1.0 | 960 (+1%) | 16mo | $100,000 | $104 | 73 |
| 350 Mosgrove St | 0.33mi | 3/1.0 | 936 (-1%) | 9mo | $210,000 | $224 | 73 |
| 545 W Light St | 0.22mi | 3/1.0 | 864 (-9%) | 1mo | $134,900 | $156 | 72 |
| 241 Louden St | 0.27mi | 2/1.0 (-1) | 964 (+2%) | 7mo | $60,000 | $62 | 72 |
| 557 Hagenbuch St | 0.25mi | 3/1.0 | 864 (-9%) | 5mo | $189,000 | $219 | 68 |
| 214 Harmon Ave | 0.28mi | 3/1.0 | 1,008 (+6%) | 14mo | $97,500 | $97 | 63 |
| 109 Talbot Ave | 0.33mi | 2/1.5 (-1) | 934 (-2%) | 19mo | $170,000 | $182 | 61 |
| 709 N Russell St | 0.14mi | 2/1.0 (-1) | 1,084 (+14%) | 2mo | $185,000 | $171 | 60 |
| 603 E Light St | 0.71mi | 3/1.0 | 880 (-7%) | 6mo | $199,000 | $226 | 48 |
| 503 Gwynne St | 0.53mi | 2/1.0 (-1) | 900 (-5%) | 14mo | $195,000 | $217 | 48 |
| 701 Pindar St | 0.33mi | 2/1.0 (-1) | 1,089 (+15%) | 11mo | $175,000 | $161 | 44 |
| 133 Talbot Ave | 0.33mi | 3/1.0 | 817 (-14%) | 21mo | $143,500 | $176 | 42 |
Match score weights: distance 35% · size 25% · config 20% · recency 20%. Top-matched comps best support the ARV.
Projected returns pro-forma
10.0% appreciation · 3.0% rent growth · sell at horizon
- IRR
- 19.2%
- Equity multiple
- 2.56×
- Total profit
- $68,137
- Equity at exit
- $140,537
- IRR
- 17.7%
- Equity multiple
- 5.89×
- Total profit
- $213,726
- Equity at exit
- $303,074
Cash invested: $43,680 (down + closing). Projections, not guarantees.
Landlord ↔ Tenant lean methodology
- Overall (STATE)
- 73 Landlord-Friendly
- State Ohio
- 73 Landlord-Friendly · R+6
- County
- — inherits STATE
- City
- — inherits STATE
ZIP-level market 43078
- Home prices YoY
- 6.2%
- Active inventory
- 91
- Price-to-rent
- 14.6×
Monthly cashflow live
- Estimated rent
- $888 medium interval (Pro) →
- Mortgage (P&I)
- −$818
- Tax from tax record
- −$81 /mo · $978/yr
- Insurance
- −$65
- HOA
- −$0
- Vacancy / Maint / Mgmt
- −$186
- Net cashflow
- $-263
Break-even live
Sensitivity live
| Price | -10% $-175 | -5% $-219 | +0% $-263 | +5% $-307 | +10% $-352 |
|---|---|---|---|---|---|
| Rent | -10% $-333 | -5% $-298 | +0% $-263 | +5% $-228 | +10% $-193 |
| Rate | -1.0pp $-185 | -0.5pp $-224 | base $-263 | +0.5pp $-304 | +1.0pp $-345 |
UW: 25.0% down · 7.5% · 30yr · 1.5% tax · 5.0% vac · 8.0% maint · 8.0% mgmt
Financing live
Cash to close
- Down payment
- $39,000
- Closing costs
- $4,680
- Reserves months
- —
- Total cash needed
- —
Loan-product check · same deal, 3 products live
Conventional
25% down · 7.5% · 30yr
- Down + closing
- —
- Monthly P&I
- —
- Monthly cashflow
- —
- DSCR
- —
- Eligible?
- —
Personal DTI + credit; lowest rate.
DSCR
20% down · 8.5% · 30yr
- Down + closing
- —
- Monthly P&I
- —
- Monthly cashflow
- —
- DSCR
- —
- Eligible?
- —
No personal income docs; deal must DSCR.
Hard money
10% down · 12.0% · 12mo
- Down + closing
- —
- Monthly P&I
- —
- Monthly cashflow
- —
- DSCR
- —
- Eligible?
- —
Short-term bridge; refi at stabilization.
Rent comps 4 comps
| Address | Beds | Baths | Sqft | Rent | $/sqft | DOM | Units | Dist |
|---|---|---|---|---|---|---|---|---|
| 716 W Light St Urbana, OH | 2.0 | 1.0 | 899 | $875 | $0.97 | 25d | 1 | 0.44mi |
| 718 W Light St Urbana, OH | 2.0 | 1.0 | 899 | $875 | $0.97 | 21d | 1 | 0.45mi |
| 219 N Main St Unit H Urbana, OH | 2.0 | 1.0 | 575 | $1,250 | $2.17 | 0d | 1 | 0.59mi |
| 435 E Water St Urbana, OH | 2.0 | 1.5 | 930 | $945 | $1.02 | 0d | 1 | 1.04mi |
Listing history 47 events
-
2026-06-22days on market $156,000 Active 65 DOM
-
2026-06-18days on market $156,000 Active 62 DOM
-
2026-06-17days on market $156,000 Active 61 DOM
-
2026-06-16days on market $156,000 Active 60 DOM
-
2026-06-15days on market $156,000 Active 59 DOM
-
2026-06-13days on market $156,000 Active 57 DOM
-
2026-06-13pricedays on market $156,000 Active 56 DOM
-
2026-06-10days on market $158,000 Active 54 DOM
-
2026-06-09days on market $158,000 Active 53 DOM
-
2026-06-08remarks 418-char remark
-
2026-06-08days on market $158,000 Active 52 DOM
-
2026-06-07days on market $158,000 Active 51 DOM
-
2026-06-05days on market $158,000 Active 48 DOM
-
2026-06-03days on market $158,000 Active 47 DOM
-
2026-06-02remarks 397-char remark
-
2026-06-02pricestatusdays on market $158,000 Active 46 DOM
-
2026-05-15historical
-
2026-05-15historical
-
2026-04-26price $145,000
-
2026-04-26price $145,000
-
2026-04-10price $147,500
-
2026-04-10price $147,500
-
2026-04-06price $158,500
-
2026-04-06price $158,500
-
2026-03-31$164,900 Active
-
2026-03-30$164,900 Active
-
2015-12-31historical
-
2015-12-31historical
-
2015-08-04historical
-
2015-07-22$78,000
-
2015-07-22$78,000
-
2015-07-22$78,000
-
2013-07-03historical
-
2013-07-02historical
-
2013-01-02$69,900
-
2013-01-02$69,900
-
2012-12-14historical
-
2012-06-16$69,900
-
2008-02-28soldstatus $71,900
-
2008-02-22soldstatus $71,900
-
2007-12-02$64,900
-
2007-11-14soldstatus $65,500
-
2007-11-09soldstatus $65,500
-
2007-10-21$69,500
-
2004-12-13soldstatus $61,200
-
2003-12-10soldstatus $30,000
-
2001-05-10soldstatus $50,000
ⓘ Source: listings_history table (triggers on properties + properties_extension) + one-shot
backfill from property_details.listing_events for pre-trigger history.
Tax reassessment forecast OH · Partial reset (capped growth)
- Current annual tax
- $978 · $81/mo
- Projected year-2 tax
- $1,706 · $142/mo
- Expected delta
- +$728/yr (+$61/mo · 74.5%)
ⓘ Screening estimate from a state-policy table — verify with the county assessor before closing.
Climate risk First Street
- Flood 6/10 Major FEMA zone X (unshaded) · 71% chance over 30 yrs
- Wildfire 1/10 Low
- Heat 3/10 Moderate 7 d/yr ≥99°F today · 18 d/yr by 30 yrs out
- Wind 2/10 Low
- Air quality 3/10 Moderate 3 unhealthy d/yr today · 4 by 30 yrs out
Nearby sold comps map
Loading sold comps map…
Walkable amenities ~0.75 mi
Loading nearby amenities…
Taxation est. · year 1
- Rental income
- $10,652
- − Mortgage interest
- −$8,738
- − Property taxes
- −$978
- − Insurance
- −$780
- − Repairs & maintenance
- −$852
- − Management
- −$852
- − Depreciation
- −$4,538
- Taxable loss
- −$6,086
- Est. tax savings @ 24.0%
- +$1,461
- After-tax cash flow
- $-1,699/yr
For passive investors: Depreciation is non-cash, so a rental often shows a tax loss while cash-flowing — sheltering income. Rental losses are passive: they offset passive income freely, and up to $25,000/yr can offset ordinary (W-2) income if you actively participate and your MAGI is under $100k (phasing out to $0 by $150k); unused losses carry forward. On sale, claimed depreciation is recaptured at up to 25%, and gains may owe capital-gains tax (a 1031 exchange can defer both). Figures are a year-1 estimate at your 24.0% rate — not tax advice; consult a CPA.
Schools (NCES district)
- District
- Urbana City
- NCES district ID
- 3904494
- Math proficiency
- 43% ▼ -8.00%
- Reading proficiency
- 45% ▼ -11.00%
- Median HH income
- $40,461
- Composite
- 36.9/100
- National rank
- #4545
- State rank
- #509 of 656 in OH
Livability — Urbana
- Score
- 71/100
- State rank
- #404
- US rank
- #6676
Category grades
Schools grade is shown separately in the Schools card above.
Census & demographics
- Census place
- Urbana, OH
- County
- Champaign · 37,359 people
- Population (ZIP)
- 19,985
- Household income
- $72,500
- Rent vs Own
- Severe rent burden
- 8.2
Population outlook (Champaign County) Hauer SSP2
- Today (2025)
- 36,480 people
- By 2030
- 34,790 · -4.6%
- By 2040
- 31,082 · -14.8%
- By 2050
- 27,217 · -25.4%
- By 2075
- 19,156 · -47.5%
- By 2100
- 12,690 · -65.2%
Race, ethnicity, and origin ACS 2023
- Neighborhood character
- Predominantly White (89%)
- Race & ethnicity
- White 89% Two or more races 6% Black 3% Hispanic / Latino 1%
- Common ancestry
- Slovak 3% Italian 3% Romanian 1%
- Foreign-born
- 1% · Canada
- Languages at home
- 99% English-only · Spanish 1%
Political lean MEDSL · Champaign
- 2024 margin
- Solid R (+50.8) · D 24.1% · R 74.9%
- 2008→2024 swing
- -30.9pp toward R · 2008: -19.9pp · 2024: -50.8pp
- All cycles
- 2024: R+50.8 2020: R+47.7 2016: R+44.5 2012: R+20.1 2008: R+19.9
Not yet ingested
- Civics
- —
Market trends
- HPI YoY
- ▲ 24.22%
- Current HPI
- 415.85
- Rent YoY
- —
- Metro
- —
- State GDP YoY
- ▲ 1.98%
- F500 in state
- 48
Industry mix (Fortune 500 HQ in OH)
| Industry | F500 HQs | Revenue |
|---|---|---|
| Insurance | 3 | $145B |
|
||
| Industrial Machinery | 3 | $49B |
|
||
| Financial Services | 3 | $24B |
|
||
| Consumer Goods | 2 | $93B |
|
||
| Aerospace / Defense | 2 | $47B |
|
||
| Utilities | 2 | $33B |
|
||
Price history
+190.0% since first listed31 events — show timeline
- 2026-05-15 Listing Removed — CBRMLS
- 2026-05-15 Listing Removed — WRIST
- 2026-04-26 Price Changed $145,000 WRIST
- 2026-04-26 Price Changed $145,000 CBRMLS
- 2026-04-10 Price Changed $147,500 WRIST
- 2026-04-10 Price Changed $147,500 CBRMLS
- 2026-04-06 Price Changed $158,500 WRIST
- 2026-04-06 Price Changed $158,500 CBRMLS
- 2026-03-31 Listed $164,900 WRIST
- 2026-03-30 Listed $164,900 CBRMLS
- 2015-12-31 Listing Removed — WRIST
- 2015-12-31 Listing Removed — Dayton MLS
- 2015-08-04 Listing Removed — CBRMLS
- 2015-07-22 Listed $78,000 WRIST
- 2015-07-22 Listed $78,000 Dayton MLS
- 2015-07-22 Listed $78,000 CBRMLS
- 2013-07-03 Listing Removed — CBRMLS
- 2013-07-02 Listing Removed — WRIST
- 2013-01-02 Listed $69,900 WRIST
- 2013-01-02 Listed $69,900 CBRMLS
- 2012-12-14 Listing Removed — WRIST
- 2012-06-16 Listed $69,900 WRIST
- 2008-02-28 Sold (Public Records) $71,900 Public Records
- 2008-02-22 Sold (MLS) $71,900 WRIST
- 2007-12-02 Listed $64,900 WRIST
- 2007-11-14 Sold (Public Records) $65,500 Public Records
- 2007-11-09 Sold (MLS) $65,500 WRIST
- 2007-10-21 Listed $69,500 WRIST
- 2004-12-13 Sold (Public Records) $61,200 Public Records
- 2003-12-10 Sold (Public Records) $30,000 Public Records
- 2001-05-10 Sold (Public Records) $50,000 Public Records
Property tax history
+2.1%/yrLatest (2025): $978 · +0.0% YoY. Source: county tax records.
Cash-flow waterfall
monthlySold comps — $/sqft
last 12 mo · ≤1 miLoading sold comps…