 🏷️ Likely Rental
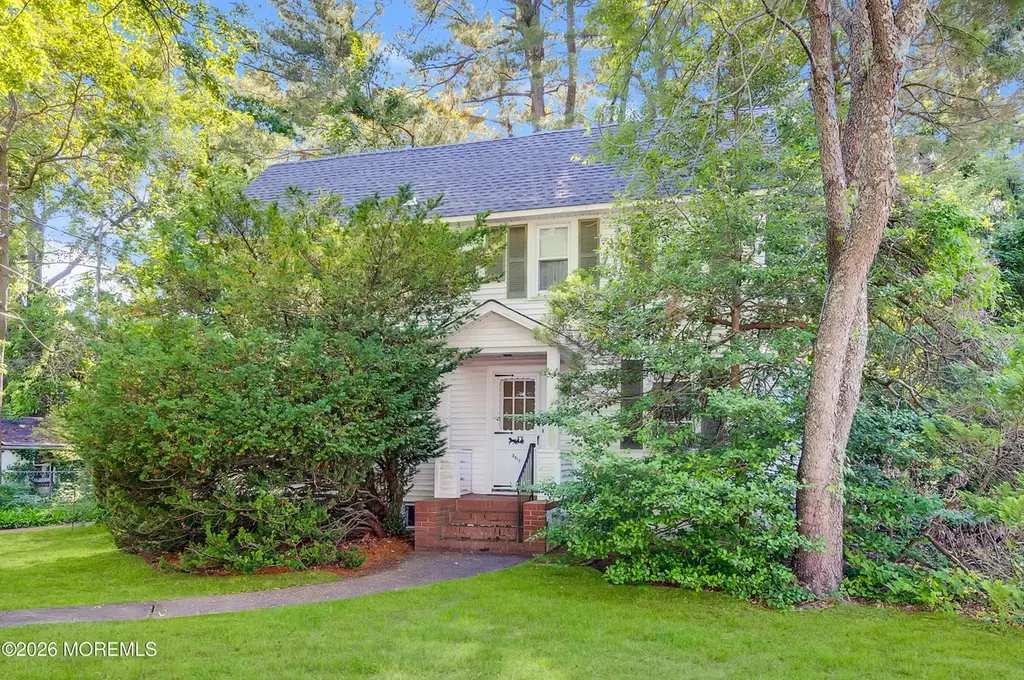
3311 Belmar Blvd · Shark River Hills, NJ
Flood risk 1/10 · Minimal
- FEMA flood zone
- X (unshaded)
- Chance of flooding over 30 yrs
- 0.0%
- Est. flood insurance / yr
- $473 – $860
Fire risk 1/10 · Minimal
- Est. fire insurance / yr
- $526 – $976
Heat risk 7/10 · Major
- Hot days now (above 96°F)
- 7 days/yr
- Hot days in 30 yrs
- 15 days/yr
Wind risk 8/10 · Major
- Chance of severe wind over 30 yrs
- 80.0%
Air-quality risk 3/10 · Minor
- Unhealthy air days now
- 3 days/yr
- Unhealthy air days in 30 yrs
- 5 days/yr
Risk factors via First Street. Map © Google.
Why this score? — see what drove the C+ grade
The composite is a weighted blend of 9 inputs, each scored 0–100. Each bar is that input's sub-score; the figure is the points it added to the 100-point composite (weight × sub-score).
- Cash flow +19.4/30.0
- ARV discount +15.0/15.0
- DSCR +6.1/10.0
- 1% rule +5.9/10.0
- Rent growth +5.0/5.0
- Schools +4.4/10.0
- Livability +3.5/5.0
- Condition / age +2.5/5.0
- Appreciation +0.0/10.0
$350,000
🖨 Deal sheet (PDF) 📄 Offer letter ✓ Due diligence
Listing remarks
Here's your chance to own a piece of Wall Township History! Originally built in 1900, this 2 bedroom 1.5 bath home that measures over 1700 square feet is a walk back into time and offers a brand new roof! Detached garage offers an addition that can be handyman's dream workshop and was used to complete airplane repairs for Allaire Airport. Another notable is the bungalow that has been weathered over time, but was one of the Summer Bungalows that were offered for rent during the turn of the century. All of this is sitting on almost an acre in Wall. Bring back to its original charm, renovate with a modern flare or knockdown and build new. This is a STRICTLY AS-IS SALE. Buyer responsible for al
Key facts
- Brand new roof
- Almost an acre
- 0.92 acre lot
Tags
Property features AI
Exterior
- Parking: Detached or attached garage with 1 garage space
- Utilities: Public sewer
- Home design: Fee simple ownership
- Exterior features: Shingle roof
Interior
- Kitchen: Stove; Refrigerator
- Bedrooms: 2 bedrooms (both on the second level)
- Flooring: Wood flooring; Linoleum flooring
- Bathrooms: 1 full bathroom; 1 half bathroom
- Heating & cooling: Forced air heating; No central air
- Interior features: Window treatments; Ceiling fan(s); Light fixtures; No fireplace
Neighborhood map
What this means for you Summary
Snapshot
- This is a 2-bed/1.5-bath single-family listed at $350k.
Deal economics
- At list price, monthly cash flow is $389 ($5k/yr) — positive.
- The deal already cash-flows at list — no discount required.
- Meets the 1% rule at list price ($4k rent vs $350k).
- Cap rate 7.6% vs local median 3.2% in Shark River Hills — top-decile yield for the area; either an underpriced asset or a hidden risk that comps aren't pricing in. Stress-test before assuming the spread holds.
Location & tenants
- Location reads 69/100 on livability (#297 in NJ) — a middle-class / working-renter tenant base. Strengths: crime A+, employment A+, housing A+; Watch: amenities F, commute F, cost of living F.
- Wall Township Public School District (suburban): math 36% / reading 58% proficiency, ranked #145 of 472 in NJ (top 31%) — families likely to look elsewhere, expect single-tenant / working-renter base with shorter leases; only 9% free/reduced lunch — higher-income household profile.
- Zoned schools: Central Elementary School (math 39% / reading 60%, grade D, #256 of 1,303 statewide, top 22%, 501 students, 10% FRL); Wall Intermediate School (math 33% / reading 58%, grade D+, #143 of 431 statewide, top 34%, 763 students, 9% FRL); Wall High School (math 32% / reading 61%, grade D-, #129 of 399 statewide, top 33%, 936 students, 10% FRL) — zoned schools at 10% FRL track the district average.
- Market conditions: Rents rising fast (+22.1%/yr); 90 active listings in the ZIP; 1 comparable units currently listed for rent nearby; high-income renter base; 2,840 units permitted in Monmouth County in 2024 (484 in 5+ unit buildings).
- This rent runs 38% of the median local income ($120k/yr) — at the standard rent-burdened threshold; future hikes will face affordability resistance.
Forward outlook
- Local home prices are declining (-3.0%/yr); year-one equity from $2k of loan paydown is wiped out by about $10k of value loss. Plan a longer hold.
- Monmouth County population projected at -11% by 2050 — secular population decline; favor cash flow + early exit over multi-decade hold.
- At projected returns (-3.0% appreciation + 8.0% rent growth), your $98k cash investment doubles in ~9 years — after that, you're playing with house money.
Negotiation context
- Only 4 days on market — expect competitive offers; lowballing is unlikely to land.
Risks & watch-outs
- Watch-outs: built in 1900 — expect roof / HVAC / electrical / plumbing capex.
- Climate carrying-cost: severe wind risk, 80% chance of damaging wind over 30y; extreme-heat days projected 7→15/yr by 2055 (HVAC capex compounding) — expect insurance premiums to compound above CPI over the hold.
Questions for the listing agent
- Built in 1900 — when were the roof, HVAC, electrical panel, plumbing, and water heater last replaced?
- Is there a deadline driving the sale (1031 exchange, divorce, estate, relocation)? That informs how much negotiation room exists.
- What's the average days-on-market for RENTAL listings here right now (not sales)? A rising rental-DOM trend means longer vacancies and softer asking-rent achievability than the comps imply.
- What's the recent tenant-quality profile in this submarket — average credit score on applications, eviction rate, late-payment / NSF rate, and stable-employment percentage? A property-management company in the area should have these aggregated.
- How much new for-sale + rental construction is in the pipeline within 1–3 miles? Heavy new supply typically softens prices + rents 12–24 months out; constrained supply supports both.
Investment metrics
- 1% rule
- 1.09% ✓
- Cap rate
- 7.63%
- Cash-on-cash
- 4.77%
- DSCR
- 1.21
- GRM
- 7.7
CMA / ARV
- ARV (on-the-fly)
- $683,590
- Comps found
- 7
Show comp detail 7 sales within ~0.75 mi
| Address | Dist | Beds/Ba | Sqft | Sold | Price | $/sf | Match |
|---|---|---|---|---|---|---|---|
| 2909 Arthur St | 0.59mi | 3/1.0 (+1) | 1,644 (-5%) | 11mo | $530,000 | $322 | 48 |
| 2914 Arthur St | 0.56mi | 3/2.0 (+1) | 1,872 (+8%) | 9mo | $775,000 | $414 | 46 |
| 2814 Pierce St | 0.73mi | 3/2.0 (+1) | 1,800 (+4%) | 10mo | $710,000 | $394 | 44 |
| 1402 Monmouth Blvd | 0.67mi | 3/2.5 (+1) | 1,786 (+3%) | 14mo | $785,000 | $440 | 44 |
| 3007 Pierce St | 0.58mi | 3/2.0 (+1) | 1,966 (+13%) | 12mo | $660,000 | $336 | 34 |
| 2913 Garfield St | 0.57mi | 3/1.5 (+1) | 1,504 (-13%) | 18mo | $540,000 | $359 | 31 |
| 1099 Morris Ln | 0.57mi | 3/2.5 (+1) | 1,520 (-12%) | 18mo | $1,225,000 | $806 | 29 |
Match score weights: distance 35% · size 25% · config 20% · recency 20%. Top-matched comps best support the ARV.
Projected returns pro-forma
-3.0% appreciation · 8.0% rent growth · sell at horizon
- IRR
- -3.0%
- Equity multiple
- 0.88×
- Total profit
- $-11,638
- Equity at exit
- $52,186
- IRR
- 11.9%
- Equity multiple
- 2.16×
- Total profit
- $114,017
- Equity at exit
- $30,262
Cash invested: $98,000 (down + closing). Projections, not guarantees.
Landlord ↔ Tenant lean methodology
- Overall (STATE)
- 21 Tenant-Leaning
- State New Jersey
- 21 Tenant-Leaning · D+6
- County
- — inherits STATE
- City
- — inherits STATE
ZIP-level market 07719
- Rents YoY
- 22.1%
- Active inventory
- 90
- Price-to-rent
- 7.7×
Monthly cashflow live
- Estimated rent
- $3,804 medium interval (Pro) →
- Mortgage (P&I)
- −$1,835
- Tax from tax record
- −$635 /mo · $7,615/yr
- Insurance
- −$146
- HOA
- −$0
- Vacancy / Maint / Mgmt
- −$799
- Net cashflow
- $389
Break-even live
Sensitivity live
| Price | -10% $587 | -5% $488 | +0% $389 | +5% $290 | +10% $191 |
|---|---|---|---|---|---|
| Rent | -10% $89 | -5% $239 | +0% $389 | +5% $540 | +10% $690 |
| Rate | -1.0pp $566 | -0.5pp $478 | base $389 | +0.5pp $299 | +1.0pp $206 |
UW: 25.0% down · 7.5% · 30yr · 1.5% tax · 5.0% vac · 8.0% maint · 8.0% mgmt
Financing live
Cash to close
- Down payment
- $87,500
- Closing costs
- $10,500
- Reserves months
- —
- Total cash needed
- —
Loan-product check · same deal, 3 products live
Conventional
25% down · 7.5% · 30yr
- Down + closing
- —
- Monthly P&I
- —
- Monthly cashflow
- —
- DSCR
- —
- Eligible?
- —
Personal DTI + credit; lowest rate.
DSCR
20% down · 8.5% · 30yr
- Down + closing
- —
- Monthly P&I
- —
- Monthly cashflow
- —
- DSCR
- —
- Eligible?
- —
No personal income docs; deal must DSCR.
Hard money
10% down · 12.0% · 12mo
- Down + closing
- —
- Monthly P&I
- —
- Monthly cashflow
- —
- DSCR
- —
- Eligible?
- —
Short-term bridge; refi at stabilization.
Rent comps 1 comps
| Address | Beds | Baths | Sqft | Rent | $/sqft | DOM | Units | Dist |
|---|---|---|---|---|---|---|---|---|
| 3400 Aspen Cir Wall Township, NJ | 1.0–3.0 | 1.0–2.0 | 1130 | $3,756 | $3.32 | 0d | 1 | 1.30mi |
Listing history 3 events
-
2026-06-21days on market $350,000 Active 4 DOM
-
2026-06-17remarks 699-char remark
-
2026-06-17$350,000 Active 1 DOM
ⓘ Source: listings_history table (triggers on properties + properties_extension) + one-shot
backfill from property_details.listing_events for pre-trigger history.
Tax reassessment forecast NJ · Partial reset (capped growth)
- Current annual tax
- $7,615 · $635/mo
- Projected year-2 tax
- $8,165 · $680/mo
- Expected delta
- +$550/yr (+$46/mo · 7.2%)
ⓘ Screening estimate from a state-policy table — verify with the county assessor before closing.
Climate risk First Street
- Flood 1/10 Low FEMA zone X (unshaded) · 0% chance over 30 yrs
- Wildfire 1/10 Low
- Heat 7/10 Severe 7 d/yr ≥96°F today · 15 d/yr by 30 yrs out
- Wind 8/10 Severe 80% chance of damaging wind over 30 yrs
- Air quality 3/10 Moderate 3 unhealthy d/yr today · 5 by 30 yrs out
Nearby sold comps map
Loading sold comps map…
Walkable amenities ~0.75 mi
Loading nearby amenities…
Taxation est. · year 1
- Rental income
- $45,648
- − Mortgage interest
- −$19,605
- − Property taxes
- −$7,615
- − Insurance
- −$1,750
- − Repairs & maintenance
- −$3,652
- − Management
- −$3,652
- − Depreciation
- −$10,182
- Taxable loss
- −$808
- Est. tax savings @ 24.0%
- +$194
- After-tax cash flow
- $4,866/yr
For passive investors: Depreciation is non-cash, so a rental often shows a tax loss while cash-flowing — sheltering income. Rental losses are passive: they offset passive income freely, and up to $25,000/yr can offset ordinary (W-2) income if you actively participate and your MAGI is under $100k (phasing out to $0 by $150k); unused losses carry forward. On sale, claimed depreciation is recaptured at up to 25%, and gains may owe capital-gains tax (a 1031 exchange can defer both). Figures are a year-1 estimate at your 24.0% rate — not tax advice; consult a CPA.
Schools (NCES district)
- District
- Wall Township Public School District
- NCES district ID
- 3416890
- Math proficiency
- 36% ▼ -25.00%
- Reading proficiency
- 58% ▼ -10.00%
- Median HH income
- $92,842
- Composite
- 44.31/100
- National rank
- #2831
- State rank
- #145 of 472 in NJ
Livability — Shark River Hills
- Score
- 69/100
- State rank
- #297
- US rank
- #8953
Category grades
Schools grade is shown separately in the Schools card above.
Census & demographics
- County
- Monmouth County · 505,557 people
- Metro
- New York-Newark-Jersey City, NY-NJ-PA
- Population (ZIP)
- 22,138
- Household income
- $119,828
- Rent vs Own
- Severe rent burden
- 513.0
Population outlook (Monmouth County) Hauer SSP2
- Today (2025)
- 620,308 people
- By 2030
- 612,309 · -1.3%
- By 2040
- 587,297 · -5.3%
- By 2050
- 551,342 · -11.1%
- By 2075
- 472,934 · -23.8%
- By 2100
- 381,534 · -38.5%
Race, ethnicity, and origin ACS 2023
- Neighborhood character
- Predominantly White (83%)
- Race & ethnicity
- White 83% Hispanic / Latino 11% Two or more races 5% Asian 2% Black 1%
- Hispanic origin (detail)
- Mexican 4% Puerto Rican 2% Cuban 1%
- Common ancestry
- Romanian 7% Italian 3% Iranian 1%
- Foreign-born
- 6% · Canada, Guatemala, Dominican Republic
- Languages at home
- 90% English-only · Spanish 7% Other Indo-European 1% Tagalog/Filipino 1%
Political lean MEDSL · Monmouth
- 2024 margin
- R (+11.4) · D 43.4% · R 54.8% · Other 1.8%
- 2008→2024 swing
- -7.7pp toward R · 2008: -3.7pp · 2024: -11.4pp
- All cycles
- 2024: R+11.4 2020: R+2.8 2016: R+9.5 2012: R+5.5 2008: R+3.7
Not yet ingested
- Civics
- —
Market trends
- HPI YoY
- ▼ -537.99%
- Current HPI
- 379.3961
- Rent YoY
- ▲ 22.08%
- Metro
- New York-Newark-Jersey City, NY-NJ-PA
- State GDP YoY
- ▲ 2.05%
- F500 in state
- 34
Industry mix (Fortune 500 HQ in NJ)
| Industry | F500 HQs | Revenue |
|---|---|---|
| Consumer Goods | 3 | $31B |
|
||
| Pharmaceuticals | 2 | $153B |
|
||
| Technology | 2 | $21B |
|
||
| Insurance | 2 | $20B |
|
||
| Healthcare | 2 | $19B |
|
||
| Financial Services | 1 | $70B |
|
||
Price history
1 event — show timeline
- 2026-06-17 Listed $350,000 MOMLS
Property tax history
+2.5%/yrLatest (2025): $7,615 · +4.8% YoY. Source: county tax records.
Cash-flow waterfall
monthlySold comps — $/sqft
last 12 mo · ≤1 miLoading sold comps…