1000 Dover St · Centralia, IL
Flood risk 1/10 · Minimal
- FEMA flood zone
- X (unshaded)
- Chance of flooding over 30 yrs
- 0.0%
- Est. flood insurance / yr
- $507 – $1,088
Fire risk 1/10 · Minimal
- Est. fire insurance / yr
- $804 – $1,492
Heat risk 4/10 · Minor
- Hot days now (above 105°F)
- 7 days/yr
- Hot days in 30 yrs
- 20 days/yr
Wind risk 2/10 · Minimal
- Chance of severe wind over 30 yrs
- 2.0%
Air-quality risk 2/10 · Minimal
- Unhealthy air days now
- 1 days/yr
- Unhealthy air days in 30 yrs
- 1 days/yr
Risk factors via First Street. Map © Google.
Why this score? — see what drove the B+ grade
The composite is a weighted blend of 9 inputs, each scored 0–100. Each bar is that input's sub-score; the figure is the points it added to the 100-point composite (weight × sub-score).
- Cash flow +30.0/30.0
- ARV discount +15.0/15.0
- 1% rule +10.0/10.0
- DSCR +10.0/10.0
- Livability +3.4/5.0
- Rent growth +2.5/5.0
- Condition / age +2.5/5.0
- Schools +2.2/10.0
- Appreciation +0.0/10.0
$29,900
🖨 Deal sheet (PDF) 📄 Offer letter ✓ Due diligence
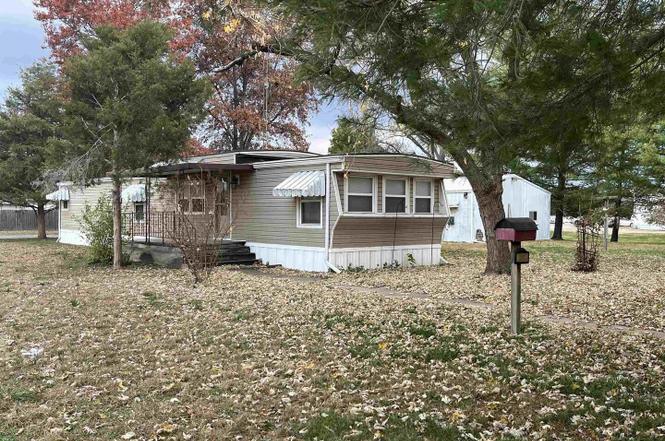
Listing remarks
Discover the potential of this 1976 single-wide mobile home set on four lots totaling 0.49 acres. The home is being sold as-is and, while in overall good condition, it does need flooring repairs, including a few soft spots and holes. With some updates, it can be transformed into a comfortable full-time residence or a great investment property. A major highlight of this property is the 25' x 36' detached garage, offering two overhead doors, a concrete floor, and electricity-perfect for vehicles, storage, or workshop space. Additionally, the property includes two small storage sheds; the metal shed is equipped with electricity, providing even more functional utility. Situated on nearly half a
Key facts
- Extra outdoor space
- Storage sheds
- Room to expand
Tags
Neighborhood map
What this means for you Summary
Snapshot
- This is a 2-bed/1.0-bath single-family listed at $30k.
Deal economics
- At list price, monthly cash flow is $540 ($6k/yr) — positive.
- The deal already cash-flows at list — no discount required.
- Meets the 1% rule at list price ($945 rent vs $30k).
- Recommended offer: $29k (1.5% below list) — sets the bar for market timing.
- Cap rate 28.0% vs local median 5.8% in Centralia — top-decile yield for the area; either an underpriced asset or a hidden risk that comps aren't pricing in. Stress-test before assuming the spread holds.
Location & tenants
- Location reads 68/100 on livability (#481 in IL) — a middle-class / working-renter tenant base. Strengths: cost of living A+, housing A+, health & safety A+; Watch: schools D, crime F, amenities F.
- Centralia Hsd 200 (town): math 21% / reading 26% proficiency, ranked #668 of 919 in IL (top 73%) — low school quality limits family demand, transient renter base, plan for 1-2y turnover.
- Market conditions: 107 active listings in the ZIP; 1 comparable units currently listed for rent nearby; 64 units permitted in Clinton County in 2024 (0 in 5+ unit buildings).
Forward outlook
- Local home prices are declining (-3.0%/yr); year-one equity from $207 of loan paydown is wiped out by about $897 of value loss. Plan a longer hold.
- Clinton County population projected at -12% by 2050 — secular population decline; favor cash flow + early exit over multi-decade hold.
- At projected returns (-3.0% appreciation + 3.0% rent growth), your $8k cash investment doubles in ~2 years — after that, you're playing with house money.
Negotiation context
- It's been on market 16 days — a 2% lower offer ($29k) is reasonable based on typical stale-listing flexibility.
- Current owner paid $25k; 20% above their basis — modest negotiation headroom, anchor on the comps not their cost.
Questions for the listing agent
- Built in 1976 — when were the roof, HVAC, electrical panel, plumbing, and water heater last replaced?
- Is there a deadline driving the sale (1031 exchange, divorce, estate, relocation)? That informs how much negotiation room exists.
- Schools are D-rated, which usually means shorter tenancies and higher turnover. Who's the typical renter profile here, and what's been the actual vacancy rate?
- Crime grade is F in this area — have there been break-ins, vandalism, or insurance claims at this property in the last 3 years? What carrier currently insures it and at what premium?
- What's the average days-on-market for RENTAL listings here right now (not sales)? A rising rental-DOM trend means longer vacancies and softer asking-rent achievability than the comps imply.
- What's the recent tenant-quality profile in this submarket — average credit score on applications, eviction rate, late-payment / NSF rate, and stable-employment percentage? A property-management company in the area should have these aggregated.
- How much new for-sale + rental construction is in the pipeline within 1–3 miles? Heavy new supply typically softens prices + rents 12–24 months out; constrained supply supports both.
Investment metrics
- 1% rule
- 3.16% ✓
- Cap rate
- 27.96%
- Cash-on-cash
- 77.39%
- DSCR
- 4.44
- GRM
- 2.6
CMA / ARV
- ARV (on-the-fly)
- $49,728
- Comps found
- 8
Show comp detail 8 sales within ~0.75 mi
| Address | Dist | Beds/Ba | Sqft | Sold | Price | $/sf | Match |
|---|---|---|---|---|---|---|---|
| 1000 Dover St | 0.00mi | 2/1.0 | 1,036 (0%) | 5mo | $25,000 | $24 | 96 |
| 1101 S Cherry St | 0.23mi | 2/1.0 | 1,000 (-4%) | 7mo | $47,000 | $47 | 78 |
| 1215 S Brookside St | 0.24mi | 2/2.0 | 1,170 (+13%) | 8mo | $51,000 | $44 | 56 |
| 416 Geary St | 0.59mi | 2/1.5 | 1,056 (+2%) | 18mo | $102,000 | $97 | 52 |
| 301 S Pullen Blvd | 0.65mi | 2/1.0 | 1,040 (+0%) | 22mo | $69,900 | $67 | 51 |
| 427 Delores St | 0.55mi | 3/1.0 (+1) | 1,144 (+10%) | 15mo | $62,500 | $55 | 40 |
| 307 S Hickory | 0.72mi | 2/1.0 | 1,146 (+11%) | 15mo | $54,900 | $48 | 36 |
| 623 S Locust St | 0.66mi | 2/1.0 | 1,160 (+12%) | 18mo | $24,000 | $21 | 34 |
Match score weights: distance 35% · size 25% · config 20% · recency 20%. Top-matched comps best support the ARV.
Projected returns pro-forma
-3.0% appreciation · 3.0% rent growth · sell at horizon
- IRR
- 77.4%
- Equity multiple
- 4.53×
- Total profit
- $29,557
- Equity at exit
- $4,458
- IRR
- 81.0%
- Equity multiple
- 9.37×
- Total profit
- $70,075
- Equity at exit
- $2,585
Cash invested: $8,372 (down + closing). Projections, not guarantees.
Landlord ↔ Tenant lean methodology
- Overall (STATE)
- 43 Moderately Tenant-Leaning
- State Illinois
- 43 Moderately Tenant-Leaning · D+7
- County
- — inherits STATE
- City
- — inherits STATE
ZIP-level market 62801
- Home prices YoY
- -13.9%
- Active inventory
- 107
- Price-to-rent
- 2.6×
Monthly cashflow live
- Estimated rent
- $945 medium interval (Pro) →
- Mortgage (P&I)
- −$157
- Tax est. 1.5%
- −$37 /mo · $448/yr
- Insurance
- −$12
- HOA
- −$0
- Vacancy / Maint / Mgmt
- −$198
- Net cashflow
- $540
Break-even live
Sensitivity live
| Price | -10% $561 | -5% $550 | +0% $540 | +5% $530 | +10% $519 |
|---|---|---|---|---|---|
| Rent | -10% $465 | -5% $503 | +0% $540 | +5% $577 | +10% $615 |
| Rate | -1.0pp $555 | -0.5pp $548 | base $540 | +0.5pp $532 | +1.0pp $524 |
UW: 25.0% down · 7.5% · 30yr · 1.5% tax · 5.0% vac · 8.0% maint · 8.0% mgmt
Financing live
Cash to close
- Down payment
- $7,475
- Closing costs
- $897
- Reserves months
- —
- Total cash needed
- —
Loan-product check · same deal, 3 products live
Conventional
25% down · 7.5% · 30yr
- Down + closing
- —
- Monthly P&I
- —
- Monthly cashflow
- —
- DSCR
- —
- Eligible?
- —
Personal DTI + credit; lowest rate.
DSCR
20% down · 8.5% · 30yr
- Down + closing
- —
- Monthly P&I
- —
- Monthly cashflow
- —
- DSCR
- —
- Eligible?
- —
No personal income docs; deal must DSCR.
Hard money
10% down · 12.0% · 12mo
- Down + closing
- —
- Monthly P&I
- —
- Monthly cashflow
- —
- DSCR
- —
- Eligible?
- —
Short-term bridge; refi at stabilization.
Rent comps 1 comps
| Address | Beds | Baths | Sqft | Rent | $/sqft | DOM | Units | Dist |
|---|---|---|---|---|---|---|---|---|
| 210 Rolston St Centralia, IL | 2.0 | 1.0 | 1048 | $945 | $0.90 | 45d | 1 | 0.99mi |
Listing history 14 events
-
2026-05-24status Pending
-
2026-05-24status Pending
-
2026-05-22status Pending
-
2026-01-16soldstatus $25,000 Closed
-
2026-01-16soldstatus $25,000 Closed
-
2026-01-16soldstatus $25,000 Closed
-
2026-01-16soldstatus $25,000 Closed
-
2026-01-08status Pending
-
2026-01-05historical
-
2026-01-02status Pending
-
2025-12-18historical Contingent - Continue to Show
-
2025-12-18historical Under Contract
-
2025-12-17historical
-
2025-11-18Active
ⓘ Source: listings_history table (triggers on properties + properties_extension) + one-shot
backfill from property_details.listing_events for pre-trigger history.
Climate risk First Street
- Flood 1/10 Low FEMA zone X (unshaded) · 0% chance over 30 yrs
- Wildfire 1/10 Low
- Heat 4/10 Moderate 7 d/yr ≥105°F today · 20 d/yr by 30 yrs out
- Wind 2/10 Low 2% chance of damaging wind over 30 yrs
- Air quality 2/10 Low 1 unhealthy d/yr today · 1 by 30 yrs out
Nearby sold comps map
Loading sold comps map…
Walkable amenities ~0.75 mi
Loading nearby amenities…
Taxation est. · year 1
- Rental income
- $11,340
- − Mortgage interest
- −$1,675
- − Property taxes
- −$448
- − Insurance
- −$150
- − Repairs & maintenance
- −$907
- − Management
- −$907
- − Depreciation
- −$870
- Taxable income
- $6,383
- Est. tax owed @ 24.0%
- −$1,532
- After-tax cash flow
- $4,947/yr
For passive investors: Depreciation is non-cash, so a rental often shows a tax loss while cash-flowing — sheltering income. Rental losses are passive: they offset passive income freely, and up to $25,000/yr can offset ordinary (W-2) income if you actively participate and your MAGI is under $100k (phasing out to $0 by $150k); unused losses carry forward. On sale, claimed depreciation is recaptured at up to 25%, and gains may owe capital-gains tax (a 1031 exchange can defer both). Figures are a year-1 estimate at your 24.0% rate — not tax advice; consult a CPA.
Schools (NCES district)
- District
- Centralia Hsd 200
- NCES district ID
- 1709300
- Math proficiency
- 21% ▲ 6.00%
- Reading proficiency
- 26% ▲ 1.00%
- Median HH income
- $34,555
- Composite
- 22.43/100
- National rank
- #13470
- State rank
- #668 of 919 in IL
Livability — Centralia
- Score
- 68/100
- State rank
- #481
- US rank
- #9987
Category grades
Schools grade is shown separately in the Schools card above.
Census & demographics
- Census place
- Centralia, IL
- City population
- 19,941
- Population (ZIP)
- 19,941
Population outlook (Clinton County) Hauer SSP2
- Today (2025)
- 37,663 people
- By 2030
- 37,194 · -1.2%
- By 2040
- 35,566 · -5.6%
- By 2050
- 32,950 · -12.5%
- By 2075
- 26,403 · -29.9%
- By 2100
- 19,267 · -48.8%
Race, ethnicity, and origin ACS 2023
- Neighborhood character
- Predominantly White (81%)
- Race & ethnicity
- White 81% Black 11% Two or more races 4% Hispanic / Latino 4% Asian 1%
- Common ancestry
- Serbian 2% Romanian 2% Lithuanian 1%
- Foreign-born
- 3% · Canada, China
- Languages at home
- 96% English-only · Spanish 2%
Political lean MEDSL · Clinton
- 2024 margin
- Solid R (+51.8) · D 23.1% · R 75.0% · Other 1.9%
- 2008→2024 swing
- -42.0pp toward R · 2008: -9.8pp · 2024: -51.8pp
- All cycles
- 2024: R+51.8 2020: R+51.1 2016: R+49.0 2012: R+30.0 2008: R+9.8
Not yet ingested
- Civics
- —
Market trends
- HPI YoY
- ▼ -34.12%
- Current HPI
- 211.3835
- Rent YoY
- —
- Metro
- —
- State GDP YoY
- ▲ 1.59%
- F500 in state
- 60
Industry mix (Fortune 500 HQ in IL)
| Industry | F500 HQs | Revenue |
|---|---|---|
| Insurance | 4 | $201B |
|
||
| Consumer Goods | 4 | $87B |
|
||
| Industrial Machinery | 3 | $64B |
|
||
| Healthcare | 2 | $55B |
|
||
| Retail / Pharmacy | 1 | $148B |
|
||
| Agriculture / Food | 1 | $86B |
|
||
Price history
+0.0% since first listed14 events — show timeline
- 2026-05-24 Pending — MRED as Distributed by MLS Grid
- 2026-05-24 Pending — MRED as Distributed by MLS Grid
- 2026-05-22 Pending — MRED as Distributed by MLS Grid
- 2026-01-16 Sold (MLS) $25,000 MRED as Distributed by MLS Grid
- 2026-01-16 Sold (MLS) $25,000 MRED as Distributed by MLS Grid
- 2026-01-16 Sold (MLS) $25,000 MRED as Distributed by MLS Grid
- 2026-01-16 Sold (MLS) $25,000 MRED as Distributed by MLS Grid
- 2026-01-08 Pending — MRED as Distributed by MLS Grid
- 2026-01-05 Listing Removed — MRED as Distributed by MLS Grid
- 2026-01-02 Pending — MRED as Distributed by MLS Grid
- 2025-12-18 Contingent — MRED as Distributed by MLS Grid
- 2025-12-18 Contingent — RMLSA as Distributed by MLS Grid
- 2025-12-17 Listing Removed — RMLSA as Distributed by MLS Grid
- 2025-11-18 Listed — RMLSA as Distributed by MLS Grid
Cash-flow waterfall
monthlySold comps — $/sqft
last 12 mo · ≤1 miLoading sold comps…