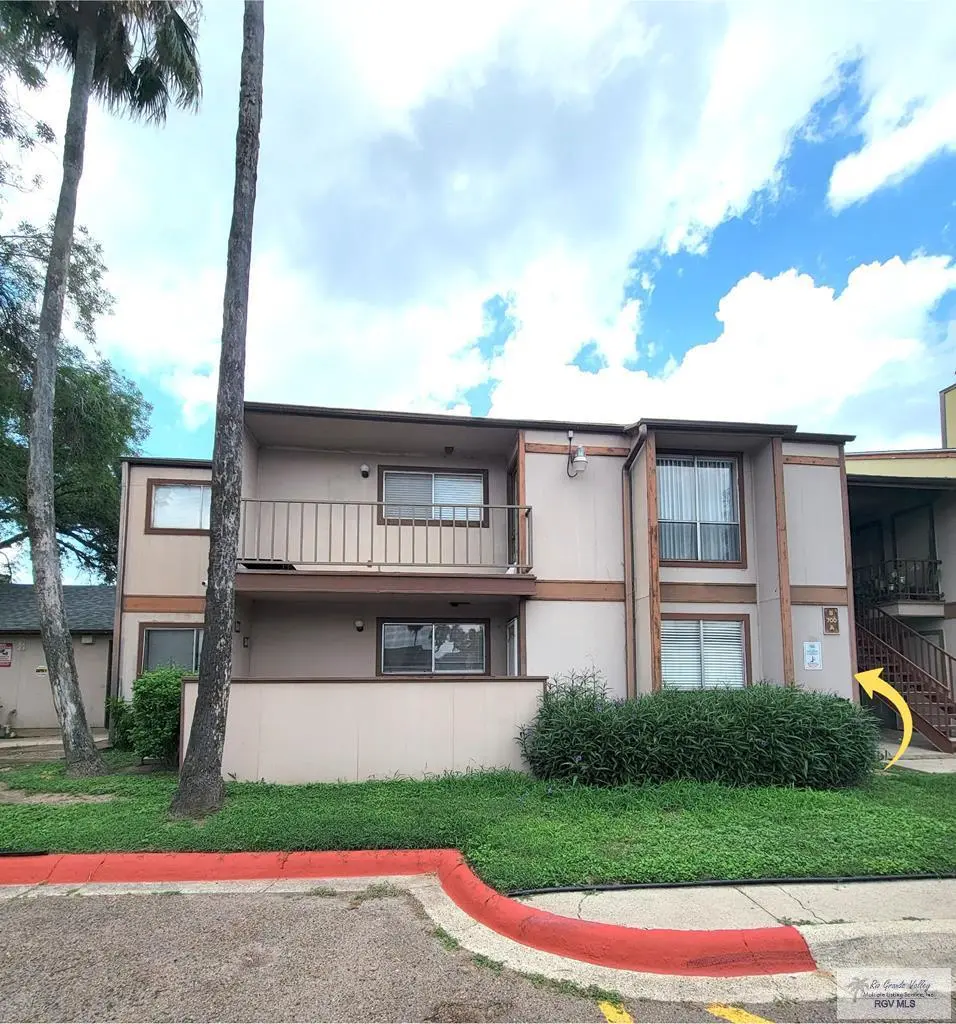
3005 Old Alice Rd Unit 700A · Brownsville, TX
Flood risk 1/10 · Minimal
- FEMA flood zone
- X (unshaded)
- Chance of flooding over 30 yrs
- 0.0%
- Est. flood insurance / yr
- $507 – $1,088
Fire risk 1/10 · Minimal
- Est. fire insurance / yr
- $1,222 – $2,270
Heat risk 9/10 · Severe
- Hot days now (above 110°F)
- 7 days/yr
- Hot days in 30 yrs
- 25 days/yr
Wind risk 9/10 · Severe
- Chance of severe wind over 30 yrs
- 99.0%
Air-quality risk 3/10 · Minor
- Unhealthy air days now
- 2 days/yr
- Unhealthy air days in 30 yrs
- 3 days/yr
Risk factors via First Street. Map © Google.
Why this score? — see what drove the D grade
The composite is a weighted blend of 9 inputs, each scored 0–100. Each bar is that input's sub-score; the figure is the points it added to the 100-point composite (weight × sub-score).
- Cash flow +11.8/30.0
- ARV discount +7.5/15.0
- 1% rule +6.4/10.0
- Rent growth +4.5/5.0
- Livability +4.0/5.0
- DSCR +3.5/10.0
- Schools +2.2/10.0
- Condition / age +2.0/5.0
- Appreciation +0.0/10.0
$129,000
🖨 Deal sheet (PDF) 📄 Offer letter ✓ Due diligence
Listing remarks MLS
NICE UNIT BEING RENTED 2 bed 1 bath remodeled. GOOD FOR AN INVESTOR RENT at the moment is $1100.
Key facts
- Refreshing pool
- Community amenities
- First floor
Tags
Property features AI
Finance
- HOA & community: Homeowners association with monthly fee
Exterior
- Utilities: Public sewer
- Home design: Residential condominium; Single-story; Slab foundation
- Construction: Composition roof
- Exterior features: Covered patio/porch; In-ground pool
Interior
- Flooring: Tile
- Bathrooms: 1 full bathroom
- Heating & cooling: Central heating; Central air conditioning
- Interior features: Electric water heater; Tile flooring; Central heating and central air conditioning
Neighborhood map
What this means for you Summary
Snapshot
- This is a 2-bed/1.0-bath condo listed at $129k. Condition is rated fair.
Deal economics
- At list price, monthly cash flow is $-35 ($-423/yr) — negative.
- The deal already cash-flows at list — no discount required.
- Meets the 1% rule at list price ($1k rent vs $129k).
- Recommended offer: $127k (1.5% below list) — sets the bar for market timing.
- Cap rate 6.0% vs local median 5.0% in Brownsville — meaningfully above typical; check what's discounted (condition, days-on-market, listing class) to confirm the premium yield is real.
Location & tenants
- Location reads 79/100 on livability (#62 in TX, #2,311 nationally) — a middle-class / working-renter tenant base. Strengths: commute A+, cost of living A+, housing A+; Watch: amenities D, crime D-, employment F.
- Brownsville ISD (urban): math 20% / reading 34% proficiency, ranked #710 of 826 in TX (top 86%) — low school quality limits family demand, transient renter base, plan for 1-2y turnover; 83% free/reduced lunch — lower-income household profile, screen leases tightly.
- Zoned schools: Martin El (math 27% / reading 37%, grade F, #2,268 of 4,322 statewide, top 55%, 438 students, 88% FRL); Oliveira Middle (math 23% / reading 37%, grade F, #1,056 of 1,662 statewide, top 65%, 802 students, 94% FRL); Hanna Early College H S (math 24% / reading 49%, grade F, #924 of 1,632 statewide, top 57%, 2,246 students, 88% FRL).
- Market conditions: Rents rising fast (+8.2%/yr); 366 active listings in the ZIP; 36 comparable units currently listed for rent nearby; rentals at typical pace (median 23d on market — plan ~3-4 weeks tenant-placement turnaround); 47% of comp listings sitting > 30 days — soft ceiling on asking rent; lower-income renter base — watch delinquency; 2,326 units permitted in Cameron County in 2024 (503 in 5+ unit buildings).
- This rent runs 40% of the median local income ($45k/yr) — at the standard rent-burdened threshold; future hikes will face affordability resistance.
Forward outlook
- Local home prices are declining (-3.0%/yr); year-one equity from $892 of loan paydown is wiped out by about $4k of value loss. Plan a longer hold.
- Cameron County population projected at +3% by 2050 — modest demand growth; plan on rents tracking national, not racing it.
Negotiation context
- It's been on market 27 days — a 2% lower offer ($127k) is reasonable based on typical stale-listing flexibility.
- 3 sale attempts since 5y ago with the ask held roughly flat each time — persistent listings suggest the price (not the market) is what's stuck; bring a comps-based counter.
Risks & watch-outs
- Watch-outs: HOA is 21% of rent.
- Climate carrying-cost: severe wind risk, 99% chance of damaging wind over 30y; extreme-heat days projected 7→25/yr by 2055 (HVAC capex compounding) — expect insurance premiums to compound above CPI over the hold.
Questions for the listing agent
- What do current leases actually rent for vs. the listed asking? Can we see a recent rent roll and the last 12 months of T-12 income?
- Have any recent inspections been done? Can we get a copy of the seller's disclosures and any deferred-maintenance estimates?
- Built in 1974 — when were the roof, HVAC, electrical panel, plumbing, and water heater last replaced?
- What does the HOA fee cover, when was the last increase, and are there any pending special assessments or reserve-fund shortfalls?
- Any open or pending special assessments — roof, HVAC, plumbing, elevator, façade? What's the per-unit balance and payoff schedule, and is the seller paying it off at close or rolling it to the buyer?
- Is there a deadline driving the sale (1031 exchange, divorce, estate, relocation)? That informs how much negotiation room exists.
- Crime grade is D in this area — have there been break-ins, vandalism, or insurance claims at this property in the last 3 years? What carrier currently insures it and at what premium?
- The area grade is low — what's the realistic commute time and amenity access for the typical tenant pool here? Any planned neighborhood developments (good or bad) we should know about?
- What's the average days-on-market for RENTAL listings here right now (not sales)? A rising rental-DOM trend means longer vacancies and softer asking-rent achievability than the comps imply.
- What's the recent tenant-quality profile in this submarket — average credit score on applications, eviction rate, late-payment / NSF rate, and stable-employment percentage? A property-management company in the area should have these aggregated.
- How much new apartment / multifamily construction is in the pipeline within 1–3 miles? Heavy new supply (>2% of stock underway) typically softens rents 12–24 months out; light construction supports rent growth.
Investment metrics
- 1% rule
- 1.14% ✓
- Cap rate
- 5.96%
- Cash-on-cash
- -1.17%
- DSCR
- 0.95
- GRM
- 7.3
CMA / ARV
No comps found within radius.
Projected returns pro-forma
-3.0% appreciation · 8.0% rent growth · sell at horizon
- IRR
- -10.9%
- Equity multiple
- 0.58×
- Total profit
- $-15,194
- Equity at exit
- $19,234
- IRR
- 5.8%
- Equity multiple
- 1.55×
- Total profit
- $19,985
- Equity at exit
- $11,154
Cash invested: $36,120 (down + closing). Projections, not guarantees.
Landlord ↔ Tenant lean methodology
- Overall (STATE)
- 87 Strongly Landlord-Friendly
- State Texas
- 87 Strongly Landlord-Friendly · R+5
- County
- — inherits STATE
- City
- — inherits STATE
ZIP-level market 78521
- Home prices YoY
- -26.0%
- Rents YoY
- 8.2%
- Active inventory
- 366
- Price-to-rent
- 7.3×
Monthly cashflow live
- Estimated rent
- $1,466 high interval (Pro) →
- Mortgage (P&I)
- −$676
- Tax est. 1.5%
- −$161 /mo · $1,935/yr
- Insurance
- −$54
- HOA est. from 1 same-building comp
- −$302
- Vacancy / Maint / Mgmt
- −$308
- Net cashflow
- $-35
Break-even live
Sensitivity live
| Price | -10% $54 | -5% $9 | +0% $-35 | +5% $-80 | +10% $-124 |
|---|---|---|---|---|---|
| Rent | -10% $-151 | -5% $-93 | +0% $-35 | +5% $23 | +10% $81 |
| Rate | -1.0pp $30 | -0.5pp $-2 | base $-35 | +0.5pp $-69 | +1.0pp $-103 |
UW: 25.0% down · 7.5% · 30yr · 1.5% tax · 5.0% vac · 8.0% maint · 8.0% mgmt
Financing live
Cash to close
- Down payment
- $32,250
- Closing costs
- $3,870
- Reserves months
- —
- Total cash needed
- —
Loan-product check · same deal, 3 products live
Conventional
25% down · 7.5% · 30yr
- Down + closing
- —
- Monthly P&I
- —
- Monthly cashflow
- —
- DSCR
- —
- Eligible?
- —
Personal DTI + credit; lowest rate.
DSCR
20% down · 8.5% · 30yr
- Down + closing
- —
- Monthly P&I
- —
- Monthly cashflow
- —
- DSCR
- —
- Eligible?
- —
No personal income docs; deal must DSCR.
Hard money
10% down · 12.0% · 12mo
- Down + closing
- —
- Monthly P&I
- —
- Monthly cashflow
- —
- DSCR
- —
- Eligible?
- —
Short-term bridge; refi at stabilization.
Rent comps 36 comps
| Address | Beds | Baths | Sqft | Rent | $/sqft | DOM | Units | Dist |
|---|---|---|---|---|---|---|---|---|
| 3500 Old Alice Rd Unit 1100 H Brownsville, TX | 2.0 | 1.0 | 1005 | $1,500 | $1.49 | 45d | 1 | 0.04mi |
| 375 Media Luna Rd Brownsville, TX | 1.0–3.0 | 1.0–2.0 | 940 | $1,202 | $1.28 | 15d | 2 | 0.21mi |
| 401 Jose Marti Blvd Brownsville, TX | 1.0 | 1.5 | 711 | $1,200 | $1.69 | 23d | 1 | 0.38mi |
| 441 Jose Marti Blvd Brownsville, TX | 1.0 | 1.5 | 750 | $2,000 | $2.67 | 45d | 1 | 0.46mi |
| 745 Media Luna Rd Unit SANTANDER Brownsville, TX | 1.0 | 1.5 | 800 | $1,400 | $1.75 | 45d | 1 | 0.54mi |
| 745 Media Luna Rd Unit SEVILLA Brownsville, TX | 1.0 | 1.5 | 800 | $1,400 | $1.75 | 23d | 1 | 0.54mi |
| 95 Poinciana Dr Brownsville, TX | 1.0–3.0 | 1.5–2.0 | 1130 | $2,075 | $1.84 | 45d | 2 | 0.60mi |
| 95 Poinciana Dr Brownsville, TX | 2.0–3.0 | 2.0 | 1218 | $1,500 | $1.23 | 15d | 2 | 0.60mi |
| 714 Continental Dr #3 Brownsville, TX | 3.0 | 2.5 | 1482 | $2,400 | $1.62 | 45d | 1 | 0.63mi |
| 801 Continental Dr #3 Brownsville, TX | 1.0 | 1.0 | 986 | $1,225 | $1.24 | 23d | 1 | 0.65mi |
| 2100 W San Marcelo Blvd Brownsville, TX | 2.0–3.0 | 2.0–2.5 | 1069 | $1,450 | $1.36 | 45d | 2 | 0.68mi |
| 2901 Central Blvd Unit 202 Brownsville, TX | 2.0 | 2.0 | 1176 | $1,400 | $1.19 | 23d | 1 | 0.74mi |
| 2100 W San Marcelo Blvd Apt 185 Brownsville, TX | 2.0 | 2.0 | 1024 | $1,500 | $1.46 | 23d | 1 | 0.76mi |
| 2425 Barnard Rd Brownsville, TX | 1.0–2.0 | 1.0–2.0 | 886 | $1,165 | $1.31 | 15d | 12 | 0.77mi |
| 460 Gilson Rd Unit 2 Brownsville, TX | 2.0 | 1.0 | 850 | $875 | $1.03 | 23d | 1 | 0.77mi |
| 2425 Barnard Rd Unit ujnit 1-A Brownsville, TX | 3.0 | 1.5 | 1300 | $1,600 | $1.23 | 45d | 1 | 0.78mi |
| 2425 Barnard Rd Unit A-13 Brownsville, TX | 2.0 | 2.0 | 1137 | $1,250 | $1.10 | 45d | 1 | 0.78mi |
| 625 Habana St Brownsville, TX | 1.0 | 1.0 | 700 | $900 | $1.29 | 23d | 1 | 0.82mi |
| 424 Gilson Rd Brownsville, TX | 3.0 | 2.0 | 1399 | $1,500 | $1.07 | 45d | 1 | 0.83mi |
| 402 Champions Dr Brownsville, TX | 2.0 | 1.5 | 814 | $1,300 | $1.60 | 23d | 1 | 0.92mi |
| 142 Country Club Rd Brownsville, TX | 3.0 | 2.5 | 1460 | $1,800 | $1.23 | 45d | 1 | 0.96mi |
| 10 Country Club Rd Unit A Brownsville, TX | 2.0 | 2.0 | 1200 | $1,450 | $1.21 | 45d | 1 | 1.00mi |
| 11 Country Club Rd Brownsville, TX | 2.0 | 2.0 | 1200 | $1,600 | $1.33 | 23d | 1 | 1.01mi |
| 2393 McAllen Rd Unit D1-7 Brownsville, TX | 2.0 | 1.5 | 1040 | $1,400 | $1.35 | 23d | 1 | 1.04mi |
| 801 Tropical Dr Unit 3 Brownsville, TX | 2.0 | 1.5 | 1000 | $1,500 | $1.50 | 45d | 1 | 1.11mi |
| 1617 E Los Ebanos Blvd Brownsville, TX | 3.0 | 2.0 | 1179 | $1,900 | $1.61 | 23d | 1 | 1.14mi |
| 184 Stars Ave Unit 7 Brownsville, TX | 3.0 | 2.0 | 1450 | $1,900 | $1.31 | 23d | 1 | 1.16mi |
| 1618 E Los Ebanos Blvd Brownsville, TX | 3.0 | 2.0 | 1073 | $1,700 | $1.58 | 45d | 1 | 1.16mi |
| 42 Fairway Dr Brownsville, TX | 2.0 | 2.0 | 1300 | $2,500 | $1.92 | 23d | 1 | 1.19mi |
| 1604 Yale Ave Brownsville, TX | 3.0 | 1.0 | 1316 | $1,800 | $1.37 | 23d | 1 | 1.21mi |
| 1405 Harvard Ave Brownsville, TX | 3.0 | 2.0 | 1426 | $1,700 | $1.19 | 45d | 1 | 1.22mi |
| 605 Paredes Line Rd Brownsville, TX | 2.0 | 1.5 | 900 | $875 | $0.97 | 45d | 1 | 1.34mi |
| 1904 Central Blvd Brownsville, TX | 1.0–3.0 | 1.0–2.0 | 1046 | $888 | $0.85 | 45d | 9 | 1.34mi |
| 2700 Farm to Market Road 802 Brownsville, TX | 1.0–3.0 | 1.0–2.0 | 990 | $1,658 | $1.67 | 15d | 8 | 1.35mi |
| 1653 W San Marcelo Blvd Brownsville, TX | 3.0 | 2.0 | 1212 | $1,700 | $1.40 | 23d | 1 | 1.48mi |
| 3055 El Paso Rd Unit H-1 Brownsville, TX | 2.0 | 2.0 | 900 | $1,050 | $1.17 | 45d | 1 | 1.49mi |
HOA detail condo
- Monthly dues
- $0 · $0/yr
- Assessments
- None detected in remarks — confirm with the listing agent.
Listing history 25 events
-
2026-06-22days on market $129,000 Active 27 DOM
-
2026-06-18days on market $129,000 Active 24 DOM
-
2026-06-17days on market $129,000 Active 23 DOM
-
2026-06-16days on market $129,000 Active 22 DOM
-
2026-06-15days on market $129,000 Active 21 DOM
-
2026-06-14days on market $129,000 Active 19 DOM
-
2026-06-13days on market $129,000 Active 18 DOM
-
2026-06-10days on market $129,000 Active 16 DOM
-
2026-06-09days on market $129,000 Active 15 DOM
-
2026-06-08days on market $129,000 Active 14 DOM
-
2026-06-07days on market $129,000 Active 13 DOM
-
2026-06-05days on market $129,000 Active 10 DOM
-
2026-06-03days on market $129,000 Active 9 DOM
-
2026-06-02days on market $129,000 Active 8 DOM
-
2026-06-01days on market $129,000 Active 7 DOM
-
2026-05-31days on market $129,000 Active 6 DOM
-
2026-05-30days on market $129,000 Active 5 DOM
-
2026-05-22$129,000 Active
-
2024-10-18soldstatus Closed 96-char remark
Show marketing remark (96 chars)
NICE UNIT BEING RENTED 2 bed 1 bath remodeled. GOOD FOR AN INVESTOR RENT at the moment is $1100.
-
2024-09-26status Pending 96-char remark
Show marketing remark (96 chars)
NICE UNIT BEING RENTED 2 bed 1 bath remodeled. GOOD FOR AN INVESTOR RENT at the moment is $1100.
-
2024-09-17price $109,000 96-char remark
Show marketing remark (96 chars)
NICE UNIT BEING RENTED 2 bed 1 bath remodeled. GOOD FOR AN INVESTOR RENT at the moment is $1100.
-
2024-09-10price $113,000 96-char remark
Show marketing remark (96 chars)
NICE UNIT BEING RENTED 2 bed 1 bath remodeled. GOOD FOR AN INVESTOR RENT at the moment is $1100.
-
2024-08-08$115,000 Active 96-char remark
Show marketing remark (96 chars)
NICE UNIT BEING RENTED 2 bed 1 bath remodeled. GOOD FOR AN INVESTOR RENT at the moment is $1100.
-
2022-02-18soldstatus 127-char remark
Show marketing remark (127 chars)
Must see this beautiful condo, fully updated. Excellent location, closed to shopping centers, walking distance to Sunrise Mall.
-
2021-12-29$108,000 127-char remark
Show marketing remark (127 chars)
Must see this beautiful condo, fully updated. Excellent location, closed to shopping centers, walking distance to Sunrise Mall.
ⓘ Source: listings_history table (triggers on properties + properties_extension) + one-shot
backfill from property_details.listing_events for pre-trigger history.
Climate risk First Street
- Flood 1/10 Low FEMA zone X (unshaded) · 0% chance over 30 yrs
- Wildfire 1/10 Low
- Heat 9/10 Extreme 7 d/yr ≥110°F today · 25 d/yr by 30 yrs out
- Wind 9/10 Extreme 99% chance of damaging wind over 30 yrs
- Air quality 3/10 Moderate 2 unhealthy d/yr today · 3 by 30 yrs out
Nearby sold comps map
Loading sold comps map…
Walkable amenities ~0.75 mi
Loading nearby amenities…
Taxation est. · year 1
- Rental income
- $17,593
- − Mortgage interest
- −$7,226
- − Property taxes
- −$1,935
- − Insurance
- −$645
- − Repairs & maintenance
- −$1,407
- − Management
- −$1,407
- − HOA
- −$3,624
- − Depreciation
- −$3,753
- Taxable loss
- −$2,404
- Est. tax savings @ 24.0%
- +$577
- After-tax cash flow
- $154/yr
For passive investors: Depreciation is non-cash, so a rental often shows a tax loss while cash-flowing — sheltering income. Rental losses are passive: they offset passive income freely, and up to $25,000/yr can offset ordinary (W-2) income if you actively participate and your MAGI is under $100k (phasing out to $0 by $150k); unused losses carry forward. On sale, claimed depreciation is recaptured at up to 25%, and gains may owe capital-gains tax (a 1031 exchange can defer both). Figures are a year-1 estimate at your 24.0% rate — not tax advice; consult a CPA.
Condition & rehab AI · 1 photo
This 2-bedroom, 1-bath condo requires significant repairs and maintenance to improve its condition and value. Immediate attention to the exterior siding, interior walls, and landscaping is recommended.
Repairs flagged
- Major exterior siding — Severe weathering and peeling
- Major interior walls — Significant peeling paint
- Major landscaping — Overgrown bushes need trimming
Value-add opportunities
- Both paint interior walls — Fresh paint enhances curb appeal and interior aesthetics
- Both trim landscaping — Well-maintained landscaping improves curb appeal and property value
- Both repair exterior siding — Fresh siding and paint improve the home's appearance and value
Renovation cost estimate screening
| Repair item | Severity | Est. cost |
|---|---|---|
| exterior siding · Severe weathering and peeling | Major | $15,000–50,000 |
| interior walls · Significant peeling paint | Major | $15,000–50,000 |
| landscaping · Overgrown bushes need trimming | Major | $15,000–50,000 |
| Total estimated repair cost · 3 items | $45,000–150,000 |
Value-add ROI direction
- Both paint interior walls — Fresh paint enhances curb appeal and interior aesthetics ↑
- Both trim landscaping — Well-maintained landscaping improves curb appeal and property value ↑
- Both repair exterior siding — Fresh siding and paint improve the home's appearance and value ↑
ⓘ Cost ranges are severity-bucket heuristics (US national rule-of-thumb). Get contractor quotes + a written scope before underwriting a rehab budget.
Schools (NCES district)
- District
- Brownsville ISD
- NCES district ID
- 4811680
- Math proficiency
- 20% ▼ -36.00%
- Reading proficiency
- 34% ▼ -13.00%
- Median HH income
- $30,490
- Composite
- 21.8/100
- National rank
- #8249
- State rank
- #710 of 826 in TX
Livability — Brownsville
- Score
- 79/100
- State rank
- #62
- US rank
- #2311
Category grades
Schools grade is shown separately in the Schools card above.
Census & demographics
- Census place
- Brownsville, TX
- County
- Cameron County · 310,734 people
- City population
- 212,132
- Metro
- Brownsville-Harlingen, TX
- Population (ZIP)
- 87,380
- Household income
- $44,509
- Rent vs Own
- Severe rent burden
- 2682.0
Population outlook (Cameron County) Hauer SSP2
- Today (2025)
- 441,603 people
- By 2030
- 448,113 · +1.5%
- By 2040
- 456,385 · +3.3%
- By 2050
- 456,294 · +3.3%
- By 2075
- 423,851 · -4.0%
- By 2100
- 342,787 · -22.4%
Race, ethnicity, and origin ACS 2023
- Neighborhood character
- Predominantly Hispanic (97%)
- Race & ethnicity
- Hispanic / Latino 97% Two or more races 45% White 3%
- Hispanic origin (detail)
- Mexican 91%
- Foreign-born
- 30% · Canada
- Languages at home
- 12% English-only · Spanish 88%
Political lean MEDSL · Cameron
- 2024 margin
- Lean R (+5.8) · D 46.7% · R 52.5%
- 2008→2024 swing
- -34.6pp toward R · 2008: 28.8pp · 2024: -5.8pp
- All cycles
- 2024: R+5.8 2020: D+13.2 2016: D+32.5 2012: D+32.4 2008: D+28.8
Not yet ingested
- Civics
- —
Market trends
- HPI YoY
- ▼ -81.45%
- Current HPI
- 232.1072
- Rent YoY
- ▲ 8.19%
- Metro
- Brownsville-Harlingen, TX
- State GDP YoY
- ▲ 3.95%
- F500 in state
- 110
Industry mix (Fortune 500 HQ in TX)
| Industry | F500 HQs | Revenue |
|---|---|---|
| Energy | 16 | $1,198B |
|
||
| Technology | 5 | $198B |
|
||
| Engineering / Construction | 4 | $72B |
|
||
| Energy Services | 3 | $60B |
|
||
| Utilities | 3 | $41B |
|
||
| Healthcare | 2 | $330B |
|
||
Price history
+19.4% since first listed8 events — show timeline
- 2026-05-22 Listed $129,000 RGVMLS
- 2024-10-18 Sold (MLS) — RGVMLS
- 2024-09-26 Pending — RGVMLS
- 2024-09-17 Price Changed $109,000 RGVMLS
- 2024-09-10 Price Changed $113,000 RGVMLS
- 2024-08-08 Listed $115,000 RGVMLS
- 2022-02-18 Sold (MLS) — RGVMLS
- 2021-12-29 Listed $108,000 RGVMLS
Cash-flow waterfall
monthlySold comps — $/sqft
last 12 mo · ≤1 miLoading sold comps…