16 Elm St · Philmont, NY
Flood risk 4/10 · Minor
- FEMA flood zone
- —
- Chance of flooding over 30 yrs
- 0.22%
- Est. flood insurance / yr
- —
Fire risk 5/10 · Moderate
- Est. fire insurance / yr
- $691 – $1,283
Heat risk 3/10 · Minor
- Hot days now (above 95°F)
- 7 days/yr
- Hot days in 30 yrs
- 17 days/yr
Wind risk 4/10 · Minor
- Chance of severe wind over 30 yrs
- 9.0%
Air-quality risk 2/10 · Minimal
- Unhealthy air days now
- 1 days/yr
- Unhealthy air days in 30 yrs
- 2 days/yr
Risk factors via First Street. Map © Google.
Why this score? — see what drove the B grade
The composite is a weighted blend of 9 inputs, each scored 0–100. Each bar is that input's sub-score; the figure is the points it added to the 100-point composite (weight × sub-score).
- Cash flow +30.0/30.0
- 1% rule +10.0/10.0
- DSCR +10.0/10.0
- ARV discount +7.5/15.0
- Appreciation +4.6/10.0
- Schools +4.5/10.0
- Livability +3.0/5.0
- Rent growth +2.5/5.0
- Condition / age +1.0/5.0
$110,000
🖨 Deal sheet 📄 Offer letter ✓ Due diligence
Listing remarks MLS
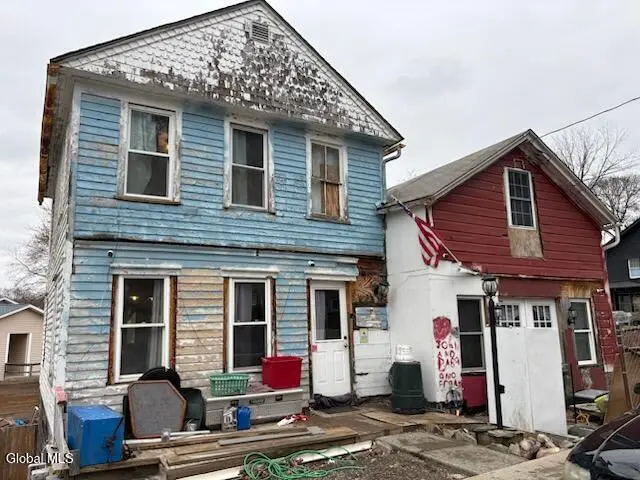
Excellent investment opportunity! Create your own vision with this versatile property located in the heart of Philmont historic mill district. Currently configured as a three bedroom three bath home with custom two story primary bedroom. Lots of the hard work is done including new electric and plumbing that awaits your customization. Large family friendly backyard ready to be reimagined. There is long term value here for the savvy cash buyer. Close to the Taconic State parkway, historic Hudson, the Berkshires and only two hours to NYC.
Key facts
- Close to berkshires
- Two hours to nyc
- 0.34 acre lot
Tags
Neighborhood map
What this means for you Summary
Snapshot
- This is a 3-bed/2.5-bath single-family listed at $110k. Condition is rated poor.
Deal economics
- At list price, monthly cash flow is $820 ($10k/yr) — positive.
- The deal already cash-flows at list — no discount required.
- Meets the 1% rule at list price ($2k rent vs $110k).
- Recommended offer: $103k (6.0% below list) — sets the bar for market timing.
Location & tenants
- Location reads 60/100 on livability (#958 in NY) — a middle-class / working-renter tenant base. Strengths: housing A+, cost of living B; Watch: schools F, crime F, amenities F.
- Taconic Hills Central School District (rural): math 53% / reading 51% proficiency, ranked #335 of 590 in NY (top 57%) — acceptable for families but not a draw, mixed tenant base, ~2y average lease.
- Market conditions: 12 active listings in the ZIP; 1 comparable units currently listed for rent nearby; 136 units permitted in Columbia County in 2024 (0 in 5+ unit buildings).
Forward outlook
- Local home prices are declining (-0.8%/yr); year-one equity from $761 of loan paydown is wiped out by about $872 of value loss. Plan a longer hold.
- Columbia County population projected at -22% by 2050 — secular population decline; favor cash flow + early exit over multi-decade hold.
- At projected returns (-0.8% appreciation + 3.0% rent growth), your $31k cash investment doubles in ~3 years — after that, you're playing with house money.
Negotiation context
- It's been on market 88 days — a 6% lower offer ($103k) is reasonable based on typical stale-listing flexibility.
- 2 sale attempts; this cycle's ask has dropped $20k (15%) from the opening price — seller is motivated, your offer sets the floor, not the list.
Risks & watch-outs
- Watch-outs: built in 1893 — expect roof / HVAC / electrical / plumbing capex.
- Climate carrying-cost: moderate wildfire risk — expect insurance premiums to compound above CPI over the hold.
Questions for the listing agent
- It's been on market 88 days. Have you received any prior offers? Is the seller open to a 6% concession, seller financing, or rate buy-down credit?
- Have any recent inspections been done? Can we get a copy of the seller's disclosures and any deferred-maintenance estimates?
- Built in 1893 — when were the roof, HVAC, electrical panel, plumbing, and water heater last replaced?
- Why hasn't it sold? Are there any deal-killer items the seller is aware of (foundation, flood, title, zoning, code violations)?
- Is there a deadline driving the sale (1031 exchange, divorce, estate, relocation)? That informs how much negotiation room exists.
- Schools are F-rated, which usually means shorter tenancies and higher turnover. Who's the typical renter profile here, and what's been the actual vacancy rate?
- Crime grade is F in this area — have there been break-ins, vandalism, or insurance claims at this property in the last 3 years? What carrier currently insures it and at what premium?
- What's the average days-on-market for RENTAL listings here right now (not sales)? A rising rental-DOM trend means longer vacancies and softer asking-rent achievability than the comps imply.
- What's the recent tenant-quality profile in this submarket — average credit score on applications, eviction rate, late-payment / NSF rate, and stable-employment percentage? A property-management company in the area should have these aggregated.
- How much new for-sale + rental construction is in the pipeline within 1–3 miles? Heavy new supply typically softens prices + rents 12–24 months out; constrained supply supports both.
Investment metrics
- 1% rule
- 1.82% ✓
- Cap rate
- 15.24%
- Cash-on-cash
- 31.94%
- DSCR
- 2.42
- GRM
- 4.6
CMA / ARV
- ARV (median comp)
- $358,613
- List price
- $110,000
- Delta
- -69.33%
- Verdict
- UNDERPRICED
- Comps
- 20 within 1.0 mi
Show comp detail 9 sales within ~0.75 mi
| Address | Dist | Beds/Ba | Sqft | Sold | Price | $/sf | Match |
|---|---|---|---|---|---|---|---|
| 28 Summit St | 0.11mi | 3/1.5 | 1,475 (-0%) | 22mo | $630,000 | $427 | 72 |
| 176 Main St | 0.49mi | 3/1.0 | 1,504 (+2%) | 6mo | $290,000 | $193 | 64 |
| 47 Summit St | 0.28mi | 3/1.5 | 1,300 (-12%) | 7mo | $437,500 | $337 | 57 |
| 47 Summit St | 0.29mi | 3/1.5 | 1,300 (-12%) | 7mo | $437,500 | $337 | 57 |
| 47 Summit Street St | 0.29mi | 3/1.5 | 1,300 (-12%) | 7mo | $437,500 | $337 | 57 |
| 1090 Route 217 | 0.26mi | 3/2.0 | 1,382 (-7%) | 23mo | $600,000 | $434 | 56 |
| 763 Route 217 | 0.69mi | 2/2.0 (-1) | 1,426 (-4%) | 3mo | $165,000 | $116 | 52 |
| 438 Route 217 | 0.64mi | 4/2.0 (+1) | 1,400 (-5%) | 8mo | $325,000 | $232 | 47 |
| 24 Highland Ave | 0.39mi | 2/1.0 (-1) | 1,320 (-11%) | 7mo | $254,900 | $193 | 47 |
Match score weights: distance 35% · size 25% · config 20% · recency 20%. Top-matched comps best support the ARV.
Projected returns pro-forma
-0.79% appreciation · 3.0% rent growth · sell at horizon
- IRR
- 31.1%
- Equity multiple
- 2.46×
- Total profit
- $44,994
- Equity at exit
- $27,651
- IRR
- 35.6%
- Equity multiple
- 4.78×
- Total profit
- $116,572
- Equity at exit
- $29,982
Cash invested: $30,800 (down + closing). Projections, not guarantees.
Landlord ↔ Tenant lean methodology
- Overall (STATE)
- 15 Strongly Tenant-Friendly
- State New York
- 15 Strongly Tenant-Friendly · D+10
- County
- — inherits STATE
- City
- — inherits STATE
ZIP-level market 12565
- Home prices YoY
- -0.2%
- Active inventory
- 12
- Price-to-rent
- 4.6×
Monthly cashflow live
- Estimated rent
- $2,000 medium interval (Pro) →
- Mortgage (P&I)
- −$577
- Tax est. 1.5%
- −$138 /mo · $1,650/yr
- Insurance
- −$46
- HOA
- −$0
- Vacancy / Maint / Mgmt
- −$420
- Net cashflow
- $820
Break-even live
UW: 25.0% down · 7.5% · 30yr · 1.5% tax · 5.0% vac · 8.0% maint · 8.0% mgmt
Financing live
Cash to close
- Down payment
- $27,500
- Closing costs
- $3,300
- Reserves months
- —
- Total cash needed
- —
Loan-product check · same deal, 3 products live
Conventional
25% down · 7.5% · 30yr
- Down + closing
- —
- Monthly P&I
- —
- Monthly cashflow
- —
- DSCR
- —
- Eligible?
- —
Personal DTI + credit; lowest rate.
DSCR
20% down · 8.5% · 30yr
- Down + closing
- —
- Monthly P&I
- —
- Monthly cashflow
- —
- DSCR
- —
- Eligible?
- —
No personal income docs; deal must DSCR.
Hard money
10% down · 12.0% · 12mo
- Down + closing
- —
- Monthly P&I
- —
- Monthly cashflow
- —
- DSCR
- —
- Eligible?
- —
Short-term bridge; refi at stabilization.
Rent comps 1 comps
| Address | Beds | Baths | Sqft | Rent | $/sqft | DOM | Units | Dist |
|---|---|---|---|---|---|---|---|---|
| 129 Main St Unit 3 Philmont, NY | 2.0 | 1.0 | 1000 | $2,000 | $2.00 | 43d | 1 | 0.15mi |
Listing history 20 events
-
2026-06-19days on market $110,000 Active 88 DOM
-
2026-06-18days on market $110,000 Active 87 DOM
-
2026-06-17days on market $110,000 Active 86 DOM
-
2026-06-16days on market $110,000 Active 85 DOM
-
2026-06-15days on market $110,000 Active 84 DOM
-
2026-06-14days on market $110,000 Active 82 DOM
-
2026-06-12days on market $110,000 Active 81 DOM
-
2026-06-09days on market $110,000 Active 78 DOM
-
2026-06-08days on market $110,000 Active 77 DOM
-
2026-06-07days on market $110,000 Active 76 DOM
-
2026-06-07days on market $110,000 Active 75 DOM
-
2026-06-04days on market $110,000 Active 72 DOM
-
2026-06-02days on market $110,000 Active 71 DOM
-
2026-06-01days on market $110,000 Active 70 DOM
-
2026-05-31days on market $110,000 Active 69 DOM
-
2026-05-31days on market $110,000 Active 68 DOM
-
2026-05-06price $110,000 542-char remark
Show marketing remark (541 chars)
Excellent investment opportunity! Create your own vision with this versatile property located in the heart of Philmont historic mill district. Currently configured as a three bedroom three bath home with custom two story primary bedroom. Lots of the hard work is done including new electric and plumbing that awaits your customization. Large family friendly backyard ready to be reimagined. There is long term value here for the savvy cash buyer. Close to the Taconic State parkway, historic Hudson, the Berkshires and only two hours to NYC.
-
2026-05-06price $110,000 541-char remark
Show marketing remark (541 chars)
Excellent investment opportunity! Create your own vision with this versatile property located in the heart of Philmont historic mill district. Currently configured as a three bedroom three bath home with custom two story primary bedroom. Lots of the hard work is done including new electric and plumbing that awaits your customization. Large family friendly backyard ready to be reimagined. There is long term value here for the savvy cash buyer. Close to the Taconic State parkway, historic Hudson, the Berkshires and only two hours to NYC.
-
2026-03-23$130,000 Active 542-char remark
Show marketing remark (541 chars)
Excellent investment opportunity! Create your own vision with this versatile property located in the heart of Philmont historic mill district. Currently configured as a three bedroom three bath home with custom two story primary bedroom. Lots of the hard work is done including new electric and plumbing that awaits your customization. Large family friendly backyard ready to be reimagined. There is long term value here for the savvy cash buyer. Close to the Taconic State parkway, historic Hudson, the Berkshires and only two hours to NYC.
-
2026-03-23$130,000 Active 541-char remark
Show marketing remark (541 chars)
Excellent investment opportunity! Create your own vision with this versatile property located in the heart of Philmont historic mill district. Currently configured as a three bedroom three bath home with custom two story primary bedroom. Lots of the hard work is done including new electric and plumbing that awaits your customization. Large family friendly backyard ready to be reimagined. There is long term value here for the savvy cash buyer. Close to the Taconic State parkway, historic Hudson, the Berkshires and only two hours to NYC.
ⓘ Source: listings_history table (triggers on properties + properties_extension) + one-shot
backfill from property_details.listing_events for pre-trigger history.
Climate risk First Street
- Flood 4/10 Moderate 22% chance over 30 yrs
- Wildfire 5/10 Major
- Heat 3/10 Moderate 7 d/yr ≥95°F today · 17 d/yr by 30 yrs out
- Wind 4/10 Moderate 9% chance of damaging wind over 30 yrs
- Air quality 2/10 Low 1 unhealthy d/yr today · 2 by 30 yrs out
Nearby sold comps map
Loading sold comps map…
Walkable amenities ~0.75 mi
Loading nearby amenities…
Taxation est. · year 1
- Rental income
- $24,000
- − Mortgage interest
- −$6,162
- − Property taxes
- −$1,650
- − Insurance
- −$550
- − Repairs & maintenance
- −$1,920
- − Management
- −$1,920
- − Depreciation
- −$3,200
- Taxable income
- $8,598
- Est. tax owed @ 24.0%
- −$2,064
- After-tax cash flow
- $7,774/yr
For passive investors: Depreciation is non-cash, so a rental often shows a tax loss while cash-flowing — sheltering income. Rental losses are passive: they offset passive income freely, and up to $25,000/yr can offset ordinary (W-2) income if you actively participate and your MAGI is under $100k (phasing out to $0 by $150k); unused losses carry forward. On sale, claimed depreciation is recaptured at up to 25%, and gains may owe capital-gains tax (a 1031 exchange can defer both). Figures are a year-1 estimate at your 24.0% rate — not tax advice; consult a CPA.
Condition & rehab AI · 13 photos
This property requires extensive renovations to bring it up to modern standards, significantly impacting its resale and rental value.
Repairs flagged
- Major kitchen cabinets — severely damaged
- Major bathroom fixtures — severely damaged
- Major roof — visible wear and tear
- Major exterior siding — weathered and exposed
- Major flooring — damaged wood
- Major interior walls — peeling paint and exposed wood
- Major plumbing — visible issues
- Major electrical — visible issues
Value-add opportunities
- Resale new kitchen cabinets and countertops — modernizing the kitchen
- Resale new bathroom fixtures and tiling — modernizing the bathrooms
- Resale new roof and siding — improving the exterior appearance
- Resale new flooring and paint — improving the interior appearance
- Resale new plumbing and electrical — addressing critical issues
Renovation cost estimate screening
| Repair item | Severity | Est. cost |
|---|---|---|
| kitchen cabinets · severely damaged | Major | $15,000–50,000 |
| bathroom fixtures · severely damaged | Major | $15,000–50,000 |
| roof · visible wear and tear | Major | $15,000–50,000 |
| exterior siding · weathered and exposed | Major | $15,000–50,000 |
| flooring · damaged wood | Major | $15,000–50,000 |
| interior walls · peeling paint and exposed wood | Major | $15,000–50,000 |
| plumbing · visible issues | Major | $15,000–50,000 |
| electrical · visible issues | Major | $15,000–50,000 |
| Total estimated repair cost · 8 items | $120,000–400,000 |
Value-add ROI direction
- Resale new kitchen cabinets and countertops — modernizing the kitchen ↑
- Resale new bathroom fixtures and tiling — modernizing the bathrooms ↑
- Resale new roof and siding — improving the exterior appearance ↑
- Resale new flooring and paint — improving the interior appearance ↑
- Resale new plumbing and electrical — addressing critical issues ↑
ⓘ Cost ranges are severity-bucket heuristics (US national rule-of-thumb). Get contractor quotes + a written scope before underwriting a rehab budget.
Schools (NCES district)
- District
- Taconic Hills Central School District
- NCES district ID
- 3628620
- Math proficiency
- 53% ▲ 10.00%
- Reading proficiency
- 51% ▲ 11.00%
- Median HH income
- $57,329
- Composite
- 45.16/100
- National rank
- #2676
- State rank
- #335 of 590 in NY
Livability — Philmont
- Score
- 60/100
- State rank
- #958
- US rank
- #18780
Category grades
Schools grade is shown separately in the Schools card above.
Census & demographics
- Census place
- Philmont, NY
- City population
- 1,575
- Population (ZIP)
- 1,575
Population outlook (Columbia County) Hauer SSP2
- Today (2025)
- 58,662 people
- By 2030
- 56,557 · -3.6%
- By 2040
- 51,324 · -12.5%
- By 2050
- 45,790 · -21.9%
- By 2075
- 35,232 · -39.9%
- By 2100
- 25,846 · -55.9%
Race, ethnicity, and origin ACS 2023
- Neighborhood character
- Predominantly White (79%)
- Race & ethnicity
- White 79% Black 15% Hispanic / Latino 4% Two or more races 4%
- Common ancestry
- Slovak 5% Iranian 4% Romanian 3%
- Foreign-born
- 10% · Canada
Political lean MEDSL · Columbia
- 2024 margin
- D (+14.7) · D 57.4% · R 42.6%
- 2008→2024 swing
- +1.3pp toward D · 2008: 13.4pp · 2024: 14.7pp
- All cycles
- 2024: D+14.7 2020: D+16.7 2016: D+1.4 2012: D+11.7 2008: D+13.4
Not yet ingested
- Civics
- —
Market trends
- HPI YoY
- ▼ -0.79%
- Current HPI
- 377.9813
- Rent YoY
- —
- Metro
- —
- State GDP YoY
- ▲ 2.60%
- F500 in state
- 92
Industry mix (Fortune 500 HQ in NY)
| Industry | F500 HQs | Revenue |
|---|---|---|
| Financial Services | 10 | $950B |
|
||
| Consumer Goods | 9 | $162B |
|
||
| Insurance | 4 | $225B |
|
||
| Telecommunications | 2 | $144B |
|
||
| Pharmaceuticals | 2 | $112B |
|
||
| Media / Entertainment | 2 | $69B |
|
||
Price history
-15.4% since first listed4 events — show timeline
- 2026-05-06 Price Changed $110,000 HVCRMLS
- 2026-05-06 Price Changed $110,000 Global MLS
- 2026-03-23 Listed $130,000 HVCRMLS
- 2026-03-23 Listed $130,000 Global MLS
Cash-flow waterfall
monthlySold comps — $/sqft
last 12 mo · ≤1 miLoading sold comps…