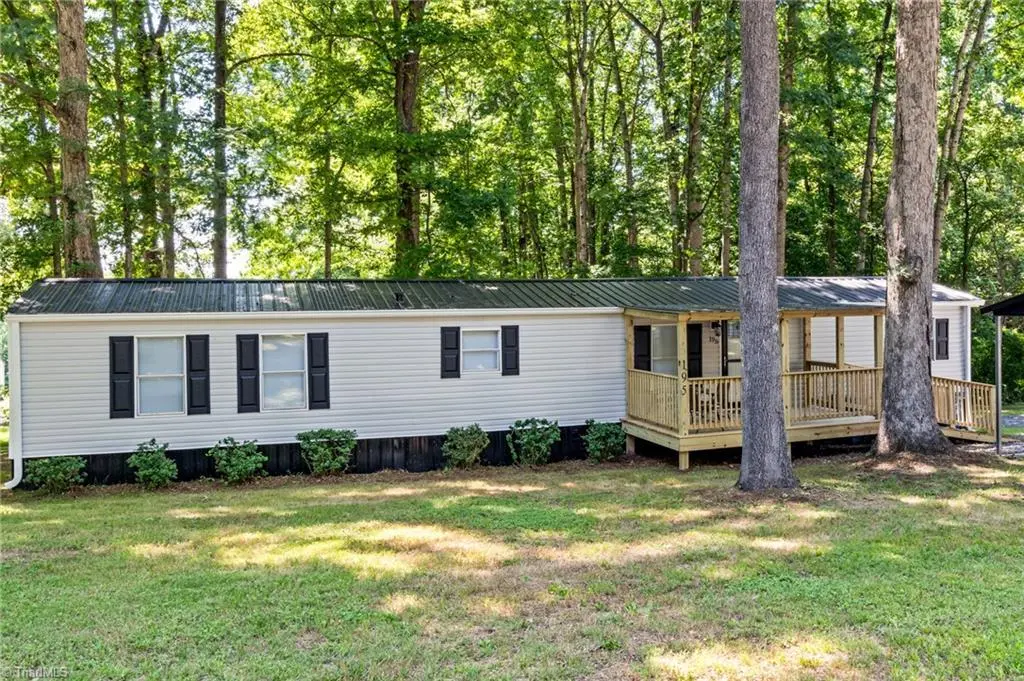
195 Sonora Dr · Advance, NC
Flood risk 1/10 · Minimal
- FEMA flood zone
- X (unshaded)
- Chance of flooding over 30 yrs
- 0.0%
- Est. flood insurance / yr
- $507 – $1,088
Fire risk 4/10 · Minor
- Est. fire insurance / yr
- $906 – $1,684
Heat risk 5/10 · Moderate
- Hot days now (above 103°F)
- 7 days/yr
- Hot days in 30 yrs
- 17 days/yr
Wind risk 4/10 · Minor
- Chance of severe wind over 30 yrs
- 8.0%
Air-quality risk 2/10 · Minimal
- Unhealthy air days now
- 1 days/yr
- Unhealthy air days in 30 yrs
- 2 days/yr
Risk factors via First Street. Map © Google.
Why this score? — see what drove the C+ grade
The composite is a weighted blend of 9 inputs, each scored 0–100. Each bar is that input's sub-score; the figure is the points it added to the 100-point composite (weight × sub-score).
- Cash flow +30.0/30.0
- DSCR +10.0/10.0
- 1% rule +8.6/10.0
- Schools +4.4/10.0
- Livability +3.4/5.0
- Rent growth +2.5/5.0
- Condition / age +2.5/5.0
- ARV discount +0.0/15.0
- Appreciation +0.0/10.0
$136,500
🖨 Deal sheet (PDF) 📄 Offer letter ✓ Due diligence
Listing remarks MLS
Take a look at this updated 3 bedroom home with modern touches located in Advance. Welcome to theis beautifully renovated 3 bedroom, 2 bath single wide home nestled on .33 acres in the heart of Advance. Step inside to find modern touches throughout, including fresh paint, stylish fixtures, and lvp flooring throughout that flows seamlessly through the main living areas. Primary suite on the main level. Cash buyers only. Schedule your showing today!
Key facts
- Tin roof
- Lvp flooring
- New back porch
Tags
Property features AI
Finance
- HOA & community: No homeowners association; Subdivision: Laquinta
Exterior
- Parking: Detached carport; Carport; Driveway; Gravel parking; 2 garage/carport spaces
- Security: Smoke detector(s)
- Utilities: Public water; Septic tank; Electric water heater; Electric power
- Home design: Manufactured home (single wide); One level; Built in 1994; Existing structure
- Construction: Vinyl siding
- Exterior features: Accessible approach with ramp; Public maintained road
Interior
- Kitchen: Microwave; Dishwasher; Range; Cooktop
- Bedrooms: Primary bedroom on main level
- Flooring: Vinyl flooring
- Bathrooms: 2 full bathrooms
- Heating & cooling: Heat pump for heating and cooling; Electric heating
- Interior features: Primary bedroom on main level; Deadbolt(s); Solid surface counters; Vaulted ceiling(s); Insulated doors and storm doors; Storm windows
- Laundry & utility: Washer hookup; Dryer connection; Laundry on main level; Electric water heater
Neighborhood map
What this means for you Summary
Snapshot
- This is a 3-bed/2.0-bath manufactured listed at $136k.
Deal economics
- At list price, monthly cash flow is $524 ($6k/yr) — positive.
- The deal already cash-flows at list — no discount required.
- Meets the 1% rule at list price ($2k rent vs $136k).
- Cap rate 10.9% vs local median 2.3% in Advance — top-decile yield for the area; either an underpriced asset or a hidden risk that comps aren't pricing in. Stress-test before assuming the spread holds.
Location & tenants
- Location reads 67/100 on livability (#215 in NC) — a middle-class / working-renter tenant base. Strengths: crime A+, employment A+, housing A+; Watch: amenities F, commute F, health & safety F.
- Davie County Schools (rural): math 51% / reading 52% proficiency, ranked #57 of 178 in NC (top 32%) — acceptable for families but not a draw, mixed tenant base, ~2y average lease.
- Zoned schools: Shady Grove Elementary (math 66% / reading 73%, grade A-, #95 of 1,410 statewide, top 7%, 514 students, 23% FRL); William Ellis Middle (math 48% / reading 59%, grade C+, #87 of 475 statewide, top 19%, 452 students, 31% FRL); Davie County High (math 62% / reading 62%, grade B-, #184 of 535 statewide, top 37%, 1,770 students, 42% FRL).
- Market conditions: 142 active listings in the ZIP; solid renter incomes; 250 units permitted in Davie County in 2024 (65 in 5+ unit buildings).
Forward outlook
- Local home prices are declining (-3.0%/yr); year-one equity from $944 of loan paydown is wiped out by about $4k of value loss. Plan a longer hold.
- Davie County population projected to shrink 5% by 2050 — rents likely to lag national; underwrite the cash flow, not the appreciation.
- At projected returns (-3.0% appreciation + 3.0% rent growth), your $38k cash investment doubles in ~8 years — after that, you're playing with house money.
Negotiation context
- Only 12 days on market — expect competitive offers; lowballing is unlikely to land.
- 2 sale attempts with the ask held roughly flat each time — persistent listings suggest the price (not the market) is what's stuck; bring a comps-based counter.
- Current owner paid $118k; 15% above their basis — modest negotiation headroom, anchor on the comps not their cost.
Risks & watch-outs
- Climate carrying-cost: extreme-heat days projected 7→17/yr by 2055 (HVAC capex compounding) — expect insurance premiums to compound above CPI over the hold.
Questions for the listing agent
- Is there a deadline driving the sale (1031 exchange, divorce, estate, relocation)? That informs how much negotiation room exists.
- What's the average days-on-market for RENTAL listings here right now (not sales)? A rising rental-DOM trend means longer vacancies and softer asking-rent achievability than the comps imply.
- What's the recent tenant-quality profile in this submarket — average credit score on applications, eviction rate, late-payment / NSF rate, and stable-employment percentage? A property-management company in the area should have these aggregated.
- How much new for-sale + rental construction is in the pipeline within 1–3 miles? Heavy new supply typically softens prices + rents 12–24 months out; constrained supply supports both.
Investment metrics
- 1% rule
- 1.36% ✓
- Cap rate
- 10.90%
- Cash-on-cash
- 16.44%
- DSCR
- 1.73
- GRM
- 6.1
CMA / ARV
- ARV (on-the-fly)
- $113,230
- Comps found
- 3
Show comp detail 3 sales within ~0.75 mi
| Address | Dist | Beds/Ba | Sqft | Sold | Price | $/sf | Match |
|---|---|---|---|---|---|---|---|
| 195 Sonora Dr | 0.00mi | 3/2.0 | 821 (-3%) | 2mo | $118,500 | $144 | 93 |
| 205 Casa Bella Dr | 0.07mi | 3/2.0 | 971 (+15%) | 6mo | $130,000 | $134 | 67 |
| 166 La Quinta Dr | 0.42mi | 2/2.0 (-1) | 952 (+13%) | 7mo | $58,000 | $61 | 49 |
Match score weights: distance 35% · size 25% · config 20% · recency 20%. Top-matched comps best support the ARV.
Projected returns pro-forma
-3.0% appreciation · 3.0% rent growth · sell at horizon
- IRR
- 7.5%
- Equity multiple
- 1.29×
- Total profit
- $11,259
- Equity at exit
- $20,353
- IRR
- 16.8%
- Equity multiple
- 2.38×
- Total profit
- $52,862
- Equity at exit
- $11,802
Cash invested: $38,220 (down + closing). Projections, not guarantees.
Landlord ↔ Tenant lean methodology
- Overall (STATE)
- 85 Strongly Landlord-Friendly
- State North Carolina
- 85 Strongly Landlord-Friendly · R+3
- County
- — inherits STATE
- City
- — inherits STATE
ZIP-level market 27006
- Home prices YoY
- -32.4%
- Active inventory
- 142
- Price-to-rent
- 6.1×
Monthly cashflow live
- Estimated rent
- $1,857 medium interval (Pro) →
- Mortgage (P&I)
- −$716
- Tax est. 1.5%
- −$171 /mo · $2,048/yr
- Insurance
- −$57
- HOA
- −$0
- Vacancy / Maint / Mgmt
- −$390
- Net cashflow
- $524
Break-even live
Sensitivity live
| Price | -10% $618 | -5% $571 | +0% $524 | +5% $476 | +10% $429 |
|---|---|---|---|---|---|
| Rent | -10% $377 | -5% $450 | +0% $524 | +5% $597 | +10% $670 |
| Rate | -1.0pp $592 | -0.5pp $558 | base $524 | +0.5pp $488 | +1.0pp $452 |
UW: 25.0% down · 7.5% · 30yr · 1.5% tax · 5.0% vac · 8.0% maint · 8.0% mgmt
Financing live
Cash to close
- Down payment
- $34,125
- Closing costs
- $4,095
- Reserves months
- —
- Total cash needed
- —
Loan-product check · same deal, 3 products live
Conventional
25% down · 7.5% · 30yr
- Down + closing
- —
- Monthly P&I
- —
- Monthly cashflow
- —
- DSCR
- —
- Eligible?
- —
Personal DTI + credit; lowest rate.
DSCR
20% down · 8.5% · 30yr
- Down + closing
- —
- Monthly P&I
- —
- Monthly cashflow
- —
- DSCR
- —
- Eligible?
- —
No personal income docs; deal must DSCR.
Hard money
10% down · 12.0% · 12mo
- Down + closing
- —
- Monthly P&I
- —
- Monthly cashflow
- —
- DSCR
- —
- Eligible?
- —
Short-term bridge; refi at stabilization.
Listing history 8 events
-
2026-06-22days on market $136,500 Active 12 DOM
-
2026-06-18days on market $136,500 Active 9 DOM
-
2026-06-17days on market $136,500 Active 8 DOM
-
2026-06-16days on market $136,500 Active 7 DOM
-
2026-06-15days on market $136,500 Active 6 DOM
-
2026-06-14days on market $136,500 Active 4 DOM
-
2026-06-10remarks 648-char remark
-
2026-06-10$136,500 Active 1 DOM
ⓘ Source: listings_history table (triggers on properties + properties_extension) + one-shot
backfill from property_details.listing_events for pre-trigger history.
Climate risk First Street
- Flood 1/10 Low FEMA zone X (unshaded) · 0% chance over 30 yrs
- Wildfire 4/10 Moderate
- Heat 5/10 Major 7 d/yr ≥103°F today · 17 d/yr by 30 yrs out
- Wind 4/10 Moderate 8% chance of damaging wind over 30 yrs
- Air quality 2/10 Low 1 unhealthy d/yr today · 2 by 30 yrs out
Nearby sold comps map
Loading sold comps map…
Walkable amenities ~0.75 mi
Loading nearby amenities…
Taxation est. · year 1
- Rental income
- $22,283
- − Mortgage interest
- −$7,646
- − Property taxes
- −$2,048
- − Insurance
- −$682
- − Repairs & maintenance
- −$1,783
- − Management
- −$1,783
- − Depreciation
- −$3,971
- Taxable income
- $4,371
- Est. tax owed @ 24.0%
- −$1,049
- After-tax cash flow
- $5,235/yr
For passive investors: Depreciation is non-cash, so a rental often shows a tax loss while cash-flowing — sheltering income. Rental losses are passive: they offset passive income freely, and up to $25,000/yr can offset ordinary (W-2) income if you actively participate and your MAGI is under $100k (phasing out to $0 by $150k); unused losses carry forward. On sale, claimed depreciation is recaptured at up to 25%, and gains may owe capital-gains tax (a 1031 exchange can defer both). Figures are a year-1 estimate at your 24.0% rate — not tax advice; consult a CPA.
Schools (NCES district)
- District
- Davie County Schools
- NCES district ID
- 3701170
- Math proficiency
- 51% ▲ 2.00%
- Reading proficiency
- 52% ▲ 2.00%
- Median HH income
- $51,331
- Composite
- 44.16/100
- National rank
- #2860
- State rank
- #57 of 178 in NC
Livability — Advance
- Score
- 67/100
- State rank
- #215
- US rank
- #10250
Category grades
Schools grade is shown separately in the Schools card above.
Census & demographics
- County
- Davie County · 42,813 people
- City population
- 16,247
- Metro
- Winston-Salem, NC
- Population (ZIP)
- 16,247
- Household income
- $96,580
- Rent vs Own
- Severe rent burden
- 68.0
Population outlook (Davie County) Hauer SSP2
- Today (2025)
- 42,613 people
- By 2030
- 42,691 · +0.2%
- By 2040
- 42,137 · -1.1%
- By 2050
- 40,445 · -5.1%
- By 2075
- 35,939 · -15.7%
- By 2100
- 29,103 · -31.7%
Race, ethnicity, and origin ACS 2023
- Neighborhood character
- Predominantly White (88%)
- Race & ethnicity
- White 88% Black 3% Hispanic / Latino 3% Two or more races 3% Asian 1%
- Common ancestry
- Slovak 4% Serbian 3% Romanian 2%
- Foreign-born
- 5% · Canada, Vietnam
- Languages at home
- 95% English-only · Spanish 3% Other Indo-European 1%
Political lean MEDSL · Davie
- 2024 margin
- Solid R (+46.5) · D 26.2% · R 72.6% · Other 1.2%
- 2008→2024 swing
- -8.2pp toward R · 2008: -38.3pp · 2024: -46.5pp
- All cycles
- 2024: R+46.5 2020: R+45.5 2016: R+48.1 2012: R+43.7 2008: R+38.3
Not yet ingested
- Civics
- —
Market trends
- HPI YoY
- ▼ -85.92%
- Current HPI
- 179.445
- Rent YoY
- —
- Metro
- Winston-Salem, NC
- State GDP YoY
- ▲ 3.28%
- F500 in state
- 26
Industry mix (Fortune 500 HQ in NC)
| Industry | F500 HQs | Revenue |
|---|---|---|
| Financial Services | 2 | $213B |
|
||
| Retail | 2 | $95B |
|
||
| Industrial Conglomerate | 1 | $38B |
|
||
| Metals / Steel | 1 | $35B |
|
||
| Utilities | 1 | $30B |
|
||
| Industrial Machinery | 1 | $19B |
|
||
Price history
+0.0% since first listed6 events — show timeline
- 2026-06-09 Listed $136,500 Triad MLS
- 2026-04-15 Sold (Public Records) $118,500 Public Records
- 2026-04-15 Sold (MLS) $118,500 Triad MLS
- 2026-04-11 Pending — Triad MLS
- 2026-04-01 Contingent — Triad MLS
- 2026-01-22 Listed $136,500 Triad MLS
Property tax history
+4.4%/yrLatest (2025): $157 · +35.6% YoY. Source: county tax records.
Cash-flow waterfall
monthlySold comps — $/sqft
last 12 mo · ≤1 miLoading sold comps…