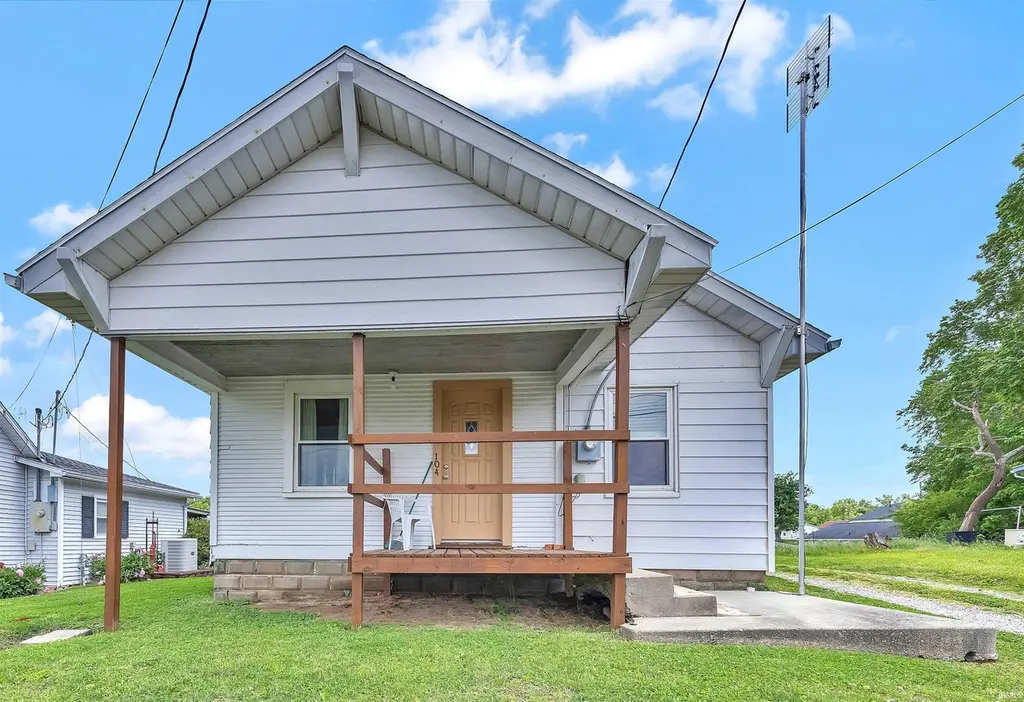
104 S Division St · Francisco, IN
Flood risk 1/10 · Minimal
- FEMA flood zone
- X (unshaded)
- Chance of flooding over 30 yrs
- 0.0%
- Est. flood insurance / yr
- $507 – $1,088
Fire risk 1/10 · Minimal
- Est. fire insurance / yr
- $717 – $1,331
Heat risk 5/10 · Moderate
- Hot days now (above 107°F)
- 7 days/yr
- Hot days in 30 yrs
- 19 days/yr
Wind risk 2/10 · Minimal
- Chance of severe wind over 30 yrs
- 3.0%
Air-quality risk 3/10 · Minor
- Unhealthy air days now
- 2 days/yr
- Unhealthy air days in 30 yrs
- 4 days/yr
Risk factors via First Street. Map © Google.
Why this score? — see what drove the A- grade
The composite is a weighted blend of 9 inputs, each scored 0–100. Each bar is that input's sub-score; the figure is the points it added to the 100-point composite (weight × sub-score).
- Cash flow +29.2/30.0
- ARV discount +15.0/15.0
- DSCR +10.0/10.0
- Appreciation +9.2/10.0
- 1% rule +6.8/10.0
- Schools +3.2/10.0
- Livability +3.2/5.0
- Rent growth +2.5/5.0
- Condition / age +2.5/5.0
$77,000
🖨 Deal sheet 📄 Offer letter ✓ Due diligence
Listing remarks
Cozy and cute 2-bedroom, 1-bath home offering 832 square feet, perfect for a starter home, downsizing, or an investment opportunity. Inside, you’ll find a spacious living room and an adorable retro kitchen full of character, featuring unique wallpaper, a breakfast bar, and an included appliance suite with refrigerator, electric range, and microwave. Both bedrooms offer comfortable space, and the home also includes a washer and dryer for added convenience. This home has a welcoming feel and is ready for its next owner.
Key facts
- Washer and dryer
- Retro kitchen
- Breakfast bar
Tags
Property features AI
Finance
- Other: Property listed with RE/MAX REVOLUTION
- Financial info: Financial details not provided
- HOA & community: No subdivision
Exterior
- Parking: Parking details not provided
- Security: Security details not provided
- Utilities: Public water; Public sewer
- Home design: Single-family site-built home; One story
- Construction: Vinyl siding; Built with site-built construction
- Exterior features: Level lot; Outbuilding on the property
Interior
- Kitchen: Kitchen details not provided
- Bedrooms: Bedrooms information not provided
- Flooring: Flooring details not provided
- Bathrooms: One full bathroom (main level)
- Heating & cooling: Central air conditioning; Forced air heating
- Interior features: Crawl space basement; Total of 5 rooms
- Laundry & utility: Laundry located on the main level
Neighborhood map
What this means for you Summary
Snapshot
- This is a 2-bed/1.0-bath single-family listed at $77k.
Deal economics
- At list price, monthly cash flow is $268 ($3k/yr) — positive.
- The deal already cash-flows at list — no discount required.
- Meets the 1% rule at list price ($909 rent vs $77k).
- Recommended offer: $75k (3.0% below list) — sets the bar for market timing.
Location & tenants
- Location reads 63/100 on livability (#425 in IN) — a middle-class / working-renter tenant base. Strengths: cost of living A+, housing A+; Watch: crime C-, amenities F, commute F.
- East Gibson School Corporation (town): math 40% / reading 35% proficiency, ranked #171 of 301 in IN (top 57%) — families likely to look elsewhere, expect single-tenant / working-renter base with shorter leases.
- Zoned schools: Waldo J Wood Memorial Jhs (math 27% / reading 32%, grade F, #212 of 330 statewide, top 67%, 119 students, 60% FRL); Waldo J Wood Memorial High (math 34% / reading 44%, grade F, #221 of 369 statewide, top 63%, 212 students, 37% FRL).
- Market conditions: 5 active listings in the ZIP; 167 units permitted in Gibson County in 2024 (68 in 5+ unit buildings).
Forward outlook
- In year one you build about $7k of equity ($532 loan paydown + $6k appreciation (8.4% local appreciation)).
- Gibson County population projected to shrink 10% by 2050 — rents likely to lag national; underwrite the cash flow, not the appreciation.
- At projected returns (8.4% appreciation + 3.0% rent growth), your $22k cash investment doubles in ~3 years — after that, you're playing with house money.
- By year 5, paydown + projected appreciation supports a ~$32k cash-out refi (75% LTV) — recoverable capital for the next deal without selling this one.
Negotiation context
- It's been on market 31 days — a 3% lower offer ($75k) is reasonable based on typical stale-listing flexibility.
- 2 sale attempts with the ask held roughly flat each time — persistent listings suggest the price (not the market) is what's stuck; bring a comps-based counter.
Risks & watch-outs
- Watch-outs: built in 1925 — expect roof / HVAC / electrical / plumbing capex.
- Climate carrying-cost: extreme-heat days projected 7→19/yr by 2055 (HVAC capex compounding) — expect insurance premiums to compound above CPI over the hold.
Questions for the listing agent
- It's been on market 31 days. Have you received any prior offers? Is the seller open to a 3% concession, seller financing, or rate buy-down credit?
- Built in 1925 — when were the roof, HVAC, electrical panel, plumbing, and water heater last replaced?
- Is there a deadline driving the sale (1031 exchange, divorce, estate, relocation)? That informs how much negotiation room exists.
- What's the average days-on-market for RENTAL listings here right now (not sales)? A rising rental-DOM trend means longer vacancies and softer asking-rent achievability than the comps imply.
- What's the recent tenant-quality profile in this submarket — average credit score on applications, eviction rate, late-payment / NSF rate, and stable-employment percentage? A property-management company in the area should have these aggregated.
- How much new for-sale + rental construction is in the pipeline within 1–3 miles? Heavy new supply typically softens prices + rents 12–24 months out; constrained supply supports both.
Investment metrics
- 1% rule
- 1.18% ✓
- Cap rate
- 10.47%
- Cash-on-cash
- 14.92%
- DSCR
- 1.66
- GRM
- 7.1
CMA / ARV
- ARV (median comp)
- $99,007
- List price
- $77,000
- Delta
- -22.23%
- Verdict
- UNDERPRICED
- Comps
- 10 within 1.0 mi
Show comp detail 2 sales within ~0.75 mi
| Address | Dist | Beds/Ba | Sqft | Sold | Price | $/sf | Match |
|---|---|---|---|---|---|---|---|
| 705 W School St | 0.37mi | 2/1.0 | 768 (-8%) | 10mo | $135,000 | $176 | 62 |
| 105 N Second St | 0.20mi | 2/1.0 | 940 (+13%) | 13mo | $140,000 | $149 | 59 |
Match score weights: distance 35% · size 25% · config 20% · recency 20%. Top-matched comps best support the ARV.
Projected returns pro-forma
8.42% appreciation · 3.0% rent growth · sell at horizon
- IRR
- 32.4%
- Equity multiple
- 3.36×
- Total profit
- $50,826
- Equity at exit
- $60,696
- IRR
- 28.6%
- Equity multiple
- 7.25×
- Total profit
- $134,838
- Equity at exit
- $122,640
Cash invested: $21,560 (down + closing). Projections, not guarantees.
Landlord ↔ Tenant lean methodology
- Overall (STATE)
- 90 Strongly Landlord-Friendly
- State Indiana
- 90 Strongly Landlord-Friendly · R+11
- County
- — inherits STATE
- City
- — inherits STATE
ZIP-level market 47649
- Home prices YoY
- 4.3%
- Active inventory
- 5
- Price-to-rent
- 7.1×
Monthly cashflow live
- Estimated rent
- $909 medium interval (Pro) →
- Mortgage (P&I)
- −$404
- Tax from tax record
- −$14 /mo · $170/yr
- Insurance
- −$32
- HOA
- −$0
- Vacancy / Maint / Mgmt
- −$191
- Net cashflow
- $268
Break-even live
UW: 25.0% down · 7.5% · 30yr · 1.5% tax · 5.0% vac · 8.0% maint · 8.0% mgmt
Financing live
Cash to close
- Down payment
- $19,250
- Closing costs
- $2,310
- Reserves months
- —
- Total cash needed
- —
Loan-product check · same deal, 3 products live
Conventional
25% down · 7.5% · 30yr
- Down + closing
- —
- Monthly P&I
- —
- Monthly cashflow
- —
- DSCR
- —
- Eligible?
- —
Personal DTI + credit; lowest rate.
DSCR
20% down · 8.5% · 30yr
- Down + closing
- —
- Monthly P&I
- —
- Monthly cashflow
- —
- DSCR
- —
- Eligible?
- —
No personal income docs; deal must DSCR.
Hard money
10% down · 12.0% · 12mo
- Down + closing
- —
- Monthly P&I
- —
- Monthly cashflow
- —
- DSCR
- —
- Eligible?
- —
Short-term bridge; refi at stabilization.
Listing history 17 events
-
2026-06-18days on market $77,000 Active 31 DOM
-
2026-06-17days on market $77,000 Active 30 DOM
-
2026-06-16days on market $77,000 Active 29 DOM
-
2026-06-15days on market $77,000 Active 28 DOM
-
2026-06-13days on market $77,000 Active 26 DOM
-
2026-06-12days on market $77,000 Active 25 DOM
-
2026-06-09days on market $77,000 Active 22 DOM
-
2026-06-08days on market $77,000 Active 21 DOM
-
2026-06-07days on market $77,000 Active 20 DOM
-
2026-06-07days on market $77,000 Active 19 DOM
-
2026-06-04days on market $77,000 Active 16 DOM
-
2026-06-02days on market $77,000 Active 15 DOM
-
2026-06-01days on market $77,000 Active 14 DOM
-
2026-05-31days on market $77,000 Active 13 DOM
-
2026-05-31days on market $77,000 Active 12 DOM
-
2026-05-08status Pending 529-char remark
-
2026-05-04$77,000 Active 529-char remark
ⓘ Source: listings_history table (triggers on properties + properties_extension) + one-shot
backfill from property_details.listing_events for pre-trigger history.
Tax reassessment forecast IN · Partial reset (capped growth)
- Current annual tax
- $170 · $14/mo
- Projected year-2 tax
- $412 · $34/mo
- Expected delta
- +$242/yr (+$20/mo · 142.2%)
ⓘ Screening estimate from a state-policy table — verify with the county assessor before closing.
Climate risk First Street
- Flood 1/10 Low FEMA zone X (unshaded) · 0% chance over 30 yrs
- Wildfire 1/10 Low
- Heat 5/10 Major 7 d/yr ≥107°F today · 19 d/yr by 30 yrs out
- Wind 2/10 Low 3% chance of damaging wind over 30 yrs
- Air quality 3/10 Moderate 2 unhealthy d/yr today · 4 by 30 yrs out
Nearby sold comps map
Loading sold comps map…
Walkable amenities ~0.75 mi
Loading nearby amenities…
Taxation est. · year 1
- Rental income
- $10,909
- − Mortgage interest
- −$4,313
- − Property taxes
- −$170
- − Insurance
- −$385
- − Repairs & maintenance
- −$873
- − Management
- −$873
- − Depreciation
- −$2,240
- Taxable income
- $2,055
- Est. tax owed @ 24.0%
- −$493
- After-tax cash flow
- $2,724/yr
For passive investors: Depreciation is non-cash, so a rental often shows a tax loss while cash-flowing — sheltering income. Rental losses are passive: they offset passive income freely, and up to $25,000/yr can offset ordinary (W-2) income if you actively participate and your MAGI is under $100k (phasing out to $0 by $150k); unused losses carry forward. On sale, claimed depreciation is recaptured at up to 25%, and gains may owe capital-gains tax (a 1031 exchange can defer both). Figures are a year-1 estimate at your 24.0% rate — not tax advice; consult a CPA.
Schools (NCES district)
- District
- East Gibson School Corporation
- NCES district ID
- 1802940
- Math proficiency
- 40% ▼ -5.00%
- Reading proficiency
- 35% ▼ -6.00%
- Median HH income
- $42,426
- Composite
- 31.73/100
- National rank
- #5908
- State rank
- #171 of 301 in IN
Livability — Francisco
- Score
- 63/100
- State rank
- #425
- US rank
- #15327
Category grades
Schools grade is shown separately in the Schools card above.
Census & demographics
- Census place
- Francisco, IN
- Population (ZIP)
- 1,310
Population outlook (Gibson County) Hauer SSP2
- Today (2025)
- 33,671 people
- By 2030
- 33,409 · -0.8%
- By 2040
- 32,364 · -3.9%
- By 2050
- 30,453 · -9.6%
- By 2075
- 24,610 · -26.9%
- By 2100
- 16,217 · -51.8%
Race, ethnicity, and origin ACS 2023
- Neighborhood character
- Predominantly White (94%)
- Race & ethnicity
- White 94% Two or more races 2% Black 2%
- Common ancestry
- Serbian 2% Italian 1% Iranian 1%
- Languages at home
- 99% English-only · German/W. Germanic 1%
Political lean MEDSL · Gibson
- 2024 margin
- Solid R (+51.4) · D 23.4% · R 74.8% · Other 1.8%
- 2008→2024 swing
- -38.2pp toward R · 2008: -13.2pp · 2024: -51.4pp
- All cycles
- 2024: R+51.4 2020: R+48.2 2016: R+47.6 2012: R+31.0 2008: R+13.2
Not yet ingested
- Civics
- —
Market trends
- HPI YoY
- ▲ 8.42%
- Current HPI
- 205.2718
- Rent YoY
- —
- Metro
- —
- State GDP YoY
- ▲ 2.90%
- F500 in state
- 18
Industry mix (Fortune 500 HQ in IN)
| Industry | F500 HQs | Revenue |
|---|---|---|
| Industrial Machinery | 2 | $37B |
|
||
| Healthcare | 1 | $177B |
|
||
| Pharmaceuticals | 1 | $45B |
|
||
| Metals / Steel | 1 | $18B |
|
||
| Agriculture | 1 | $17B |
|
||
| Packaging | 1 | $12B |
|
||
Price history
3 events — show timeline
- 2026-05-21 Relisted — IRMLS
- 2026-05-08 Pending — IRMLS
- 2026-05-04 Listed $77,000 IRMLS
Property tax history
+2.5%/yrLatest (2020): $170 · +7.1% YoY. Source: county tax records.
Cash-flow waterfall
monthlySold comps — $/sqft
last 12 mo · ≤1 miLoading sold comps…