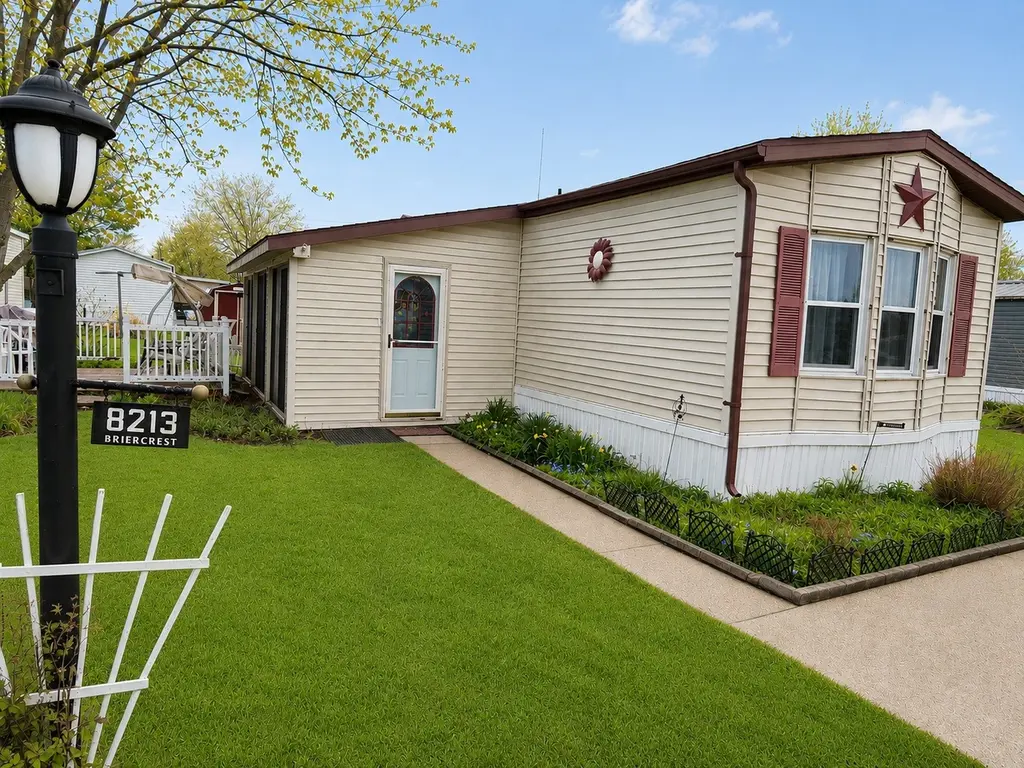
8213 Briercrest St · Erie, PA
Flood risk 6/10 · Moderate
- FEMA flood zone
- X (unshaded)
- Chance of flooding over 30 yrs
- 0.54%
- Est. flood insurance / yr
- $473 – $860
Fire risk 1/10 · Minimal
- Est. fire insurance / yr
- $511 – $949
Heat risk 1/10 · Minimal
- Hot days now (above 88°F)
- 7 days/yr
- Hot days in 30 yrs
- 18 days/yr
Wind risk 1/10 · Minimal
- Chance of severe wind over 30 yrs
- —
Air-quality risk 2/10 · Minimal
- Unhealthy air days now
- 1 days/yr
- Unhealthy air days in 30 yrs
- 3 days/yr
Risk factors via First Street. Map © Google.
Why this score? — see what drove the D- grade
The composite is a weighted blend of 9 inputs, each scored 0–100. Each bar is that input's sub-score; the figure is the points it added to the 100-point composite (weight × sub-score).
- ARV discount +15.0/15.0
- 1% rule +10.0/10.0
- Schools +5.1/10.0
- Livability +4.2/5.0
- Rent growth +2.5/5.0
- Condition / age +2.5/5.0
- Cash flow +0.0/30.0
- DSCR +0.0/10.0
- Appreciation +0.0/10.0
$40,000
🖨 Deal sheet (PDF) 📄 Offer letter ✓ Due diligence
Listing remarks MLS
Wonderfully kept mobile home. Nice sized living room, eat-in applianced kitchen with lots of cabinetry, master bedroom with full bath, washer & dryer included, newer roof, hot water tank, mostly newer windows, storage shed, vaulted sunroom with sliding doors to deck. Affordable priced in this 55+ community.
Key facts
- Open floor plan
- Lots of cabinets
- Cathedral ceilings
Tags
Property features AI
Finance
- HOA & community: Homeowners association with monthly fee of $670; HOA fee includes sewer and trash
Exterior
- Utilities: Public water; Public sewer; Cable available
- Home design: Single-family residence; Residential property
- Construction: Aluminum siding; Composition roof
- Exterior features: Deck; Shed(s)
Interior
- Kitchen: Dishwasher; Gas oven; Gas range; Refrigerator
- Flooring: Carpet
- Bathrooms: 2 full bathrooms
- Heating & cooling: Central air; Ceiling fans; Forced air heating
- Interior features: Ceiling fans; Window coverings and drapes; Storage
- Laundry & utility: Washer; Dryer
Neighborhood map
What this means for you Summary
Snapshot
- This is a 2-bed/2.0-bath manufactured listed at $40k.
Deal economics
- At list price, monthly cash flow is $-234 ($-3k/yr) — negative.
- To cash-flow at today's rent, offer at most $2k (94.1% below list).
- Meets the 1% rule at list price ($869 rent vs $40k).
- Recommended offer: $2k (94.1% below list) — sets the bar for cash-flow.
- Cap rate -0.7% vs local median 5.4% in Erie — below-typical yield; the buyer is paying a premium for something (appreciation thesis, condition, location) that the cap rate doesn't capture.
Location & tenants
- Location reads 83/100 on livability (#109 in PA, #840 nationally) — a professional / high-income tenant draw. Strengths: amenities A+, commute A+, cost of living A+; Watch: crime D+, employment F.
- Fort Leboeuf SD (rural): math 52% / reading 68% proficiency, ranked #77 of 539 in PA (top 14%) — acceptable for families but not a draw, mixed tenant base, ~2y average lease.
- Zoned schools: Robison El Sch (math 77% / reading 82%, grade A, #49 of 1,518 statewide, top 4%, 381 students, 40% FRL); Fort Leboeuf Ms (math 38% / reading 63%, grade C, #125 of 512 statewide, top 25%, 473 students, 46% FRL); Fort Leboeuf Shs (math 72% / reading 50%, grade C+, #77 of 437 statewide, top 17%, 663 students, 45% FRL).
- Market conditions: 120 active listings in the ZIP; 364 units permitted in Erie County in 2024 (188 in 5+ unit buildings).
- This rent is only 15% of the median local income ($69k/yr) — well below the 30% rent-burden line; pricing power to push rent on renewal without tenant pushback.
Forward outlook
- Local home prices are declining (-3.0%/yr); year-one equity from $277 of loan paydown is wiped out by about $1k of value loss. Plan a longer hold.
- Erie County population projected at -14% by 2050 — secular population decline; favor cash flow + early exit over multi-decade hold.
Negotiation context
- It's been on market 36 days — a 3% lower offer ($39k) is reasonable based on typical stale-listing flexibility.
- 2 sale attempts since 2y ago with the ask held roughly flat each time — persistent listings suggest the price (not the market) is what's stuck; bring a comps-based counter.
Risks & watch-outs
- Watch-outs: HOA is 77% of rent.
- Climate carrying-cost: major flood risk — expect insurance premiums to compound above CPI over the hold.
Questions for the listing agent
- What do current leases actually rent for vs. the listed asking? Can we see a recent rent roll and the last 12 months of T-12 income?
- It's been on market 36 days. Have you received any prior offers? Is the seller open to a 94% concession, seller financing, or rate buy-down credit?
- What does the HOA fee cover, when was the last increase, and are there any pending special assessments or reserve-fund shortfalls?
- Is there a deadline driving the sale (1031 exchange, divorce, estate, relocation)? That informs how much negotiation room exists.
- Crime grade is D in this area — have there been break-ins, vandalism, or insurance claims at this property in the last 3 years? What carrier currently insures it and at what premium?
- The area grade is low — what's the realistic commute time and amenity access for the typical tenant pool here? Any planned neighborhood developments (good or bad) we should know about?
- What's the average days-on-market for RENTAL listings here right now (not sales)? A rising rental-DOM trend means longer vacancies and softer asking-rent achievability than the comps imply.
- What's the recent tenant-quality profile in this submarket — average credit score on applications, eviction rate, late-payment / NSF rate, and stable-employment percentage? A property-management company in the area should have these aggregated.
- How much new for-sale + rental construction is in the pipeline within 1–3 miles? Heavy new supply typically softens prices + rents 12–24 months out; constrained supply supports both.
Investment metrics
- 1% rule
- 2.17% ✓
- Cap rate
- -0.73%
- Cash-on-cash
- -25.08%
- DSCR
- -0.12
- GRM
- 3.8
CMA / ARV
- ARV (median comp)
- $48,421
- List price
- $40,000
- Delta
- -17.39%
- Verdict
- UNDERPRICED
- Comps
- 20 within 1.0 mi
Show comp detail 1 sale within ~0.75 mi
| Address | Dist | Beds/Ba | Sqft | Sold | Price | $/sf | Match |
|---|---|---|---|---|---|---|---|
| 1865 Northwood Ln | 0.13mi | 2/2.0 | 960 (-2%) | 12mo | $63,000 | $66 | 80 |
Match score weights: distance 35% · size 25% · config 20% · recency 20%. Top-matched comps best support the ARV.
Projected returns pro-forma
-3.0% appreciation · 3.0% rent growth · sell at horizon
- IRR
- -69.0%
- Equity multiple
- -0.87×
- Total profit
- $-20,979
- Equity at exit
- $5,964
- IRR
- —
- Equity multiple
- -2.20×
- Total profit
- $-35,801
- Equity at exit
- $3,458
Cash invested: $11,200 (down + closing). Projections, not guarantees.
Landlord ↔ Tenant lean methodology
- Overall (STATE)
- 62 Landlord-Friendly
- State Pennsylvania
- 62 Landlord-Friendly · EVEN
- County
- — inherits STATE
- City
- — inherits STATE
ZIP-level market 16509
- Home prices YoY
- -30.7%
- Active inventory
- 120
- Price-to-rent
- 3.8×
Monthly cashflow live
- Estimated rent
- $869 medium interval (Pro) →
- Mortgage (P&I)
- −$210
- Tax from tax record
- −$24 /mo · $287/yr
- Insurance
- −$17
- HOA
- −$670
- Lot rent leased land?
- −$0
- Vacancy / Maint / Mgmt
- −$182
- Net cashflow
- $-234
Break-even live
Sensitivity live
| Price | -10% $-211 | -5% $-223 | +0% $-234 | +5% $-245 | +10% $-257 |
|---|---|---|---|---|---|
| Rent | -10% $-303 | -5% $-268 | +0% $-234 | +5% $-200 | +10% $-165 |
| Rate | -1.0pp $-214 | -0.5pp $-224 | base $-234 | +0.5pp $-244 | +1.0pp $-255 |
UW: 25.0% down · 7.5% · 30yr · 1.5% tax · 5.0% vac · 8.0% maint · 8.0% mgmt
Financing live
Cash to close
- Down payment
- $10,000
- Closing costs
- $1,200
- Reserves months
- —
- Total cash needed
- —
Loan-product check · same deal, 3 products live
Conventional
25% down · 7.5% · 30yr
- Down + closing
- —
- Monthly P&I
- —
- Monthly cashflow
- —
- DSCR
- —
- Eligible?
- —
Personal DTI + credit; lowest rate.
DSCR
20% down · 8.5% · 30yr
- Down + closing
- —
- Monthly P&I
- —
- Monthly cashflow
- —
- DSCR
- —
- Eligible?
- —
No personal income docs; deal must DSCR.
Hard money
10% down · 12.0% · 12mo
- Down + closing
- —
- Monthly P&I
- —
- Monthly cashflow
- —
- DSCR
- —
- Eligible?
- —
Short-term bridge; refi at stabilization.
HOA detail
- Monthly dues
- $670 · $8,040/yr
- Likely covers
- water
Listing history 18 events
-
2026-06-15status $40,000 Pending 36 DOM
-
2026-06-15days on market $40,000 Active 36 DOM
-
2026-06-14days on market $40,000 Active 34 DOM
-
2026-06-13days on market $40,000 Active 33 DOM
-
2026-06-10days on market $40,000 Active 31 DOM
-
2026-06-09days on market $40,000 Active 30 DOM
-
2026-06-08days on market $40,000 Active 29 DOM
-
2026-06-07days on market $40,000 Active 28 DOM
-
2026-06-02days on market $40,000 Active 23 DOM
-
2026-06-01days on market $40,000 Active 22 DOM
-
2026-05-31days on market $40,000 Active 21 DOM
-
2026-05-30days on market $40,000 Active 20 DOM
-
2026-05-08$40,000 Active 510-char remark
-
2025-06-10soldstatus $36,000 Closed 314-char remark
Show marketing remark (314 chars)
Wonderfully kept mobile home. Nice sized living room, eat-in applianced kitchen with lots of cabinetry, master bedroom with full bath, washer & dryer included, newer roof, hot water tank, mostly newer windows, storage shed, vaulted sunroom with sliding doors to deck. Affordable priced in this 55+ community.
-
2025-04-09status Pending 314-char remark
Show marketing remark (314 chars)
Wonderfully kept mobile home. Nice sized living room, eat-in applianced kitchen with lots of cabinetry, master bedroom with full bath, washer & dryer included, newer roof, hot water tank, mostly newer windows, storage shed, vaulted sunroom with sliding doors to deck. Affordable priced in this 55+ community.
-
2024-10-26price $41,500 314-char remark
Show marketing remark (314 chars)
Wonderfully kept mobile home. Nice sized living room, eat-in applianced kitchen with lots of cabinetry, master bedroom with full bath, washer & dryer included, newer roof, hot water tank, mostly newer windows, storage shed, vaulted sunroom with sliding doors to deck. Affordable priced in this 55+ community.
-
2024-09-30price $42,800 314-char remark
Show marketing remark (314 chars)
Wonderfully kept mobile home. Nice sized living room, eat-in applianced kitchen with lots of cabinetry, master bedroom with full bath, washer & dryer included, newer roof, hot water tank, mostly newer windows, storage shed, vaulted sunroom with sliding doors to deck. Affordable priced in this 55+ community.
-
2024-08-23$46,900 Active 314-char remark
Show marketing remark (314 chars)
Wonderfully kept mobile home. Nice sized living room, eat-in applianced kitchen with lots of cabinetry, master bedroom with full bath, washer & dryer included, newer roof, hot water tank, mostly newer windows, storage shed, vaulted sunroom with sliding doors to deck. Affordable priced in this 55+ community.
ⓘ Source: listings_history table (triggers on properties + properties_extension) + one-shot
backfill from property_details.listing_events for pre-trigger history.
Tax reassessment forecast PA · Partial reset (capped growth)
- Current annual tax
- $287 · $24/mo
- Projected year-2 tax
- $460 · $38/mo
- Expected delta
- +$172/yr (+$14/mo · 60.0%)
ⓘ Screening estimate from a state-policy table — verify with the county assessor before closing.
Climate risk First Street
- Flood 6/10 Major FEMA zone X (unshaded) · 54% chance over 30 yrs
- Wildfire 1/10 Low
- Heat 1/10 Low 7 d/yr ≥88°F today · 18 d/yr by 30 yrs out
- Wind 1/10 Low
- Air quality 2/10 Low 1 unhealthy d/yr today · 3 by 30 yrs out
Nearby sold comps map
Loading sold comps map…
Walkable amenities ~0.75 mi
Loading nearby amenities…
Taxation est. · year 1
- Rental income
- $10,425
- − Mortgage interest
- −$2,241
- − Property taxes
- −$287
- − Insurance
- −$200
- − Repairs & maintenance
- −$834
- − Management
- −$834
- − HOA
- −$8,040
- − Depreciation
- −$1,164
- Taxable loss
- −$3,174
- Est. tax savings @ 24.0%
- +$762
- After-tax cash flow
- $-2,047/yr
For passive investors: Depreciation is non-cash, so a rental often shows a tax loss while cash-flowing — sheltering income. Rental losses are passive: they offset passive income freely, and up to $25,000/yr can offset ordinary (W-2) income if you actively participate and your MAGI is under $100k (phasing out to $0 by $150k); unused losses carry forward. On sale, claimed depreciation is recaptured at up to 25%, and gains may owe capital-gains tax (a 1031 exchange can defer both). Figures are a year-1 estimate at your 24.0% rate — not tax advice; consult a CPA.
Schools (NCES district)
- District
- Fort Leboeuf SD
- NCES district ID
- 4209990
- Math proficiency
- 52% ▼ -12.00%
- Reading proficiency
- 68% ▼ -6.00%
- Median HH income
- $54,607
- Composite
- 51.46/100
- National rank
- #1725
- State rank
- #77 of 539 in PA
Livability — Erie
- Score
- 83/100
- State rank
- #109
- US rank
- #840
Category grades
Schools grade is shown separately in the Schools card above.
Census & demographics
- County
- Erie County · 92,215 people
- City population
- 92,215
- Metro
- Erie, PA
- Population (ZIP)
- 28,595
- Household income
- $68,846
- Rent vs Own
- Severe rent burden
- 870.0
Population outlook (Erie County) Hauer SSP2
- Today (2025)
- 272,159 people
- By 2030
- 266,299 · -2.2%
- By 2040
- 250,987 · -7.8%
- By 2050
- 234,925 · -13.7%
- By 2075
- 199,164 · -26.8%
- By 2100
- 162,985 · -40.1%
Race, ethnicity, and origin ACS 2023
- Neighborhood character
- Predominantly White (87%)
- Race & ethnicity
- White 87% Two or more races 6% Black 4% Hispanic / Latino 3% Asian 1%
- Common ancestry
- Romanian 14% Slovak 4% Scotch-Irish 2%
- Foreign-born
- 6% · Canada
- Languages at home
- 92% English-only · Russian/Polish/Slavic 3% German/W. Germanic 1% Spanish 1%
Political lean MEDSL · Erie
- 2024 margin
- Toss-up / Even · D 49.0% · R 50.0%
- 2008→2024 swing
- -20.9pp toward R · 2008: 19.9pp · 2024: -1.0pp
- All cycles
- 2024: R+1.0 2020: D+1.0 2016: R+2.0 2012: D+16.9 2008: D+19.9
Not yet ingested
- Civics
- —
Market trends
- HPI YoY
- ▼ -106.54%
- Current HPI
- 240.361
- Rent YoY
- —
- Metro
- Erie, PA
- State GDP YoY
- ▲ 1.68%
- F500 in state
- 34
Industry mix (Fortune 500 HQ in PA)
| Industry | F500 HQs | Revenue |
|---|---|---|
| Healthcare | 2 | $309B |
|
||
| Insurance | 2 | $27B |
|
||
| Telecommunications / Media | 1 | $124B |
|
||
| Industrial Distribution | 1 | $22B |
|
||
| Financial Services | 1 | $20B |
|
||
| Chemicals / Materials | 1 | $18B |
|
||
Price history
-14.7% since first listed7 events — show timeline
- 2026-06-15 Pending — GEBOR
- 2026-05-08 Listed $40,000 GEBOR
- 2025-06-10 Sold (MLS) $36,000 GEBOR
- 2025-04-09 Pending — GEBOR
- 2024-10-26 Price Changed $41,500 GEBOR
- 2024-09-30 Price Changed $42,800 GEBOR
- 2024-08-23 Listed $46,900 GEBOR
Property tax history
+2.8%/yrLatest (2026): $287 · +4.8% YoY. Source: county tax records.
Cash-flow waterfall
monthlySold comps — $/sqft
last 12 mo · ≤1 miLoading sold comps…