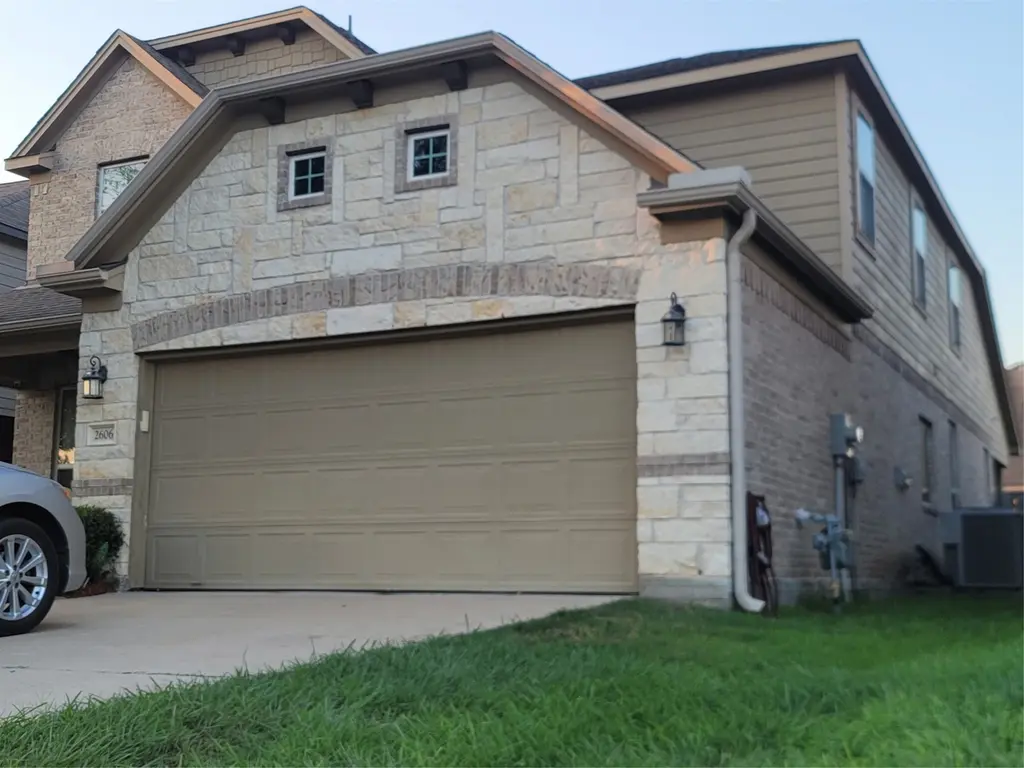
2606 Fresh Dawn Dr · Fresno, TX
Flood risk 6/10 · Moderate
- FEMA flood zone
- X (unshaded)
- Chance of flooding over 30 yrs
- 0.7%
- Est. flood insurance / yr
- $507 – $1,088
Fire risk 4/10 · Minor
- Est. fire insurance / yr
- $1,222 – $2,270
Heat risk 10/10 · Severe
- Hot days now (above 110°F)
- 7 days/yr
- Hot days in 30 yrs
- 26 days/yr
Wind risk 9/10 · Severe
- Chance of severe wind over 30 yrs
- 99.0%
Air-quality risk 2/10 · Minimal
- Unhealthy air days now
- 2 days/yr
- Unhealthy air days in 30 yrs
- 2 days/yr
Risk factors via First Street. Map © Google.
Why this score? — see what drove the D- grade
The composite is a weighted blend of 9 inputs, each scored 0–100. Each bar is that input's sub-score; the figure is the points it added to the 100-point composite (weight × sub-score).
- Cash flow +10.8/30.0
- ARV discount +4.9/15.0
- 1% rule +4.7/10.0
- Schools +4.5/10.0
- Appreciation +4.0/10.0
- DSCR +3.1/10.0
- Livability +3.1/5.0
- Condition / age +2.5/5.0
- Rent growth +2.3/5.0
$330,000
🖨 Deal sheet (PDF) 📄 Offer letter ✓ Due diligence
Listing remarks MLS
Clean and presentable house with large bedrooms in a relatively new subdivision near Amazon. Several quick and easy access to Medical Center. Beautiful stone house with home office, formal dining, granite countertop, Humogous primary bedrm,large family rm, large bedrms stainless steel appliances, Granite, dry breakfast bar, large covered patio, Fireplace, humogous Gameroom, etc.
Key facts
- 5,170 sq ft lot
- 2 garage spots
- Community pool
Neighborhood map
What this means for you Summary
Snapshot
- This is a 4-bed/3.0-bath single-family listed at $330k.
Deal economics
- At list price, monthly cash flow is $-149 ($-2k/yr) — negative.
- To cash-flow at today's rent, offer at most $304k (8.0% below list).
- To meet the 1% rule (rent ≥ 1% of price), the offer needs to be $322k (2.5% below list).
- Recommended offer: $290k (12.0% below list) — sets the bar for market timing.
Location & tenants
- Location reads 62/100 on livability (#943 in TX) — a middle-class / working-renter tenant base. Strengths: employment A+, housing A+, cost of living A; Watch: crime C-, amenities F, commute F.
- Fort Bend ISD (suburban): math 44% / reading 53% proficiency, ranked #140 of 826 in TX (top 17%) — families likely to look elsewhere, expect single-tenant / working-renter base with shorter leases.
- Zoned schools: Rosa Parks El (math 16% / reading 27%, grade F, #3,470 of 4,322 statewide, top 81%, 651 students, 76% FRL); Lake Olympia Middle (math 18% / reading 31%, grade F, #1,279 of 1,662 statewide, top 78%, 1,170 students, 71% FRL); Fort Bend Co Alter (26 students, 0% FRL).
- Zoned-school proficiency averages 23% at this address vs 48% district-wide (-26 pts) — the specific schools serving this property underperform the Fort Bend ISD average; the district grade overstates school quality for this exact location.
- Market conditions: Rents soft (-0.9%/yr); 177 active listings in the ZIP; 11 comparable units currently listed for rent nearby; rentals at typical pace (median 23d on market — plan ~3-4 weeks tenant-placement turnaround); solid renter incomes; 12,093 units permitted in Fort Bend County in 2024 (815 in 5+ unit buildings).
- This rent runs 41% of the median local income ($94k/yr) — at the standard rent-burdened threshold; future hikes will face affordability resistance.
Forward outlook
- Local home prices are declining (-2.0%/yr); year-one equity from $2k of loan paydown is wiped out by about $7k of value loss. Plan a longer hold.
- Fort Bend County population projected at +75% by 2050 — long-run rental-demand tailwind backs the buy-and-hold thesis.
Negotiation context
- It's been on market 283 days — a 12% lower offer ($290k) is reasonable based on typical stale-listing flexibility.
- 6 sale attempts since 10y ago with the ask held roughly flat each time — persistent listings suggest the price (not the market) is what's stuck; bring a comps-based counter.
Risks & watch-outs
- Watch-outs: property tax is 2.8% of price.
- Climate carrying-cost: major flood risk; severe wind risk, 99% chance of damaging wind over 30y; extreme-heat days projected 7→26/yr by 2055 (HVAC capex compounding) — expect insurance premiums to compound above CPI over the hold.
Questions for the listing agent
- What do current leases actually rent for vs. the listed asking? Can we see a recent rent roll and the last 12 months of T-12 income?
- It's been on market 283 days. Have you received any prior offers? Is the seller open to a 12% concession, seller financing, or rate buy-down credit?
- Property tax is high relative to price — has the assessment been appealed recently, and will the sale trigger a re-assessment?
- What does the HOA fee cover, when was the last increase, and are there any pending special assessments or reserve-fund shortfalls?
- Why hasn't it sold? Are there any deal-killer items the seller is aware of (foundation, flood, title, zoning, code violations)?
- Is there a deadline driving the sale (1031 exchange, divorce, estate, relocation)? That informs how much negotiation room exists.
- Schools are D-rated, which usually means shorter tenancies and higher turnover. Who's the typical renter profile here, and what's been the actual vacancy rate?
- The area grade is low — what's the realistic commute time and amenity access for the typical tenant pool here? Any planned neighborhood developments (good or bad) we should know about?
- What's the average days-on-market for RENTAL listings here right now (not sales)? A rising rental-DOM trend means longer vacancies and softer asking-rent achievability than the comps imply.
- What's the recent tenant-quality profile in this submarket — average credit score on applications, eviction rate, late-payment / NSF rate, and stable-employment percentage? A property-management company in the area should have these aggregated.
- How much new for-sale + rental construction is in the pipeline within 1–3 miles? Heavy new supply typically softens prices + rents 12–24 months out; constrained supply supports both.
Investment metrics
- 1% rule
- 0.97% ✗
- Cap rate
- 5.75%
- Cash-on-cash
- -1.94%
- DSCR
- 0.91
- GRM
- 8.5
CMA / ARV
- ARV (median comp)
- $312,263
- List price
- $330,000
- Delta
- 5.68%
- Verdict
- FAIR
- Comps
- 20 within 1.0 mi
Show comp detail 12 sales within ~0.75 mi
| Address | Dist | Beds/Ba | Sqft | Sold | Price | $/sf | Match |
|---|---|---|---|---|---|---|---|
| 2723 Fawn Mountain Dr | 0.22mi | 4/2.5 | 2,785 (+5%) | 0mo | $359,000 | $129 | 78 |
| 2611 Cottage Step Trl Trl | 0.08mi | 4/2.5 | 2,392 (-10%) | 2mo | $295,000 | $123 | 77 |
| 2618 Balsam Ridge Way | 0.30mi | 4/2.5 | 2,764 (+5%) | 1mo | $300,000 | $109 | 75 |
| 2543 Tucker Creek Dr | 0.19mi | 4/3.0 | 2,323 (-12%) | 1mo | $300,000 | $129 | 70 |
| 2019 Damasi Ln | 0.63mi | 4/2.5 | 2,615 (-1%) | 0mo | $319,000 | $122 | 67 |
| 18555 Porta Marina Dr | 0.52mi | 4/3.5 | 2,782 (+5%) | 1mo | $382,390 | $137 | 64 |
| 1931 Acorn Glen Trl | 0.63mi | 4/2.5 | 2,480 (-6%) | 1mo | $279,900 | $113 | 58 |
| 18535 Porta Marina Dr | 0.56mi | 4/3.5 | 2,872 (+9%) | 2mo | $390,950 | $136 | 56 |
| 18411 Porta Marina Dr | 0.71mi | 4/3.5 | 2,782 (+5%) | 1mo | $378,098 | $136 | 56 |
| 2403 Tall Sequoia Dr | 0.52mi | 4/2.5 | 2,340 (-11%) | 1mo | $332,500 | $142 | 54 |
| 18630 Serapis St | 0.51mi | 5/4.0 (+1) | 2,837 (+7%) | 2mo | $426,840 | $150 | 53 |
| 3007 Acacia Fair Ln | 0.54mi | 4/2.5 | 2,351 (-11%) | 2mo | $310,000 | $132 | 53 |
Match score weights: distance 35% · size 25% · config 20% · recency 20%. Top-matched comps best support the ARV.
Projected returns pro-forma
-1.98% appreciation · 0.0% rent growth · sell at horizon
- IRR
- -16.5%
- Equity multiple
- 0.37×
- Total profit
- $-57,844
- Equity at exit
- $64,385
- IRR
- -14.4%
- Equity multiple
- 0.08×
- Total profit
- $-85,094
- Equity at exit
- $55,304
Cash invested: $92,400 (down + closing). Projections, not guarantees.
Landlord ↔ Tenant lean methodology
- Overall (STATE)
- 87 Strongly Landlord-Friendly
- State Texas
- 87 Strongly Landlord-Friendly · R+5
- County
- — inherits STATE
- City
- — inherits STATE
ZIP-level market 77545
- Home prices YoY
- -0.8%
- Rents YoY
- -0.9%
- Active inventory
- 177
- Price-to-rent
- 8.5×
Monthly cashflow live
- Estimated rent
- $3,217 high interval (Pro) →
- Mortgage (P&I)
- −$1,731
- Tax from tax record
- −$778 /mo · $9,334/yr
- Insurance
- −$138
- HOA
- −$45
- Vacancy / Maint / Mgmt
- −$676
- Net cashflow
- $-149
Break-even live
Sensitivity live
| Price | -10% $37 | -5% $-56 | +0% $-149 | +5% $-243 | +10% $-336 |
|---|---|---|---|---|---|
| Rent | -10% $-404 | -5% $-276 | +0% $-149 | +5% $-22 | +10% $105 |
| Rate | -1.0pp $17 | -0.5pp $-65 | base $-149 | +0.5pp $-235 | +1.0pp $-322 |
UW: 25.0% down · 7.5% · 30yr · 1.5% tax · 5.0% vac · 8.0% maint · 8.0% mgmt
Financing live
Cash to close
- Down payment
- $82,500
- Closing costs
- $9,900
- Reserves months
- —
- Total cash needed
- —
Loan-product check · same deal, 3 products live
Conventional
25% down · 7.5% · 30yr
- Down + closing
- —
- Monthly P&I
- —
- Monthly cashflow
- —
- DSCR
- —
- Eligible?
- —
Personal DTI + credit; lowest rate.
DSCR
20% down · 8.5% · 30yr
- Down + closing
- —
- Monthly P&I
- —
- Monthly cashflow
- —
- DSCR
- —
- Eligible?
- —
No personal income docs; deal must DSCR.
Hard money
10% down · 12.0% · 12mo
- Down + closing
- —
- Monthly P&I
- —
- Monthly cashflow
- —
- DSCR
- —
- Eligible?
- —
Short-term bridge; refi at stabilization.
Rent comps 11 comps
| Address | Beds | Baths | Sqft | Rent | $/sqft | DOM | Units | Dist |
|---|---|---|---|---|---|---|---|---|
| 2642 Sunlit Meadow Trl Fresno, TX | 5.0 | 3.5 | 2785 | $4,000 | $1.44 | 45d | 1 | 0.19mi |
| 3106 Presley Jane Ct Missouri City, TX | 3.0 | 2.0 | 2109 | $2,271 | $1.08 | 7d | 1 | 0.84mi |
| 2123 Witham Park Ln Fresno, TX | 4.0 | 4.0 | 3026 | $2,850 | $0.94 | 45d | 1 | 0.88mi |
| 3526 Cambridge Falls Dr Fresno, TX | 4.0 | 3.0 | 3136 | $2,624 | $0.84 | 22d | 1 | 0.92mi |
| 3218 Clayton Terrace Dr Missouri City, TX | 4.0 | 3.0 | 2278 | $2,395 | $1.05 | 21d | 1 | 0.95mi |
| 3314 Dry Creek Dr Missouri City, TX | 4.0 | 3.0 | 2600 | $4,200 | $1.62 | 45d | 1 | 0.96mi |
| 3212 Aldridge Dr Missouri City, TX | 4.0 | 2.5 | 2489 | $2,650 | $1.06 | 22d | 1 | 1.08mi |
| 2707 Troy Dr Missouri City, TX | 3.0 | 2.5 | 2082 | $2,245 | $1.08 | 3d | 1 | 1.09mi |
| 2709 Troy Dr Missouri City, TX | 3.0 | 2.5 | 2082 | $2,245 | $1.08 | 22d | 1 | 1.09mi |
| 3211 Breckinridge Ct Missouri City, TX | 4.0 | 2.5 | 2920 | $2,550 | $0.87 | 22d | 1 | 1.18mi |
| 2235 Argos Dr Missouri City, TX | 4.0 | 3.5 | 2838 | $2,550 | $0.90 | 22d | 1 | 1.38mi |
HOA detail
- Monthly dues
- $45 · $540/yr
Listing history 34 events
-
2026-06-21days on market $330,000 Active 283 DOM
-
2026-06-18days on market $330,000 Active 280 DOM
-
2026-06-17days on market $330,000 Active 279 DOM
-
2026-06-16days on market $330,000 Active 278 DOM
-
2026-06-15days on market $330,000 Active 277 DOM
-
2026-06-13days on market $330,000 Active 275 DOM
-
2026-06-09days on market $330,000 Active 271 DOM
-
2026-06-07days on market $330,000 Active 269 DOM
-
2026-06-04days on market $330,000 Active 266 DOM
-
2026-06-03days on market $330,000 Active 265 DOM
-
2026-06-02days on market $330,000 Active 264 DOM
-
2026-06-01days on market $330,000 Active 263 DOM
-
2026-05-31days on market $330,000 Active 262 DOM
-
2025-12-01price $330,000 381-char remark
Show marketing remark (381 chars)
Clean and presentable house with large bedrooms in a relatively new subdivision near Amazon. Several quick and easy access to Medical Center. Beautiful stone house with home office, formal dining, granite countertop, Humogous primary bedrm,large family rm, large bedrms stainless steel appliances, Granite, dry breakfast bar, large covered patio, Fireplace, humogous Gameroom, etc.
-
2025-11-25price $310,000 381-char remark
Show marketing remark (381 chars)
Clean and presentable house with large bedrooms in a relatively new subdivision near Amazon. Several quick and easy access to Medical Center. Beautiful stone house with home office, formal dining, granite countertop, Humogous primary bedrm,large family rm, large bedrms stainless steel appliances, Granite, dry breakfast bar, large covered patio, Fireplace, humogous Gameroom, etc.
-
2025-09-11$330,000 Active 381-char remark
Show marketing remark (381 chars)
Clean and presentable house with large bedrooms in a relatively new subdivision near Amazon. Several quick and easy access to Medical Center. Beautiful stone house with home office, formal dining, granite countertop, Humogous primary bedrm,large family rm, large bedrms stainless steel appliances, Granite, dry breakfast bar, large covered patio, Fireplace, humogous Gameroom, etc.
-
2025-06-03historical
-
2025-01-19$327,000 Active
-
2025-01-17historical
-
2025-01-17historical
-
2024-06-26$327,000 Active
-
2024-06-26historical
-
2024-05-08price $335,000
-
2024-05-08price $335
-
2024-05-07$330 Active
-
2024-05-06historical
-
2024-03-04$345,000 Active
-
2024-02-22historical
-
2016-05-25historical
-
2016-05-24soldstatus Sold
-
2016-05-19soldstatus
-
2016-05-03status Pending
-
2016-04-20price $223,325
-
2016-02-17$221,210 Active
ⓘ Source: listings_history table (triggers on properties + properties_extension) + one-shot
backfill from property_details.listing_events for pre-trigger history.
Tax reassessment forecast TX · Resets to sale price
- Current annual tax
- $9,334 · $778/mo
- Projected year-2 tax
- $9,334 · $778/mo
- Expected delta
- $0/yr ($0/mo · 0.0%)
ⓘ Screening estimate from a state-policy table — verify with the county assessor before closing.
Climate risk First Street
- Flood 6/10 Major FEMA zone X (unshaded) · 70% chance over 30 yrs
- Wildfire 4/10 Moderate
- Heat 10/10 Extreme 7 d/yr ≥110°F today · 26 d/yr by 30 yrs out
- Wind 9/10 Extreme 99% chance of damaging wind over 30 yrs
- Air quality 2/10 Low 2 unhealthy d/yr today · 2 by 30 yrs out
Nearby sold comps map
Loading sold comps map…
Walkable amenities ~0.75 mi
Loading nearby amenities…
Taxation est. · year 1
- Rental income
- $38,605
- − Mortgage interest
- −$18,485
- − Property taxes
- −$9,334
- − Insurance
- −$1,650
- − Repairs & maintenance
- −$3,088
- − Management
- −$3,088
- − HOA
- −$540
- − Depreciation
- −$9,600
- Taxable loss
- −$7,181
- Est. tax savings @ 24.0%
- +$1,723
- After-tax cash flow
- $-69/yr
For passive investors: Depreciation is non-cash, so a rental often shows a tax loss while cash-flowing — sheltering income. Rental losses are passive: they offset passive income freely, and up to $25,000/yr can offset ordinary (W-2) income if you actively participate and your MAGI is under $100k (phasing out to $0 by $150k); unused losses carry forward. On sale, claimed depreciation is recaptured at up to 25%, and gains may owe capital-gains tax (a 1031 exchange can defer both). Figures are a year-1 estimate at your 24.0% rate — not tax advice; consult a CPA.
Schools (NCES district)
- District
- Fort Bend ISD
- NCES district ID
- 4819650
- Math proficiency
- 44% ▼ -15.00%
- Reading proficiency
- 53% ▼ -4.00%
- Median HH income
- $82,360
- Composite
- 44.61/100
- National rank
- #2779
- State rank
- #140 of 826 in TX
Livability — Fresno
- Score
- 62/100
- State rank
- #943
- US rank
- #16815
Category grades
Schools grade is shown separately in the Schools card above.
Census & demographics
- Census place
- Fresno, TX
- County
- Fort Bend County · 836,777 people
- City population
- 26,236
- Metro
- Houston-The Woodlands-Sugar Land, TX
- Population (ZIP)
- 26,236
- Household income
- $94,474
- Rent vs Own
- Severe rent burden
- 360.0
Population outlook (Fort Bend County) Hauer SSP2
- Today (2025)
- 1,004,526 people
- By 2030
- 1,153,104 · +14.8%
- By 2040
- 1,453,718 · +44.7%
- By 2050
- 1,753,781 · +74.6%
- By 2075
- 2,455,772 · +144.5%
- By 2100
- 2,930,528 · +191.7%
Race, ethnicity, and origin ACS 2023
- Neighborhood character
- Diverse neighborhood (Simpson 0.61)
- Race & ethnicity
- Black 51% Hispanic / Latino 34% Two or more races 12% White 8% Asian 2%
- Hispanic origin (detail)
- Mexican 29%
- Common ancestry
- Portuguese 1%
- Foreign-born
- 18% · Canada
- Languages at home
- 67% English-only · Spanish 29% Other Asian/Pacific 1% Other Indo-European 1%
Political lean MEDSL · Fort Bend
- 2024 margin
- Toss-up / Even · D 49.5% · R 47.9% · Other 2.6%
- 2008→2024 swing
- +4.0pp toward D · 2008: -2.4pp · 2024: 1.6pp
- All cycles
- 2024: D+1.6 2020: D+10.6 2016: D+6.6 2012: R+6.8 2008: R+2.4
Not yet ingested
- Civics
- —
Market trends
- HPI YoY
- ▼ -1.98%
- Current HPI
- 231.3921
- Rent YoY
- ▼ -0.95%
- Metro
- Houston-The Woodlands-Sugar Land, TX
- State GDP YoY
- ▲ 3.95%
- F500 in state
- 110
Industry mix (Fortune 500 HQ in TX)
| Industry | F500 HQs | Revenue |
|---|---|---|
| Energy | 16 | $1,198B |
|
||
| Technology | 5 | $198B |
|
||
| Engineering / Construction | 4 | $72B |
|
||
| Energy Services | 3 | $60B |
|
||
| Utilities | 3 | $41B |
|
||
| Healthcare | 2 | $330B |
|
||
Price history
+49.2% since first listed21 events — show timeline
- 2025-12-01 Price Changed $330,000 HARMLS
- 2025-11-25 Price Changed $310,000 HARMLS
- 2025-09-11 Listed $330,000 HARMLS
- 2025-06-03 Listing Removed — HARMLS
- 2025-01-19 Listed $327,000 HARMLS
- 2025-01-17 Listing Removed — HARMLS
- 2025-01-17 Coming Soon — HARMLS
- 2024-06-26 Listing Removed — HARMLS
- 2024-06-26 Listed $327,000 HARMLS
- 2024-05-08 Price Changed $335,000 HARMLS
- 2024-05-08 Price Changed $335 HARMLS
- 2024-05-07 Listed $330 HARMLS
- 2024-05-06 Listing Removed — HARMLS
- 2024-03-04 Listed $345,000 HARMLS
- 2024-02-22 Coming Soon — HARMLS
- 2016-05-25 Listing Removed — HARMLS
- 2016-05-24 Sold (MLS) — HARMLS
- 2016-05-19 Sold (Public Records) — Public Records
- 2016-05-03 Pending — HARMLS
- 2016-04-20 Price Changed $223,325 HARMLS
- 2016-02-17 Listed $221,210 HARMLS
Property tax history
+38.5%/yrLatest (2025): $9,334 · +8.8% YoY. Source: county tax records.
Cash-flow waterfall
monthlySold comps — $/sqft
last 12 mo · ≤1 miLoading sold comps…