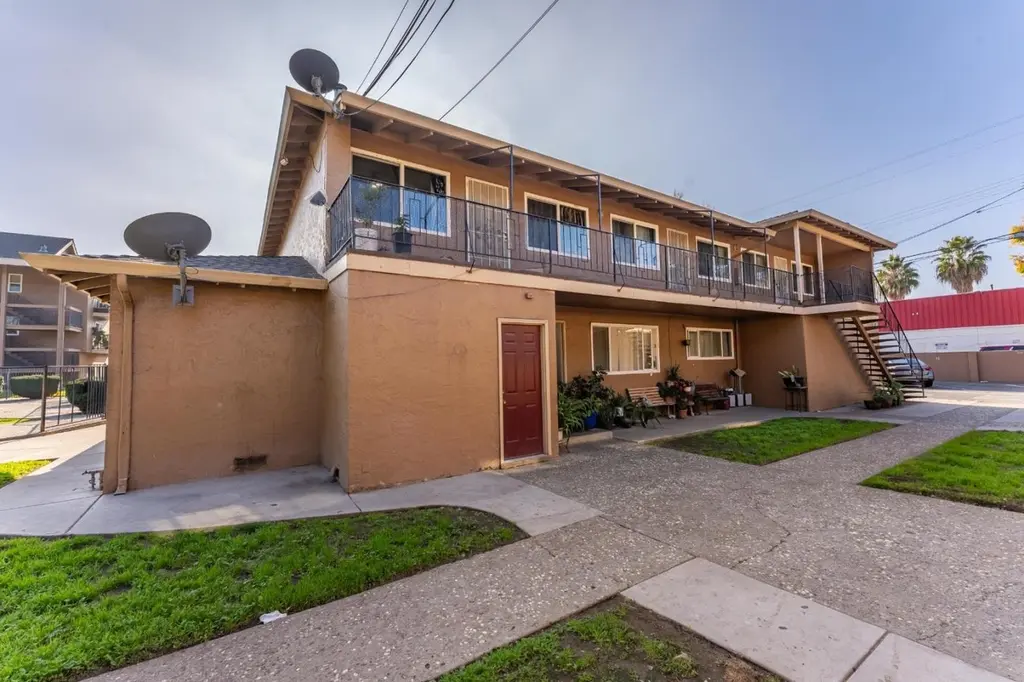
 Fourplex
110 Roundtable #8 Dr · San Jose, CA
Flood risk 1/10 · Minimal
- FEMA flood zone
- D
- Chance of flooding over 30 yrs
- 0.0%
- Est. flood insurance / yr
- $544 – $1,084
Fire risk 2/10 · Minimal
- Est. fire insurance / yr
- $659 – $1,223
Heat risk 5/10 · Moderate
- Hot days now (above 96°F)
- 7 days/yr
- Hot days in 30 yrs
- 14 days/yr
Wind risk 1/10 · Minimal
- Chance of severe wind over 30 yrs
- —
Air-quality risk 9/10 · Severe
- Unhealthy air days now
- 19 days/yr
- Unhealthy air days in 30 yrs
- 19 days/yr
Risk factors via First Street. Map © Google.
Why this score? — see what drove the B- grade
The composite is a weighted blend of 9 inputs, each scored 0–100. Each bar is that input's sub-score; the figure is the points it added to the 100-point composite (weight × sub-score).
- Cash flow +25.7/30.0
- ARV discount +11.0/15.0
- DSCR +8.6/10.0
- 1% rule +7.2/10.0
- Schools +4.9/10.0
- Livability +3.9/5.0
- Rent growth +2.8/5.0
- Condition / age +2.5/5.0
- Appreciation +0.0/10.0
$1,350,000
🖨 Deal sheet (PDF) 📄 Offer letter ✓ Due diligence
Multi-family units
County records classify this as Multi-Family (2-4 Unit). Listing-text estimate: 4 units. confirmed
Listing remarks
Excellent investment property in the heart of South San Jose! This charming fourplex offers steady rental income with great long-term potential. Perfect for investors looking to expand their portfolio or first-time buyers entering the multi-family market. Close to shopping, dining, parks, and major transportation routes. Whether you're seeking a passive income stream or a solid addition to your real estate holdings, this fourplex is a rare find in today's market. Don't miss out on this incredible investment!
Key facts
- Close to parks
- Investment property
- Long-term potential
Tags
Neighborhood map
What this means for you Summary
Snapshot
- This is a 4 × 7-bed/5.0-bath units multifamily listed at $1.35M.
Deal economics
- At list price, monthly cash flow is $3k ($39k/yr) — positive. Per door: $807/mo.
- The deal already cash-flows at list — no discount required.
- Meets the 1% rule at list price ($16k rent vs $1.35M).
- Recommended offer: $1.19M (12.0% below list) — sets the bar for market timing.
- Cap rate 9.2% vs local median 1.6% in San Jose — top-decile yield for the area; either an underpriced asset or a hidden risk that comps aren't pricing in. Stress-test before assuming the spread holds.
Location & tenants
- Location reads 78/100 on livability (#68 in CA, #2,559 nationally) — a middle-class / working-renter tenant base. Strengths: amenities A+, commute A+, employment A+; Watch: crime F, cost of living F.
- Oak Grove Elementary (urban): math 47% / reading 54% proficiency, ranked #339 of 1,400 in CA (top 24%) — acceptable for families but not a draw, mixed tenant base, ~2y average lease.
- Market conditions: Rents rising (+1.0%/yr); 65 active listings in the ZIP; solid renter incomes; 3,838 units permitted in Santa Clara County in 2024 (1,886 in 5+ unit buildings).
- At $16,466/mo this rent would consume 195% of the median local household income ($101k/yr) (locally 1808% of renters already pay >50% of income on rent) — very limited rent-growth headroom before tenants either downsize or default.
Forward outlook
- Local home prices are declining (-3.0%/yr); year-one equity from $9k of loan paydown is wiped out by about $40k of value loss. Plan a longer hold.
- Santa Clara County population projected at +24% by 2050 — long-run rental-demand tailwind backs the buy-and-hold thesis.
Negotiation context
- It's been on market 182 days — a 12% lower offer ($1.19M) is reasonable based on typical stale-listing flexibility.
- 30 sale attempts since 22y ago; this cycle's ask is 79546% above the opening price — seller raised mid-cycle; expect resistance to lowballs.
- Current owner paid $420k; list at $1.35M implies a 221% gain — meaningful room to come down on a strong offer.
Risks & watch-outs
- Climate carrying-cost: extreme-heat days projected 7→14/yr by 2055 (HVAC capex compounding) — expect insurance premiums to compound above CPI over the hold.
Questions for the listing agent
- It's been on market 182 days. Have you received any prior offers? Is the seller open to a 12% concession, seller financing, or rate buy-down credit?
- Can we see the unit-by-unit rent roll, current vacancy, and any below-market leases? What's the average tenancy length?
- What capital expenditures (roof, boiler, parking lot, exteriors) have been made in the last 5 years, and what's planned in the next 2?
- Built in 1964 — when were the roof, HVAC, electrical panel, plumbing, and water heater last replaced?
- What does the HOA fee cover, when was the last increase, and are there any pending special assessments or reserve-fund shortfalls?
- Why hasn't it sold? Are there any deal-killer items the seller is aware of (foundation, flood, title, zoning, code violations)?
- Is there a deadline driving the sale (1031 exchange, divorce, estate, relocation)? That informs how much negotiation room exists.
- Crime grade is F in this area — have there been break-ins, vandalism, or insurance claims at this property in the last 3 years? What carrier currently insures it and at what premium?
- What's the average days-on-market for RENTAL listings here right now (not sales)? A rising rental-DOM trend means longer vacancies and softer asking-rent achievability than the comps imply.
- What's the recent tenant-quality profile in this submarket — average credit score on applications, eviction rate, late-payment / NSF rate, and stable-employment percentage? A property-management company in the area should have these aggregated.
- How much new apartment / multifamily construction is in the pipeline within 1–3 miles? Heavy new supply (>2% of stock underway) typically softens rents 12–24 months out; light construction supports rent growth.
Investment metrics
- 1% rule
- 1.22% ✓
- Cap rate
- 9.16%
- Cash-on-cash
- 10.25%
- DSCR
- 1.46
- GRM
- 6.8
CMA / ARV
- ARV (median comp)
- $1,464,246
- List price
- $1,350,000
- Delta
- -7.80%
- Verdict
- FAIR
- Comps
- 4 within 1.0 mi
Projected returns pro-forma
-3.0% appreciation · 1.0% rent growth · sell at horizon
- IRR
- -3.2%
- Equity multiple
- 0.88×
- Total profit
- $-45,091
- Equity at exit
- $201,289
- IRR
- 4.0%
- Equity multiple
- 1.26×
- Total profit
- $99,584
- Equity at exit
- $116,723
Cash invested: $378,000 (down + closing). Projections, not guarantees.
Landlord ↔ Tenant lean methodology
- Overall (CITY)
- 0 Strongly Tenant-Friendly
- State California
- 18 Strongly Tenant-Friendly · D+13
- County
- — inherits STATE
- City San Jose
- 0 Strongly Tenant-Friendly · D+24
ZIP-level market 95111
- Rents YoY
- 1.0%
- Active inventory
- 65
- Price-to-rent
- 27.3×
Monthly cashflow live
- Estimated rent
- $16,466 medium interval (Pro) →
- Mortgage (P&I)
- −$7,080
- Tax est. 1.5%
- −$1,688 /mo · $20,250/yr
- Insurance
- −$562
- HOA
- −$450
- Vacancy / Maint / Mgmt
- −$3,458
- Net cashflow
- $3,229
Break-even live
Sensitivity live
| Price | -10% $4,162 | -5% $3,695 | +0% $3,229 | +5% $2,762 | +10% $2,296 |
|---|---|---|---|---|---|
| Rent | -10% $1,928 | -5% $2,578 | +0% $3,229 | +5% $3,879 | +10% $4,529 |
| Rate | -1.0pp $3,908 | -0.5pp $3,572 | base $3,229 | +0.5pp $2,879 | +1.0pp $2,523 |
4-unit breakdown (identical units grouped — click to expand)
| Units | Beds | Baths | Est. rent |
|---|---|---|---|
| 4× units | 7 | 5 | $16,464 |
| #1 | 7 | 5 | $4,116 |
| #2 | 7 | 5 | $4,116 |
| #3 | 7 | 5 | $4,116 |
| #4 | 7 | 5 | $4,116 |
| Total (4 units) | $16,466 | ||
UW: 25.0% down · 7.5% · 30yr · 1.5% tax · 5.0% vac · 8.0% maint · 8.0% mgmt
Financing live
Cash to close
- Down payment
- $337,500
- Closing costs
- $40,500
- Reserves months
- —
- Total cash needed
- —
Loan-product check · same deal, 3 products live
Conventional
25% down · 7.5% · 30yr
- Down + closing
- —
- Monthly P&I
- —
- Monthly cashflow
- —
- DSCR
- —
- Eligible?
- —
Personal DTI + credit; lowest rate.
DSCR
20% down · 8.5% · 30yr
- Down + closing
- —
- Monthly P&I
- —
- Monthly cashflow
- —
- DSCR
- —
- Eligible?
- —
No personal income docs; deal must DSCR.
Hard money
10% down · 12.0% · 12mo
- Down + closing
- —
- Monthly P&I
- —
- Monthly cashflow
- —
- DSCR
- —
- Eligible?
- —
Short-term bridge; refi at stabilization.
HOA detail
- Monthly dues
- $450 · $5,400/yr
Listing history 50 events
-
2026-06-18days on market $1,350,000 Active 182 DOM
-
2026-06-17days on market $1,350,000 Active 181 DOM
-
2026-06-16days on market $1,350,000 Active 180 DOM
-
2026-06-15days on market $1,350,000 Active 179 DOM
-
2026-06-13days on market $1,350,000 Active 177 DOM
-
2026-06-13days on market $1,350,000 Active 176 DOM
-
2026-06-09days on market $1,350,000 Active 173 DOM
-
2026-06-08days on market $1,350,000 Active 172 DOM
-
2026-06-07days on market $1,350,000 Active 171 DOM
-
2026-06-05days on market $1,350,000 Active 168 DOM
-
2026-06-03days on market $1,350,000 Active 167 DOM
-
2026-06-02days on market $1,350,000 Active 166 DOM
-
2026-06-01days on market $1,350,000 Active 165 DOM
-
2026-05-31days on market $1,350,000 Active 164 DOM
-
2026-02-21historical
-
2026-02-21historical
-
2024-03-19historical $1,695
-
2024-03-13$1,695
-
2013-03-06soldstatus $420,000 Sold
-
2013-01-04status Pending (Do Not Show)
-
2012-11-21price $435,290
-
2012-10-11$458,194 Active
-
2012-04-20soldstatus $452,500
-
2012-04-20soldstatus $452,500 Sold
-
2012-03-29status Pending (Do Not Show)
-
2012-03-27$452,500 Active
-
2012-03-26$452,500
-
2011-09-09soldstatus $270,000 Sold
-
2011-08-06status Pending (Do Not Show)
-
2011-06-30price $299,900
-
2011-06-16status Active
-
2011-05-24soldstatus $510,000 Sold
-
2011-05-05status Pending (Do Not Show)
-
2011-04-27status Active
-
2011-04-22status Pending (Do Not Show)
-
2011-04-21status Active
-
2011-04-18status Pending (Do Not Show)
-
2011-04-15$499,500 Active
-
2011-04-12soldstatus $443,900 Sold
-
2011-04-08status Pending (Do Not Show)
-
2011-03-24status Pending Without Release
-
2011-03-19price $329,900
-
2011-03-18$449,900 Active
-
2011-02-16price $349,900
-
2011-01-13$389,900 Active
-
2010-12-06soldstatus $450,000 Sold
-
2010-09-20status Contingent
-
2010-09-15status Active
-
2010-09-15price $450,000 Active
-
2010-05-27status Contingent
ⓘ Source: listings_history table (triggers on properties + properties_extension) + one-shot
backfill from property_details.listing_events for pre-trigger history.
Climate risk First Street
- Flood 1/10 Low FEMA zone D · 0% chance over 30 yrs
- Wildfire 2/10 Low
- Heat 5/10 Major 7 d/yr ≥96°F today · 14 d/yr by 30 yrs out
- Wind 1/10 Low
- Air quality 9/10 Extreme 19 unhealthy d/yr today · 19 by 30 yrs out
Nearby sold comps map
Loading sold comps map…
Walkable amenities ~0.75 mi
Loading nearby amenities…
Taxation est. · year 1
- Rental income
- $197,592
- − Mortgage interest
- −$75,621
- − Property taxes
- −$20,250
- − Insurance
- −$6,750
- − Repairs & maintenance
- −$15,807
- − Management
- −$15,807
- − HOA
- −$5,400
- − Depreciation
- −$39,273
- Taxable income
- $18,684
- Est. tax owed @ 24.0%
- −$4,484
- After-tax cash flow
- $34,259/yr
For passive investors: Depreciation is non-cash, so a rental often shows a tax loss while cash-flowing — sheltering income. Rental losses are passive: they offset passive income freely, and up to $25,000/yr can offset ordinary (W-2) income if you actively participate and your MAGI is under $100k (phasing out to $0 by $150k); unused losses carry forward. On sale, claimed depreciation is recaptured at up to 25%, and gains may owe capital-gains tax (a 1031 exchange can defer both). Figures are a year-1 estimate at your 24.0% rate — not tax advice; consult a CPA.
Schools (NCES district)
- District
- Oak Grove Elementary
- NCES district ID
- 0627810
- Math proficiency
- 47% ▲ 1.00%
- Reading proficiency
- 54% ▬ 0.00%
- Median HH income
- $92,404
- Composite
- 49.23/100
- National rank
- #4382
- State rank
- #339 of 1400 in CA
Livability — San Jose
- Score
- 78/100
- State rank
- #68
- US rank
- #2559
Category grades
Schools grade is shown separately in the Schools card above.
Census & demographics
- Census place
- San Jose, CA
- County
- Santa Clara County · 1,806,974 people
- City population
- 954,479
- Metro
- San Jose-Sunnyvale-Santa Clara, CA
- Population (ZIP)
- 57,202
- Household income
- $101,435
- Rent vs Own
- Severe rent burden
- 1808.0
Population outlook (Santa Clara County) Hauer SSP2
- Today (2025)
- 2,179,074 people
- By 2030
- 2,301,297 · +5.6%
- By 2040
- 2,528,195 · +16.0%
- By 2050
- 2,712,135 · +24.5%
- By 2075
- 2,998,701 · +37.6%
- By 2100
- 2,931,429 · +34.5%
Race, ethnicity, and origin ACS 2023
- Neighborhood character
- Diverse neighborhood (Simpson 0.60)
- Race & ethnicity
- Hispanic / Latino 51% Asian 36% Two or more races 22% White 7% Native American 2% Black 2%
- Hispanic origin (detail)
- Mexican 46%
- Foreign-born
- 45% · Canada, Vietnam, China
- Languages at home
- 27% English-only · Spanish 40% Vietnamese 24% Chinese 3%
Political lean MEDSL · Santa Clara
- 2024 margin
- Solid D (+40.0) · D 68.1% · R 28.1% · Other 3.8%
- 2008→2024 swing
- -0.9pp no change · 2008: 40.9pp · 2024: 40.0pp
- All cycles
- 2024: D+40.0 2020: D+47.4 2016: D+52.5 2012: D+42.1 2008: D+40.9
Not yet ingested
- Civics
- —
Market trends
- HPI YoY
- ▼ -1144.74%
- Current HPI
- 339.7949
- Rent YoY
- ▲ 1.00%
- Metro
- San Jose-Sunnyvale-Santa Clara, CA
- State GDP YoY
- ▲ 3.21%
- F500 in state
- 116
Industry mix (Fortune 500 HQ in CA)
| Industry | F500 HQs | Revenue |
|---|---|---|
| Technology | 27 | $1,492B |
|
||
| Financial Services | 3 | $174B |
|
||
| Retail | 3 | $44B |
|
||
| Insurance | 3 | $26B |
|
||
| Media / Entertainment | 2 | $115B |
|
||
| Pharmaceuticals / Biotech | 2 | $62B |
|
||
Price history
-99.7% since first listed101 events — show timeline
- 2026-02-21 Listing Removed — bridgeMLS, Bay East AOR, or Contra Costa AOR
- 2026-02-21 Listing Removed — bridgeMLS, Bay East AOR, or Contra Costa AOR
- 2024-03-19 Rental Removed $1,695 APPFOLIO
- 2024-03-13 Listed for Rent $1,695 APPFOLIO
- 2013-03-06 Sold (MLS) $420,000 MLSListings
- 2013-01-04 Pending — MLSListings
- 2012-11-21 Price Changed $435,290 MLSListings
- 2012-10-11 Listed $458,194 MLSListings
- 2012-04-20 Sold (MLS) $452,500 MLSListings
- 2012-04-20 Sold (MLS) $452,500 SDMLS
- 2012-03-29 Pending — MLSListings
- 2012-03-27 Listed $452,500 MLSListings
- 2012-03-26 Listed $452,500 SDMLS
- 2011-09-09 Sold (MLS) $270,000 MLSListings
- 2011-08-06 Pending — MLSListings
- 2011-06-30 Price Changed $299,900 MLSListings
- 2011-06-16 Relisted — MLSListings
- 2011-05-24 Sold (MLS) $510,000 MLSListings
- 2011-05-05 Pending — MLSListings
- 2011-04-27 Relisted — MLSListings
- 2011-04-22 Pending — MLSListings
- 2011-04-21 Relisted — MLSListings
- 2011-04-18 Pending — MLSListings
- 2011-04-15 Listed $499,500 MLSListings
- 2011-04-12 Sold (MLS) $443,900 MLSListings
- 2011-04-08 Pending — MLSListings
- 2011-03-24 Pending — MLSListings
- 2011-03-19 Price Changed $329,900 MLSListings
- 2011-03-18 Listed $449,900 MLSListings
- 2011-02-16 Price Changed $349,900 MLSListings
- 2011-01-13 Listed $389,900 MLSListings
- 2010-12-06 Sold (MLS) $450,000 MLSListings
- 2010-09-20 Pending — MLSListings
- 2010-09-15 Relisted — MLSListings
- 2010-09-15 Price Changed $450,000 MLSListings
- 2010-05-27 Pending — MLSListings
- 2010-05-07 Price Changed $498,000 MLSListings
- 2010-05-06 Listed $528,000 MLSListings
- 2010-02-26 Sold (MLS) $382,900 MLSListings
- 2010-02-18 Sold (MLS) $520,000 MLSListings
- 2010-01-26 Pending — MLSListings
- 2010-01-06 Pending — MLSListings
- 2009-12-23 Pending — MLSListings
- 2009-12-12 Listed $382,900 MLSListings
- 2009-12-11 Listed $487,000 MLSListings
- 2009-12-08 Sold (MLS) $518,000 MLSListings
- 2009-11-23 Pending — MLSListings
- 2009-11-16 Listed $518,000 MLSListings
- 2009-07-14 Sold (MLS) $480,000 MLSListings
- 2009-05-21 Contingent — MLSListings
- 2009-05-14 Price Changed $469,900 MLSListings
- 2009-04-13 Price Changed $506,800 MLSListings
- 2009-03-20 Price Changed $519,900 MLSListings
- 2009-02-27 Price Changed $533,900 MLSListings
- 2009-02-19 Sold (MLS) $470,000 MLSListings
- 2009-02-18 Listing Removed — MLSListings
- 2009-02-13 Listed — MLSListings
- 2009-02-07 Listed $541,900 MLSListings
- 2009-01-13 Sold (MLS) $480,000 MLSListings
- 2009-01-13 Price Changed $492,000 MLSListings
- 2009-01-02 Listing Removed — MLSListings
- 2008-12-20 Relisted — MLSListings
- 2008-12-15 Listing Removed — MLSListings
- 2008-12-10 Contingent — MLSListings
- 2008-10-23 Listed $580,000 MLSListings
- 2006-06-06 Sold (MLS) $780,000 MLSListings
- 2006-04-28 Listing Removed — MLSListings
- 2006-04-05 Listing Removed — MLSListings
- 2006-03-30 Listing Removed — MLSListings
- 2006-03-12 Listing Removed — MLSListings
- 2006-03-08 Listed $779,500 MLSListings
- 2006-03-02 Sold (MLS) $750,000 MLSListings
- 2006-02-26 Sold (MLS) $610,000 MLSListings
- 2006-02-01 Listed $750,000 MLSListings
- 2006-01-12 Sold (MLS) $780,000 MLSListings
- 2006-01-04 Sold (MLS) $690,000 MLSListings
- 2005-12-30 Listed $599,000 MLSListings
- 2005-12-27 Listing Removed — MLSListings
- 2005-12-06 Sold (MLS) $773,000 MLSListings
- 2005-11-18 Listing Removed — MLSListings
- 2005-11-17 Listed $690,000 MLSListings
- 2005-10-23 Listed $785,000 MLSListings
- 2005-08-25 Listed $784,500 MLSListings
- 2005-05-13 Sold (MLS) $725,000 MLSListings
- 2005-04-22 Listing Removed — MLSListings
- 2005-04-21 Sold (MLS) $650,000 MLSListings
- 2005-04-06 Listing Removed — MLSListings
- 2005-03-30 Listed $725,000 MLSListings
- 2005-03-21 Sold (MLS) $660,000 MLSListings
- 2005-03-12 Sold (MLS) $702,000 MLSListings
- 2005-03-07 Listed $685,000 MLSListings
- 2005-02-12 Listing Removed — MLSListings
- 2005-02-12 Listing Removed — MLSListings
- 2004-12-02 Sold (MLS) $525,000 MLSListings
- 2004-11-24 Sold (MLS) $60,000 MLSListings
- 2004-10-22 Listing Removed — MLSListings
- 2004-10-21 Listing Removed — MLSListings
- 2004-09-07 Listed $515,000 MLSListings
- 2004-08-23 Listed $660,000 MLSListings
- 2004-08-23 Listed $660,000 MLSListings
- 2004-08-12 Sold (MLS) $650,000 MLSListings
Cash-flow waterfall
monthlySold comps — $/sqft
last 12 mo · ≤1 miLoading sold comps…