112 Sukey Ridge Rd · Harlan, KY
Flood risk 8/10 · Major
- FEMA flood zone
- X
- Chance of flooding over 30 yrs
- 0.99%
- Est. flood insurance / yr
- $508 – $851
Fire risk 3/10 · Minor
- Est. fire insurance / yr
- $839 – $1,559
Heat risk 4/10 · Minor
- Hot days now (above threshold)
- 8 days/yr
- Hot days in 30 yrs
- 23 days/yr
Wind risk No data
- Chance of severe wind over 30 yrs
- —
Air-quality risk No data
- Unhealthy air days now
- —
- Unhealthy air days in 30 yrs
- —
Risk factors via First Street. Map © Google.
Why this score? — see what drove the B grade
The composite is a weighted blend of 9 inputs, each scored 0–100. Each bar is that input's sub-score; the figure is the points it added to the 100-point composite (weight × sub-score).
- Cash flow +30.0/30.0
- 1% rule +10.0/10.0
- DSCR +10.0/10.0
- ARV discount +7.5/15.0
- Appreciation +4.6/10.0
- Schools +3.1/10.0
- Livability +2.9/5.0
- Rent growth +2.5/5.0
- Condition / age +2.5/5.0
$51,600
🖨 Deal sheet (PDF) 📄 Offer letter ✓ Due diligence
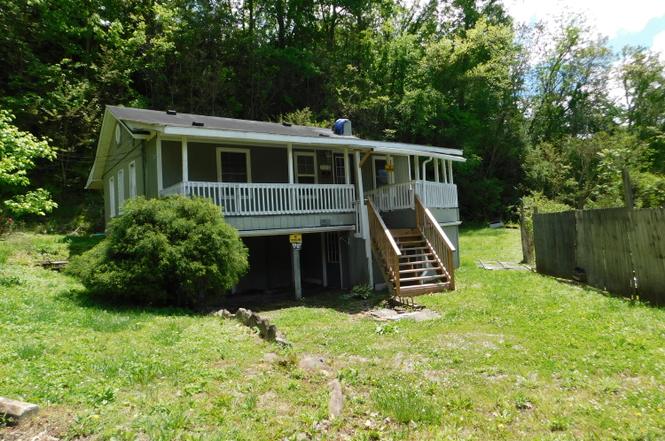
Listing remarks
This cozy two bedroom, two bath home has lots of potential Inside!! Outside it has a nice private side yard and gorgeous mountain views!
Key facts
- Private side yard
- Mountain views
- 0.95 acre lot
Tags
Neighborhood map
What this means for you Summary
Snapshot
- This is a 2-bed/2.0-bath single-family listed at $52k.
Deal economics
- At list price, monthly cash flow is $372 ($4k/yr) — positive.
- The deal already cash-flows at list — no discount required.
- Meets the 1% rule at list price ($994 rent vs $52k).
- Recommended offer: $51k (1.5% below list) — sets the bar for market timing.
Location & tenants
- Location reads 58/100 on livability (#426 in KY) — a working-class tenant base; expect higher turnover. Strengths: cost of living A+, crime B+, housing B+; Watch: amenities F, commute F, employment F.
- Harlan Independent (town): math 28% / reading 49% proficiency, ranked #54 of 165 in KY (top 33%) — families likely to look elsewhere, expect single-tenant / working-renter base with shorter leases.
- Zoned schools: Harlan Elementary School (math 42% / reading 47%, grade F, #148 of 676 statewide, top 24%, 345 students, 66% FRL); Harlan High School (math 23% / reading 51%, grade F, #58 of 254 statewide, top 27%, 391 students, 64% FRL).
- Market conditions: 8 active listings in the ZIP.
Forward outlook
- Local home prices are declining (-0.8%/yr); year-one equity from $357 of loan paydown is wiped out by about $411 of value loss. Plan a longer hold.
- Harlan County population projected at -34% by 2050 — secular population decline; favor cash flow + early exit over multi-decade hold.
- At projected returns (-0.8% appreciation + 3.0% rent growth), your $14k cash investment doubles in ~4 years — after that, you're playing with house money.
Negotiation context
- It's been on market 15 days — a 2% lower offer ($51k) is reasonable based on typical stale-listing flexibility.
Risks & watch-outs
- Watch-outs: flood insurance adds $57/mo; built in 1930 — expect roof / HVAC / electrical / plumbing capex.
- Climate carrying-cost: severe flood risk — expect insurance premiums to compound above CPI over the hold.
Questions for the listing agent
- Built in 1930 — when were the roof, HVAC, electrical panel, plumbing, and water heater last replaced?
- What's the actual annual flood-insurance premium (NFIP or private), and is the property in a SFHA with mandatory coverage?
- Is there a deadline driving the sale (1031 exchange, divorce, estate, relocation)? That informs how much negotiation room exists.
- Schools are B-rated — typically a magnet for longer-tenancy family renters. What's the average tenant stay here, and is there a school-zone premium baked into asking?
- What's the average days-on-market for RENTAL listings here right now (not sales)? A rising rental-DOM trend means longer vacancies and softer asking-rent achievability than the comps imply.
- What's the recent tenant-quality profile in this submarket — average credit score on applications, eviction rate, late-payment / NSF rate, and stable-employment percentage? A property-management company in the area should have these aggregated.
- How much new for-sale + rental construction is in the pipeline within 1–3 miles? Heavy new supply typically softens prices + rents 12–24 months out; constrained supply supports both.
Investment metrics
- 1% rule
- 1.93% ✓
- Cap rate
- 16.26%
- Cash-on-cash
- 35.61%
- DSCR
- 2.58
- GRM
- 4.3
CMA / ARV
- ARV (on-the-fly)
- $112,520
- Comps found
- 2
Show comp detail 2 sales within ~0.75 mi
| Address | Dist | Beds/Ba | Sqft | Sold | Price | $/sf | Match |
|---|---|---|---|---|---|---|---|
| 505 Highway 840 | 0.31mi | 3/2.0 (+1) | 1,184 (+2%) | 9mo | $114,900 | $97 | 70 |
| 181 W Highway 72 | 0.62mi | 2/2.0 | 1,280 (+10%) | 12mo | $74,500 | $58 | 44 |
Match score weights: distance 35% · size 25% · config 20% · recency 20%. Top-matched comps best support the ARV.
Projected returns pro-forma
-0.8% appreciation · 3.0% rent growth · sell at horizon
- IRR
- 30.0%
- Equity multiple
- 2.41×
- Total profit
- $20,340
- Equity at exit
- $12,962
- IRR
- 34.6%
- Equity multiple
- 4.68×
- Total profit
- $53,128
- Equity at exit
- $14,047
Cash invested: $14,448 (down + closing). Projections, not guarantees.
Landlord ↔ Tenant lean methodology
- Overall (STATE)
- 83 Strongly Landlord-Friendly
- State Kentucky
- 83 Strongly Landlord-Friendly · R+16
- County
- — inherits STATE
- City
- — inherits STATE
ZIP-level market 40806
- Home prices YoY
- -0.5%
- Active inventory
- 8
- Price-to-rent
- 4.3×
Monthly cashflow live
- Estimated rent
- $994 medium interval (Pro) →
- Mortgage (P&I)
- −$271
- Tax est. 1.5%
- −$64 /mo · $774/yr
- Insurance
- −$22
- Flood insurance flood zone
- −$57 /mo · $680/yr
- HOA
- −$0
- Vacancy / Maint / Mgmt
- −$209
- Net cashflow
- $372
Break-even live
Sensitivity live
| Price | -10% $408 | -5% $390 | +0% $372 | +5% $354 | +10% $336 |
|---|---|---|---|---|---|
| Rent | -10% $294 | -5% $333 | +0% $372 | +5% $411 | +10% $451 |
| Rate | -1.0pp $398 | -0.5pp $385 | base $372 | +0.5pp $359 | +1.0pp $345 |
UW: 25.0% down · 7.5% · 30yr · 1.5% tax · 5.0% vac · 8.0% maint · 8.0% mgmt
Financing live
Cash to close
- Down payment
- $12,900
- Closing costs
- $1,548
- Reserves months
- —
- Total cash needed
- —
Loan-product check · same deal, 3 products live
Conventional
25% down · 7.5% · 30yr
- Down + closing
- —
- Monthly P&I
- —
- Monthly cashflow
- —
- DSCR
- —
- Eligible?
- —
Personal DTI + credit; lowest rate.
DSCR
20% down · 8.5% · 30yr
- Down + closing
- —
- Monthly P&I
- —
- Monthly cashflow
- —
- DSCR
- —
- Eligible?
- —
No personal income docs; deal must DSCR.
Hard money
10% down · 12.0% · 12mo
- Down + closing
- —
- Monthly P&I
- —
- Monthly cashflow
- —
- DSCR
- —
- Eligible?
- —
Short-term bridge; refi at stabilization.
Listing history 2 events
-
2025-05-21status Pending
-
2025-05-05$51,600 Active
ⓘ Source: listings_history table (triggers on properties + properties_extension) + one-shot
backfill from property_details.listing_events for pre-trigger history.
Climate risk First Street
- Flood 8/10 Severe FEMA zone X · 99% chance over 30 yrs
- Wildfire 3/10 Moderate
- Heat 4/10 Moderate
Nearby sold comps map
Loading sold comps map…
Walkable amenities ~0.75 mi
Loading nearby amenities…
Taxation est. · year 1
- Rental income
- $11,929
- − Mortgage interest
- −$2,890
- − Property taxes
- −$774
- − Insurance
- −$938
- − Repairs & maintenance
- −$954
- − Management
- −$954
- − Depreciation
- −$1,501
- Taxable income
- $3,917
- Est. tax owed @ 24.0%
- −$940
- After-tax cash flow
- $3,525/yr
For passive investors: Depreciation is non-cash, so a rental often shows a tax loss while cash-flowing — sheltering income. Rental losses are passive: they offset passive income freely, and up to $25,000/yr can offset ordinary (W-2) income if you actively participate and your MAGI is under $100k (phasing out to $0 by $150k); unused losses carry forward. On sale, claimed depreciation is recaptured at up to 25%, and gains may owe capital-gains tax (a 1031 exchange can defer both). Figures are a year-1 estimate at your 24.0% rate — not tax advice; consult a CPA.
Schools (NCES district)
- District
- Harlan Independent
- NCES district ID
- 2102520
- Math proficiency
- 28% ▼ -28.00%
- Reading proficiency
- 49% ▼ -14.00%
- Median HH income
- $25,210
- Composite
- 30.8/100
- National rank
- #6143
- State rank
- #54 of 165 in KY
Livability — Harlan
- Score
- 58/100
- State rank
- #426
- US rank
- #20649
Category grades
Schools grade is shown separately in the Schools card above.
Census & demographics
- Population (ZIP)
- 1,827
Population outlook (Harlan County) Hauer SSP2
- Today (2025)
- 24,324 people
- By 2030
- 22,492 · -7.5%
- By 2040
- 19,052 · -21.7%
- By 2050
- 16,060 · -34.0%
- By 2075
- 10,525 · -56.7%
- By 2100
- 6,933 · -71.5%
Race, ethnicity, and origin ACS 2023
- Neighborhood character
- Predominantly White (97%)
- Race & ethnicity
- White 97% Two or more races 3%
- Common ancestry
- Lithuanian 3%
Political lean MEDSL · Harlan
- 2024 margin
- Solid R (+76.2) · D 11.6% · R 87.7%
- 2008→2024 swing
- -30.0pp toward R · 2008: -46.2pp · 2024: -76.2pp
- All cycles
- 2024: R+76.2 2020: R+71.8 2016: R+72.2 2012: R+64.0 2008: R+46.2
Not yet ingested
- Civics
- —
Market trends
- HPI YoY
- ▼ -0.80%
- Current HPI
- 171.773
- Rent YoY
- —
- Metro
- —
- State GDP YoY
- ▲ 1.81%
- F500 in state
- 4
Industry mix (Fortune 500 HQ in KY)
| Industry | F500 HQs | Revenue |
|---|---|---|
| Healthcare | 1 | $118B |
|
||
| Food / Beverage | 1 | $7B |
|
||
Price history
2 events — show timeline
- 2025-05-21 Pending — ImagineMLS
- 2025-05-05 Listed $51,600 ImagineMLS
Cash-flow waterfall
monthlySold comps — $/sqft
last 12 mo · ≤1 miLoading sold comps…