13322 Tulip St NW · Andover, MN
Flood risk 1/10 · Minimal
- FEMA flood zone
- X (unshaded)
- Chance of flooding over 30 yrs
- 0.0%
- Est. flood insurance / yr
- $473 – $860
Fire risk 1/10 · Minimal
- Est. fire insurance / yr
- $888 – $1,650
Heat risk 2/10 · Minimal
- Hot days now (above 99°F)
- 7 days/yr
- Hot days in 30 yrs
- 14 days/yr
Wind risk 2/10 · Minimal
- Chance of severe wind over 30 yrs
- —
Air-quality risk 2/10 · Minimal
- Unhealthy air days now
- 2 days/yr
- Unhealthy air days in 30 yrs
- 2 days/yr
Risk factors via First Street. Map © Google.
Why this score? — see what drove the D- grade
The composite is a weighted blend of 9 inputs, each scored 0–100. Each bar is that input's sub-score; the figure is the points it added to the 100-point composite (weight × sub-score).
- Cash flow +9.4/30.0
- ARV discount +7.5/15.0
- Schools +4.7/10.0
- Livability +3.6/5.0
- DSCR +2.6/10.0
- 1% rule +2.5/10.0
- Rent growth +2.5/5.0
- Condition / age +2.5/5.0
- Appreciation +0.0/10.0
$367,900
🖨 Deal sheet 📄 Offer letter ✓ Due diligence
Listing remarks MLS
Wow, come check out this massive detached townhome in Andover. Sporting 3 beds, 4 baths, upper level laundry and oversized kitchen with ample cabinet/counter space. Cleaned/new carpet and fresh paint throughout. Conveniently located near highways, Riverdale shopping Center and a few miles from the Northstar station for an easy commute (or so you can catch a Vikes game)! Set up a showing today.
Key facts
- Quality appliances
- Detached townhome
- Ample cabinetry
Tags
Property features AI
Finance
- Other: Directions: Hwy 10 to Round Lake Blvd North to 133rd Lane, East to Tulip St, South to home.
- HOA & community: City View Farm Homeowner's Association; HOA fee $120 monthly covering hazard insurance, lawn care, grounds maintenance, and snow removal
Exterior
- Parking: Attached or detached 2-car garage (576 sq. ft. garage area reported)
- Utilities: City water connected; City sewer connected; Electric and natural gas service
- Home design: Residential property; Two levels; Main entry level on main floor
- Construction: Block foundation; Foundation area reported as 816; Below-grade finished area and space in basement
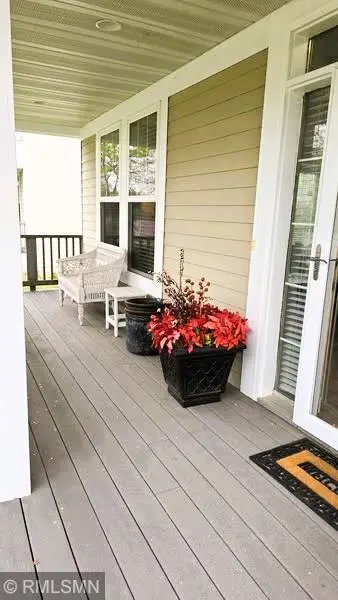
- Exterior features: Metal and vinyl exterior; Porch (23 x 6); Deck (12 x 12); Lot approximately 0.14 acre (44 x 138)
Interior
- Kitchen: Kitchen on main level (17 x 13)
- Bedrooms: Three bedrooms (two on upper level; one upper bedroom listed without level); Loft area (upper level)
- Bathrooms: Two full bathrooms; One three-quarter bathroom; One half bathroom
- Heating & cooling: Forced air heating; Central air conditioning
- Interior features: Finished full basement with block construction and sump pump; Living room fireplace; Living/Dining room or separate formal dining area; 2nd-floor laundry
- Laundry & utility: Laundry on second floor
Neighborhood map
What this means for you Summary
Snapshot
- This is a 3-bed/4.0-bath townhouse listed at $368k.
Deal economics
- At list price, monthly cash flow is $-263 ($-3k/yr) — negative.
- To cash-flow at today's rent, offer at most $321k (12.6% below list).
- To meet the 1% rule (rent ≥ 1% of price), the offer needs to be $274k (25.4% below list).
- Recommended offer: $274k (25.4% below list) — sets the bar for 1% rule.
- Cap rate 5.4% vs local median 3.6% in Andover — top-decile yield for the area; either an underpriced asset or a hidden risk that comps aren't pricing in. Stress-test before assuming the spread holds.
Location & tenants
- Location reads 72/100 on livability (#291 in MN) — a middle-class / working-renter tenant base. Strengths: employment A+, housing A+, schools A; Watch: amenities F, commute F, cost of living D-.
- Anoka-Hennepin Public School District (suburban): math 49% / reading 55% proficiency, ranked #71 of 301 in MN (top 24%) — acceptable for families but not a draw, mixed tenant base, ~2y average lease.
- Market conditions: 392 active listings in the ZIP; 7 comparable units currently listed for rent nearby; rentals lingering (median 44d on market — plan ~5-8 weeks vacancy on turnover, expect pricing pressure); 57% of comp listings sitting > 30 days — soft ceiling on asking rent; 1,083 units permitted in Anoka County in 2024 (134 in 5+ unit buildings).
Forward outlook
- Local home prices are declining (-3.0%/yr); year-one equity from $3k of loan paydown is wiped out by about $11k of value loss. Plan a longer hold.
- Anoka County population projected at +11% by 2050 — modest demand growth; plan on rents tracking national, not racing it.
Negotiation context
- Only 11 days on market — expect competitive offers; lowballing is unlikely to land.
- 11 sale attempts since 22y ago with the ask held roughly flat each time — persistent listings suggest the price (not the market) is what's stuck; bring a comps-based counter.
- Current owner paid $220k; list at $368k implies a 67% gain — meaningful room to come down on a strong offer.
Questions for the listing agent
- What do current leases actually rent for vs. the listed asking? Can we see a recent rent roll and the last 12 months of T-12 income?
- What does the HOA fee cover, when was the last increase, and are there any pending special assessments or reserve-fund shortfalls?
- Is there a deadline driving the sale (1031 exchange, divorce, estate, relocation)? That informs how much negotiation room exists.
- Schools are A-rated — typically a magnet for longer-tenancy family renters. What's the average tenant stay here, and is there a school-zone premium baked into asking?
- The area grade is low — what's the realistic commute time and amenity access for the typical tenant pool here? Any planned neighborhood developments (good or bad) we should know about?
- What's the average days-on-market for RENTAL listings here right now (not sales)? A rising rental-DOM trend means longer vacancies and softer asking-rent achievability than the comps imply.
- What's the recent tenant-quality profile in this submarket — average credit score on applications, eviction rate, late-payment / NSF rate, and stable-employment percentage? A property-management company in the area should have these aggregated.
- How much new for-sale + rental construction is in the pipeline within 1–3 miles? Heavy new supply typically softens prices + rents 12–24 months out; constrained supply supports both.
Investment metrics
- 1% rule
- 0.75% ✗
- Cap rate
- 5.43%
- Cash-on-cash
- -3.07%
- DSCR
- 0.86
- GRM
- 11.2
CMA / ARV
No comps found within radius.
Projected returns pro-forma
-3.0% appreciation · 3.0% rent growth · sell at horizon
- IRR
- -21.4%
- Equity multiple
- 0.26×
- Total profit
- $-76,418
- Equity at exit
- $54,855
- IRR
- -15.1%
- Equity multiple
- 0.14×
- Total profit
- $-88,254
- Equity at exit
- $31,809
Cash invested: $103,012 (down + closing). Projections, not guarantees.
Landlord ↔ Tenant lean methodology
- Overall (STATE)
- 46 Balanced
- State Minnesota
- 46 Balanced · D+2
- County
- — inherits STATE
- City
- — inherits STATE
ZIP-level market 55304
- Active inventory
- 392
- Price-to-rent
- 11.2×
Monthly cashflow live
- Estimated rent
- $2,744 high interval (Pro) →
- Mortgage (P&I)
- −$1,929
- Tax from tax record
- −$228 /mo · $2,741/yr
- Insurance
- −$153
- HOA
- −$120
- Vacancy / Maint / Mgmt
- −$576
- Net cashflow
- $-263
Break-even live
UW: 25.0% down · 7.5% · 30yr · 1.5% tax · 5.0% vac · 8.0% maint · 8.0% mgmt
Financing live
Cash to close
- Down payment
- $91,975
- Closing costs
- $11,037
- Reserves months
- —
- Total cash needed
- —
Loan-product check · same deal, 3 products live
Conventional
25% down · 7.5% · 30yr
- Down + closing
- —
- Monthly P&I
- —
- Monthly cashflow
- —
- DSCR
- —
- Eligible?
- —
Personal DTI + credit; lowest rate.
DSCR
20% down · 8.5% · 30yr
- Down + closing
- —
- Monthly P&I
- —
- Monthly cashflow
- —
- DSCR
- —
- Eligible?
- —
No personal income docs; deal must DSCR.
Hard money
10% down · 12.0% · 12mo
- Down + closing
- —
- Monthly P&I
- —
- Monthly cashflow
- —
- DSCR
- —
- Eligible?
- —
Short-term bridge; refi at stabilization.
Rent comps 7 comps
| Address | Beds | Baths | Sqft | Rent | $/sqft | DOM | Units | Dist |
|---|---|---|---|---|---|---|---|---|
| 13310 Lily St NW Andover, MN | 4.0 | 2.0 | 2046 | $3,200 | $1.56 | 43d | 1 | 0.45mi |
| 13752 Round Lake Blvd NW Unit 1 Andover, MN | 3.0 | 1.0 | 1146 | $2,525 | $2.20 | 17d | 1 | 0.55mi |
| 3901 9th Ln Anoka, MN | 4.0 | 2.0 | 1936 | $1,995 | $1.03 | 43d | 1 | 1.01mi |
| 4321 141st Ln NW Andover, MN | 4.0 | 3.0 | 2080 | $3,100 | $1.49 | 43d | 1 | 1.37mi |
| 3130 Northdale Blvd NW Minneapolis, MN | 2.0 | 1.0–2.0 | 958 | $2,619 | $2.73 | 2d | 17 | 1.42mi |
| 2521 138th Ave NW Andover, MN | 3.0 | 2.0 | 1600 | $2,595 | $1.62 | 43d | 1 | 1.42mi |
| 3120 Northdale Blvd NW Minneapolis, MN | 3.0 | 1.0–2.0 | 1009 | $2,820 | $2.79 | 1d | 13 | 1.48mi |
HOA detail
- Monthly dues
- $120 · $1,440/yr
Listing history 9 events
-
2026-06-18days on market $367,900 Active 11 DOM
-
2026-06-17days on market $367,900 Active 10 DOM
-
2026-06-16days on market $367,900 Active 9 DOM
-
2026-06-15days on market $367,900 Active 8 DOM
-
2026-06-13days on market $367,900 Active 6 DOM
-
2026-06-13days on market $367,900 Active 5 DOM
-
2026-06-09days on market $367,900 Active 2 DOM
-
2026-06-08remarks 699-char remark
-
2026-06-08$367,900 Active 1 DOM
ⓘ Source: listings_history table (triggers on properties + properties_extension) + one-shot
backfill from property_details.listing_events for pre-trigger history.
Tax reassessment forecast MN · Partial reset (capped growth)
- Current annual tax
- $2,741 · $228/mo
- Projected year-2 tax
- $3,431 · $286/mo
- Expected delta
- +$690/yr (+$57/mo · 25.2%)
ⓘ Screening estimate from a state-policy table — verify with the county assessor before closing.
Climate risk First Street
- Flood 1/10 Low FEMA zone X (unshaded) · 0% chance over 30 yrs
- Wildfire 1/10 Low
- Heat 2/10 Low 7 d/yr ≥99°F today · 14 d/yr by 30 yrs out
- Wind 2/10 Low
- Air quality 2/10 Low 2 unhealthy d/yr today · 2 by 30 yrs out
Nearby sold comps map
Loading sold comps map…
Walkable amenities ~0.75 mi
Loading nearby amenities…
Taxation est. · year 1
- Rental income
- $32,926
- − Mortgage interest
- −$20,608
- − Property taxes
- −$2,741
- − Insurance
- −$1,840
- − Repairs & maintenance
- −$2,634
- − Management
- −$2,634
- − HOA
- −$1,440
- − Depreciation
- −$10,703
- Taxable loss
- −$9,673
- Est. tax savings @ 24.0%
- +$2,322
- After-tax cash flow
- $-839/yr
For passive investors: Depreciation is non-cash, so a rental often shows a tax loss while cash-flowing — sheltering income. Rental losses are passive: they offset passive income freely, and up to $25,000/yr can offset ordinary (W-2) income if you actively participate and your MAGI is under $100k (phasing out to $0 by $150k); unused losses carry forward. On sale, claimed depreciation is recaptured at up to 25%, and gains may owe capital-gains tax (a 1031 exchange can defer both). Figures are a year-1 estimate at your 24.0% rate — not tax advice; consult a CPA.
Schools (NCES district)
- District
- Anoka-Hennepin Public School District
- NCES district ID
- 2703180
- Math proficiency
- 49% ▼ -14.00%
- Reading proficiency
- 55% ▼ -10.00%
- Median HH income
- $73,837
- Composite
- 46.7/100
- National rank
- #2400
- State rank
- #71 of 301 in MN
Livability — Andover
- Score
- 72/100
- State rank
- #291
- US rank
- #6311
Category grades
Schools grade is shown separately in the Schools card above.
Census & demographics
- Census place
- Andover, MN
- Population (ZIP)
- 49,452
Population outlook (Anoka County) Hauer SSP2
- Today (2025)
- 375,223 people
- By 2030
- 387,850 · +3.4%
- By 2040
- 407,239 · +8.5%
- By 2050
- 417,541 · +11.3%
- By 2075
- 448,447 · +19.5%
- By 2100
- 464,954 · +23.9%
Race, ethnicity, and origin ACS 2023
- Neighborhood character
- Predominantly White (88%)
- Race & ethnicity
- White 88% Two or more races 4% Asian 3% Black 3% Hispanic / Latino 2%
- Common ancestry
- Portuguese 14% Romanian 6% Lithuanian 3%
- Foreign-born
- 5% · Canada
- Languages at home
- 94% English-only · Other Asian/Pacific 2% Spanish 1% Russian/Polish/Slavic 1%
Political lean MEDSL · Anoka
- 2024 margin
- Toss-up / Even · D 46.6% · R 51.0% · Other 2.4%
- 2008→2024 swing
- -2.0pp toward R · 2008: -2.4pp · 2024: -4.4pp
- All cycles
- 2024: R+4.4 2020: R+1.9 2016: R+9.7 2012: R+2.6 2008: R+2.4
Not yet ingested
- Civics
- —
Market trends
- HPI YoY
- ▼ -267.68%
- Current HPI
- 242.7122
- Rent YoY
- —
- Metro
- —
- State GDP YoY
- ▲ 2.41%
- F500 in state
- 34
Industry mix (Fortune 500 HQ in MN)
| Industry | F500 HQs | Revenue |
|---|---|---|
| Healthcare | 2 | $407B |
|
||
| Retail | 2 | $150B |
|
||
| Consumer Goods | 2 | $32B |
|
||
| Industrial Machinery | 2 | $6B |
|
||
| Agriculture | 1 | $40B |
|
||
| Healthcare / Medical Devices | 1 | $32B |
|
||
Price history
+29.1% since first listed28 events — show timeline
- 2026-06-05 Listed $367,900 NORTHSTARMLS as Distributed by MLS Grid
- 2026-03-23 Listed $367,900 NORTHSTARMLS as Distributed by MLS Grid
- 2026-03-06 Coming Soon — NORTHSTARMLS as Distributed by MLS Grid
- 2019-02-01 Sold (Public Records) $219,900 Public Records
- 2019-02-01 Sold (MLS) $219,900 NORTHSTARMLS as Distributed by MLS Grid
- 2019-01-04 Pending — NORTHSTARMLS as Distributed by MLS Grid
- 2018-12-24 Contingent — NORTHSTARMLS as Distributed by MLS Grid
- 2018-12-20 Relisted — NORTHSTARMLS as Distributed by MLS Grid
- 2018-12-19 Contingent — NORTHSTARMLS as Distributed by MLS Grid
- 2018-12-12 Listed $219,900 NORTHSTARMLS as Distributed by MLS Grid
- 2016-02-18 Sold (Public Records) $195,000 Public Records
- 2016-02-17 Sold (MLS) $195,000 NORTHSTARMLS as Distributed by MLS Grid
- 2016-01-21 Pending — NORTHSTARMLS as Distributed by MLS Grid
- 2016-01-20 Contingent — NORTHSTARMLS as Distributed by MLS Grid
- 2016-01-15 Listed $195,000 NORTHSTARMLS as Distributed by MLS Grid
- 2009-04-01 Sold (MLS) $137,500 NORTHSTARMLS as Distributed by MLS Grid
- 2009-02-04 Listing Removed — NORTHSTARMLS as Distributed by MLS Grid
- 2008-12-18 Listed $159,900 NORTHSTARMLS as Distributed by MLS Grid
- 2008-12-15 Listing Removed — NORTHSTARMLS as Distributed by MLS Grid
- 2008-11-18 Listed $169,900 NORTHSTARMLS as Distributed by MLS Grid
- 2008-10-25 Listing Removed — NORTHSTARMLS as Distributed by MLS Grid
- 2008-06-25 Listed $189,900 NORTHSTARMLS as Distributed by MLS Grid
- 2007-01-24 Listing Removed — NORTHSTARMLS as Distributed by MLS Grid
- 2006-09-14 Listed $299,900 NORTHSTARMLS as Distributed by MLS Grid
- 2006-09-09 Listing Removed — NORTHSTARMLS as Distributed by MLS Grid
- 2006-04-17 Listed $299,000 NORTHSTARMLS as Distributed by MLS Grid
- 2005-03-24 Listing Removed — NORTHSTARMLS as Distributed by MLS Grid
- 2004-09-23 Listed $284,900 NORTHSTARMLS as Distributed by MLS Grid
Property tax history
+3.0%/yrLatest (2026): $2,741 · +1.9% YoY. Source: county tax records.
Cash-flow waterfall
monthlySold comps — $/sqft
last 12 mo · ≤1 miLoading sold comps…