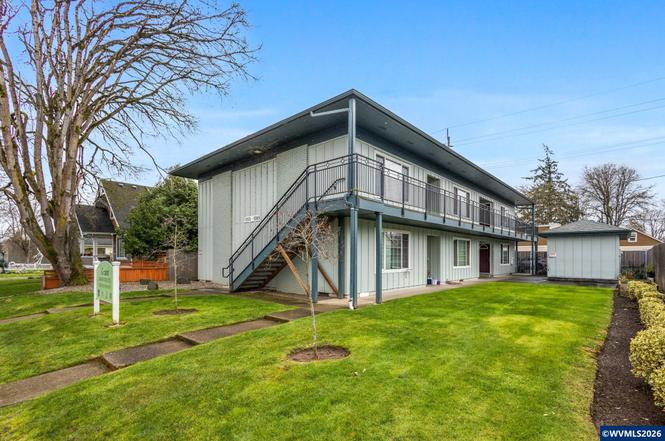
 6-Plex
1355 4th St NE · Salem, OR
Flood risk 1/10 · Minimal
- FEMA flood zone
- X (unshaded)
- Chance of flooding over 30 yrs
- 0.0%
- Est. flood insurance / yr
- $507 – $1,088
Fire risk 3/10 · Minor
- Est. fire insurance / yr
- $498 – $926
Heat risk 3/10 · Minor
- Hot days now (above 92°F)
- 7 days/yr
- Hot days in 30 yrs
- 14 days/yr
Wind risk 1/10 · Minimal
- Chance of severe wind over 30 yrs
- —
Air-quality risk 10/10 · Severe
- Unhealthy air days now
- 13 days/yr
- Unhealthy air days in 30 yrs
- 14 days/yr
Risk factors via First Street. Map © Google.
Why this score? — see what drove the C grade
The composite is a weighted blend of 9 inputs, each scored 0–100. Each bar is that input's sub-score; the figure is the points it added to the 100-point composite (weight × sub-score).
- Cash flow +16.3/30.0
- ARV discount +14.3/15.0
- DSCR +5.1/10.0
- Appreciation +5.0/10.0
- 1% rule +4.4/10.0
- Livability +4.0/5.0
- Schools +3.7/10.0
- Rent growth +2.5/5.0
- Condition / age +2.5/5.0
$799,900
🖨 Deal sheet 📄 Offer letter ✓ Due diligence
Multi-family units
County records classify this as Multi-Family (5+ Unit). Listing-text estimate: 6 units. confirmed
5+ unit building — per-unit beds/baths from public records are typically unavailable; the breakdown below (if shown) is an estimate from the listing text.
Listing remarks
Turnkey asset with major capital improvements already completed. The Grant Apartments is a well-maintained 6-plex with significant renovations completed in 2019–2020. Located in a predominantly residential neighborhood near essential services, this property offers strong tenant appeal and stable income potential. Interior upgrades include vinyl plank flooring throughout, updated kitchens with newer cabinets, countertops, fixtures, and appliances.
Key facts
- Updated kitchens
- Strong tenant appeal
- 8,134 sq ft lot
Tags
Property features AI
Finance
- Other: Lot dimensions approximately 66.4 x 122.5 (0.19 acres) with 66 ft frontage
- Financial info: Six-unit building (6 total units); Investment property named Grant Apartments
Exterior
- Parking: 8 paved parking spaces on site
- Utilities: City water; City sewer; Electric power and electric water heater
- Home design: Flat unit type (multi-family property); Property used as an investment; Exterior painted grey
- Construction: Built in 1968; Brick and wood siding with T111 siding style; Continuous foundation; Outbuildings present (refer to remarks)
- Exterior features: Professionally maintained grounds with mature trees, shrubs, and raised garden beds for tenant use; Fenced perimeter with privacy slats; Improved stormwater drainage; Landscaping in place; Signage on property
Interior
- Kitchen: Updated kitchens with newer cabinets, countertops, fixtures and included refrigerator; Electric range (range included)
- Bedrooms: Total of 12 bedrooms across the property (multi-unit)
- Flooring: Luxury vinyl plank; Carpet
- Heating & cooling: Electric heating
- Interior features: Luxury vinyl plank flooring throughout common areas; Carpet in select areas; Turnkey condition with significant renovations completed in 2019–2020
- Laundry & utility: Detached on-site laundry room; Laundry center in-unit or building (listed as Laundry Center); Electric water heater
Neighborhood map
What this means for you Summary
Snapshot
- This is a 6 × 2-bed/1.0-bath units multifamily listed at $800k.
Deal economics
- At list price, monthly cash flow is $443 ($5k/yr) — positive. Per door: $74/mo.
- The deal already cash-flows at list — no discount required.
- To meet the 1% rule (rent ≥ 1% of price), the offer needs to be $756k (5.5% below list).
- Recommended offer: $752k (6.0% below list) — sets the bar for market timing.
- Cap rate 7.0% vs local median 2.9% in Salem — top-decile yield for the area; either an underpriced asset or a hidden risk that comps aren't pricing in. Stress-test before assuming the spread holds.
Location & tenants
- Location reads 79/100 on livability (#59 in OR, #2,084 nationally) — a middle-class / working-renter tenant base. Strengths: amenities A+, commute A+, housing A+; Watch: crime F.
- Salem-Keizer SD 24J (urban): math 34% / reading 47% proficiency, ranked #103 of 183 in OR (top 56%) — families likely to look elsewhere, expect single-tenant / working-renter base with shorter leases.
- Zoned schools: Grant Community School (424 students, 72% FRL); North Salem High School (2,239 students, 74% FRL) — zoned schools average 73% FRL vs 53% district-wide (20 pts higher); higher-poverty schools than district average — tighter screening recommended.
- Market conditions: 1 active listings in the ZIP; 1,591 units permitted in Marion County in 2024 (716 in 5+ unit buildings).
Forward outlook
- In year one you build about $30k of equity ($6k loan paydown + $24k appreciation (3.0% local appreciation)).
- Marion County population projected at +17% by 2050 — long-run rental-demand tailwind backs the buy-and-hold thesis.
- At projected returns (3.0% appreciation + 3.0% rent growth), your $224k cash investment doubles in ~6 years — after that, you're playing with house money.
- By year 2, paydown + projected appreciation supports a ~$48k cash-out refi (75% LTV) — recoverable capital for the next deal without selling this one.
Negotiation context
- It's been on market 69 days — a 6% lower offer ($752k) is reasonable based on typical stale-listing flexibility.
- 2 sale attempts with the ask held roughly flat each time — persistent listings suggest the price (not the market) is what's stuck; bring a comps-based counter.
- Current owner paid $175k; list at $800k implies a 357% gain — meaningful room to come down on a strong offer.
Questions for the listing agent
- It's been on market 69 days. Have you received any prior offers? Is the seller open to a 6% concession, seller financing, or rate buy-down credit?
- Can we see the unit-by-unit rent roll, current vacancy, and any below-market leases? What's the average tenancy length?
- What capital expenditures (roof, boiler, parking lot, exteriors) have been made in the last 5 years, and what's planned in the next 2?
- Built in 1968 — when were the roof, HVAC, electrical panel, plumbing, and water heater last replaced?
- Why hasn't it sold? Are there any deal-killer items the seller is aware of (foundation, flood, title, zoning, code violations)?
- Is there a deadline driving the sale (1031 exchange, divorce, estate, relocation)? That informs how much negotiation room exists.
- Schools are D-rated, which usually means shorter tenancies and higher turnover. Who's the typical renter profile here, and what's been the actual vacancy rate?
- Crime grade is F in this area — have there been break-ins, vandalism, or insurance claims at this property in the last 3 years? What carrier currently insures it and at what premium?
- What's the average days-on-market for RENTAL listings here right now (not sales)? A rising rental-DOM trend means longer vacancies and softer asking-rent achievability than the comps imply.
- What's the recent tenant-quality profile in this submarket — average credit score on applications, eviction rate, late-payment / NSF rate, and stable-employment percentage? A property-management company in the area should have these aggregated.
- How much new apartment / multifamily construction is in the pipeline within 1–3 miles? Heavy new supply (>2% of stock underway) typically softens rents 12–24 months out; light construction supports rent growth.
Investment metrics
- 1% rule
- 0.94% ✗
- Cap rate
- 6.96%
- Cash-on-cash
- 2.37%
- DSCR
- 1.11
- GRM
- 8.8
CMA / ARV
- ARV (on-the-fly)
- $943,092
- Comps found
- 2
Show comp detail 2 sales within ~0.75 mi
| Address | Dist | Beds/Ba | Sqft | Sold | Price | $/sf | Match |
|---|---|---|---|---|---|---|---|
| 1710 Capitol St NE | 0.57mi | 11/7.0 (-1) | 4,800 (+2%) | 12mo | $960,000 | $200 | 51 |
| 1900 Laurel Ave NE | 0.51mi | 12/4.0 | 4,376 (-7%) | 19mo | $880,000 | $201 | 41 |
Match score weights: distance 35% · size 25% · config 20% · recency 20%. Top-matched comps best support the ARV.
Projected returns pro-forma
3.0% appreciation · 3.0% rent growth · sell at horizon
- IRR
- 9.7%
- Equity multiple
- 1.56×
- Total profit
- $124,682
- Equity at exit
- $359,670
- IRR
- 12.1%
- Equity multiple
- 2.81×
- Total profit
- $404,604
- Equity at exit
- $554,294
Cash invested: $223,972 (down + closing). Projections, not guarantees.
Landlord ↔ Tenant lean methodology
- Overall (STATE)
- 28 Tenant-Leaning
- State Oregon
- 28 Tenant-Leaning · D+6
- County
- — inherits STATE
- City
- — inherits STATE
ZIP-level market 97301-6463
- Active inventory
- 1
- Price-to-rent
- 52.9×
Monthly cashflow live
- Estimated rent
- $7,558 high interval (Pro) →
- Mortgage (P&I)
- −$4,195
- Tax est. 1.5%
- −$1,000 /mo · $11,998/yr
- Insurance
- −$333
- HOA
- −$0
- Vacancy / Maint / Mgmt
- −$1,587
- Net cashflow
- $443
Break-even live
6-unit breakdown (identical units grouped — click to expand)
| Units | Beds | Baths | Est. rent |
|---|---|---|---|
| 6× units | 2 | 1 | $7,560 |
| #1 | 2 | 1 | $1,260 |
| #2 | 2 | 1 | $1,260 |
| #3 | 2 | 1 | $1,260 |
| #4 | 2 | 1 | $1,260 |
| #5 | 2 | 1 | $1,260 |
| #6 | 2 | 1 | $1,260 |
| Total (6 units) | $7,558 | ||
UW: 25.0% down · 7.5% · 30yr · 1.5% tax · 5.0% vac · 8.0% maint · 8.0% mgmt
Financing live
Cash to close
- Down payment
- $199,975
- Closing costs
- $23,997
- Reserves months
- —
- Total cash needed
- —
Loan-product check · same deal, 3 products live
Conventional
25% down · 7.5% · 30yr
- Down + closing
- —
- Monthly P&I
- —
- Monthly cashflow
- —
- DSCR
- —
- Eligible?
- —
Personal DTI + credit; lowest rate.
DSCR
20% down · 8.5% · 30yr
- Down + closing
- —
- Monthly P&I
- —
- Monthly cashflow
- —
- DSCR
- —
- Eligible?
- —
No personal income docs; deal must DSCR.
Hard money
10% down · 12.0% · 12mo
- Down + closing
- —
- Monthly P&I
- —
- Monthly cashflow
- —
- DSCR
- —
- Eligible?
- —
Short-term bridge; refi at stabilization.
Listing history 7 events
-
2026-04-30status Pending
-
2026-04-28status Active
-
2026-03-09historical Active under Contract
-
2026-02-20$799,900 Active
-
2001-04-27soldstatus $175,000
-
1998-09-10soldstatus $195,000
-
1991-08-28soldstatus $145,900
ⓘ Source: listings_history table (triggers on properties + properties_extension) + one-shot
backfill from property_details.listing_events for pre-trigger history.
Climate risk First Street
- Flood 1/10 Low FEMA zone X (unshaded) · 0% chance over 30 yrs
- Wildfire 3/10 Moderate
- Heat 3/10 Moderate 7 d/yr ≥92°F today · 14 d/yr by 30 yrs out
- Wind 1/10 Low
- Air quality 10/10 Extreme 13 unhealthy d/yr today · 14 by 30 yrs out
Nearby sold comps map
Loading sold comps map…
Walkable amenities ~0.75 mi
Loading nearby amenities…
Taxation est. · year 1
- Rental income
- $90,696
- − Mortgage interest
- −$44,807
- − Property taxes
- −$11,998
- − Insurance
- −$4,000
- − Repairs & maintenance
- −$7,256
- − Management
- −$7,256
- − Depreciation
- −$23,270
- Taxable loss
- −$7,890
- Est. tax savings @ 24.0%
- +$1,894
- After-tax cash flow
- $7,208/yr
For passive investors: Depreciation is non-cash, so a rental often shows a tax loss while cash-flowing — sheltering income. Rental losses are passive: they offset passive income freely, and up to $25,000/yr can offset ordinary (W-2) income if you actively participate and your MAGI is under $100k (phasing out to $0 by $150k); unused losses carry forward. On sale, claimed depreciation is recaptured at up to 25%, and gains may owe capital-gains tax (a 1031 exchange can defer both). Figures are a year-1 estimate at your 24.0% rate — not tax advice; consult a CPA.
Schools (NCES district)
- District
- Salem-Keizer SD 24J
- NCES district ID
- 4110820
- Math proficiency
- 34% ▼ -1.00%
- Reading proficiency
- 47% ▼ -2.00%
- Median HH income
- $48,632
- Composite
- 37.16/100
- National rank
- #9017
- State rank
- #103 of 183 in OR
Livability — Salem
- Score
- 79/100
- State rank
- #59
- US rank
- #2084
Category grades
Schools grade is shown separately in the Schools card above.
Census & demographics
- Census place
- Salem, OR
Population outlook (Marion County) Hauer SSP2
- Today (2025)
- 360,940 people
- By 2030
- 375,178 · +3.9%
- By 2040
- 400,914 · +11.1%
- By 2050
- 422,187 · +17.0%
- By 2075
- 460,305 · +27.5%
- By 2100
- 464,025 · +28.6%
Not yet ingested
- Political lean
- —
- Race & ethnicity
- —
- Common origin
- —
- Civics
- —
Market trends
- HPI YoY
- —
- Current HPI
- —
- Rent YoY
- —
- Metro
- —
- State GDP YoY
- ▲ 2.05%
- F500 in state
- 2
Industry mix (Fortune 500 HQ in OR)
| Industry | F500 HQs | Revenue |
|---|---|---|
| Consumer Goods | 1 | $51B |
|
||
Price history
+448.3% since first listed7 events — show timeline
- 2026-04-30 Pending — WVMLS
- 2026-04-28 Relisted — WVMLS
- 2026-03-09 Contingent — WVMLS
- 2026-02-20 Listed $799,900 WVMLS
- 2001-04-27 Sold (Public Records) $175,000 Public Records
- 1998-09-10 Sold (Public Records) $195,000 Public Records
- 1991-08-28 Sold (Public Records) $145,900 Public Records
Cash-flow waterfall
monthlySold comps — $/sqft
last 12 mo · ≤1 miLoading sold comps…