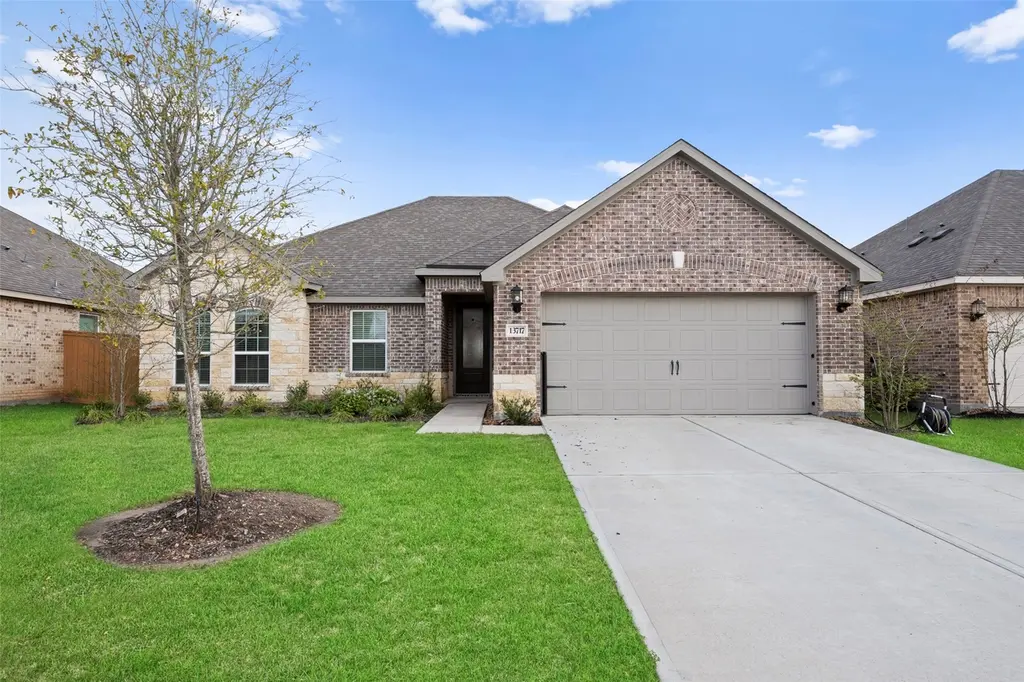
13717 Gaff Rig Dr · Texas City, TX
Flood risk 5/10 · Moderate
- FEMA flood zone
- X (unshaded)
- Chance of flooding over 30 yrs
- 0.67%
- Est. flood insurance / yr
- $507 – $1,088
Fire risk 4/10 · Minor
- Est. fire insurance / yr
- $1,222 – $2,270
Heat risk 10/10 · Severe
- Hot days now (above 109°F)
- 7 days/yr
- Hot days in 30 yrs
- 24 days/yr
Wind risk 9/10 · Severe
- Chance of severe wind over 30 yrs
- 99.0%
Air-quality risk 2/10 · Minimal
- Unhealthy air days now
- 1 days/yr
- Unhealthy air days in 30 yrs
- 1 days/yr
Risk factors via First Street. Map © Google.
Why this score? — see what drove the D grade
The composite is a weighted blend of 9 inputs, each scored 0–100. Each bar is that input's sub-score; the figure is the points it added to the 100-point composite (weight × sub-score).
- ARV discount +13.7/15.0
- Cash flow +9.1/30.0
- Condition / age +4.0/5.0
- Schools +3.5/10.0
- 1% rule +3.3/10.0
- Livability +3.1/5.0
- DSCR +2.6/10.0
- Rent growth +2.5/5.0
- Appreciation +0.0/10.0
$285,000
🖨 Deal sheet (PDF) 📄 Offer letter ✓ Due diligence
Listing remarks MLS
Welcome to 13717 Gaff Rig Drive, a thoughtfully designed one-story home with 3 bedrooms and 2 bathrooms featuring a desirable split floor plan. The chef-ready kitchen showcases granite countertops and a center island, opening seamlessly to the main living area, while a formal dining room provides a dedicated space for gatherings. Luxury Vinyl Plank flooring extends through the main living areas, bathrooms, and primary bedroom for a clean, modern look and easy maintenance. The primary suite features a spacious en-suite bathroom with dual vanities, a separate soaking tub and shower and two walk-in closets. Both secondary bedrooms also include walk-in closets. Enjoy outdoor relaxation on the covered patio with no back neighbors, offering privacy. Conveniently located near shopping, dining, and major roadways. Located in the Lago Mar community featuring a 12-acre Crystal Lagoon, playground, splash pad, pool, scenic trails, and golf cart-friendly streets. Schedule your private tour today.
Key facts
- Formal dining room
- Granite countertops
- Chef ready kitchen
Tags
Neighborhood map
What this means for you Summary
Snapshot
- This is a 3-bed/2.0-bath single-family listed at $285k. Condition is rated good.
Deal economics
- At list price, monthly cash flow is $-217 ($-3k/yr) — negative.
- To cash-flow at today's rent, offer at most $254k (11.0% below list).
- To meet the 1% rule (rent ≥ 1% of price), the offer needs to be $238k (16.6% below list).
- Recommended offer: $238k (16.6% below list) — sets the bar for 1% rule.
- Cap rate 5.4% vs local median 4.3% in Texas City — meaningfully above typical; check what's discounted (condition, days-on-market, listing class) to confirm the premium yield is real.
Location & tenants
- Location reads 62/100 on livability (#907 in TX) — a middle-class / working-renter tenant base. Strengths: cost of living A+, housing A+; Watch: crime D+, amenities F, commute F.
- Dickinson ISD (suburban): math 39% / reading 40% proficiency, ranked #366 of 826 in TX (top 44%) — families likely to look elsewhere, expect single-tenant / working-renter base with shorter leases; 60% free/reduced lunch — lower-income household profile, screen leases tightly.
- Zoned schools: Hughes Road El (math 36% / reading 31%, grade F, #2,174 of 4,322 statewide, top 51%, 707 students, 67% FRL); Dunbar Middle (math 25% / reading 20%, grade F, #1,341 of 1,662 statewide, top 82%, 654 students, 78% FRL); Dickinson H S (math 30% / reading 46%, grade F, #880 of 1,632 statewide, top 54%, 3,619 students, 64% FRL).
- Market conditions: 236 active listings in the ZIP; 5 comparable units currently listed for rent nearby; rentals leasing fast (median 14d on market — plan ~1-2 weeks tenant-placement turnaround); 3,258 units permitted in Galveston County in 2024 (0 in 5+ unit buildings).
Forward outlook
- Local home prices are declining (-3.0%/yr); year-one equity from $2k of loan paydown is wiped out by about $9k of value loss. Plan a longer hold.
- Galveston County population projected at +43% by 2050 — long-run rental-demand tailwind backs the buy-and-hold thesis.
Negotiation context
- It's been on market 100 days — a 9% lower offer ($259k) is reasonable based on typical stale-listing flexibility.
Risks & watch-outs
- Climate carrying-cost: moderate flood risk; severe wind risk, 99% chance of damaging wind over 30y; extreme-heat days projected 7→24/yr by 2055 (HVAC capex compounding) — expect insurance premiums to compound above CPI over the hold.
Questions for the listing agent
- What do current leases actually rent for vs. the listed asking? Can we see a recent rent roll and the last 12 months of T-12 income?
- It's been on market 100 days. Have you received any prior offers? Is the seller open to a 17% concession, seller financing, or rate buy-down credit?
- What does the HOA fee cover, when was the last increase, and are there any pending special assessments or reserve-fund shortfalls?
- Why hasn't it sold? Are there any deal-killer items the seller is aware of (foundation, flood, title, zoning, code violations)?
- Is there a deadline driving the sale (1031 exchange, divorce, estate, relocation)? That informs how much negotiation room exists.
- Schools are F-rated, which usually means shorter tenancies and higher turnover. Who's the typical renter profile here, and what's been the actual vacancy rate?
- Crime grade is D in this area — have there been break-ins, vandalism, or insurance claims at this property in the last 3 years? What carrier currently insures it and at what premium?
- The area grade is low — what's the realistic commute time and amenity access for the typical tenant pool here? Any planned neighborhood developments (good or bad) we should know about?
- What's the average days-on-market for RENTAL listings here right now (not sales)? A rising rental-DOM trend means longer vacancies and softer asking-rent achievability than the comps imply.
- What's the recent tenant-quality profile in this submarket — average credit score on applications, eviction rate, late-payment / NSF rate, and stable-employment percentage? A property-management company in the area should have these aggregated.
- How much new for-sale + rental construction is in the pipeline within 1–3 miles? Heavy new supply typically softens prices + rents 12–24 months out; constrained supply supports both.
Investment metrics
- 1% rule
- 0.83% ✗
- Cap rate
- 5.38%
- Cash-on-cash
- -3.26%
- DSCR
- 0.86
- GRM
- 10.0
CMA / ARV
- ARV (median comp)
- $330,736
- List price
- $285,000
- Delta
- -13.83%
- Verdict
- UNDERPRICED
- Comps
- 20 within 1.0 mi
Show comp detail 12 sales within ~0.75 mi
| Address | Dist | Beds/Ba | Sqft | Sold | Price | $/sf | Match |
|---|---|---|---|---|---|---|---|
| 3026 Banyan Dr | 0.13mi | 3/2.0 | 1,850 (-0%) | 1mo | $345,900 | $187 | 93 |
| 13714 Ballast Green Dr | 0.34mi | 3/2.0 | 1,738 (-6%) | 1mo | $344,560 | $198 | 73 |
| 13525 Bonita Island Way | 0.57mi | 3/2.0 | 1,900 (+2%) | 1mo | $288,900 | $152 | 68 |
| 13421 Diamond Reef Ln | 0.70mi | 3/2.0 | 1,900 (+2%) | 1mo | $284,900 | $150 | 62 |
| 14117 Baikal Manor Dr | 0.30mi | 4/2.0 (+1) | 2,063 (+11%) | 1mo | $312,990 | $152 | 61 |
| 13926 Baikal Manor Dr | 0.43mi | 3/2.0 | 1,619 (-13%) | 1mo | $305,990 | $189 | 58 |
| 2211 Manila Ln | 0.63mi | 4/3.0 (+1) | 1,817 (-2%) | 1mo | $295,000 | $162 | 58 |
| 2917 Mariner Island Dr | 0.69mi | 4/2.0 (+1) | 1,922 (+4%) | 1mo | $360,990 | $188 | 56 |
| 13714 Seneca Lake Dr | 0.63mi | 4/2.0 (+1) | 2,020 (+9%) | 1mo | $291,400 | $144 | 50 |
| 13705 Sorico Bay Dr | 0.55mi | 4/2.0 (+1) | 1,635 (-12%) | 0mo | $268,400 | $164 | 50 |
| 2921 Mariner Island Dr | 0.69mi | 4/2.0 (+1) | 2,081 (+12%) | 1mo | $375,990 | $181 | 42 |
| 13544 Diamond Reef Ln | 0.70mi | 4/2.0 (+1) | 1,635 (-12%) | 1mo | $284,900 | $174 | 42 |
Match score weights: distance 35% · size 25% · config 20% · recency 20%. Top-matched comps best support the ARV.
Projected returns pro-forma
-3.0% appreciation · 3.0% rent growth · sell at horizon
- IRR
- -21.7%
- Equity multiple
- 0.25×
- Total profit
- $-59,859
- Equity at exit
- $42,494
- IRR
- -15.3%
- Equity multiple
- 0.13×
- Total profit
- $-69,423
- Equity at exit
- $24,642
Cash invested: $79,800 (down + closing). Projections, not guarantees.
Landlord ↔ Tenant lean methodology
- Overall (STATE)
- 87 Strongly Landlord-Friendly
- State Texas
- 87 Strongly Landlord-Friendly · R+5
- County
- — inherits STATE
- City
- — inherits STATE
ZIP-level market 77510
- Home prices YoY
- -15.3%
- Active inventory
- 236
- Price-to-rent
- 10.0×
Monthly cashflow live
- Estimated rent
- $2,377 high interval (Pro) →
- Mortgage (P&I)
- −$1,495
- Tax est. 1.5%
- −$356 /mo · $4,275/yr
- Insurance
- −$119
- HOA
- −$125
- Vacancy / Maint / Mgmt
- −$499
- Net cashflow
- $-217
Break-even live
Sensitivity live
| Price | -10% $-20 | -5% $-118 | +0% $-217 | +5% $-315 | +10% $-413 |
|---|---|---|---|---|---|
| Rent | -10% $-404 | -5% $-310 | +0% $-217 | +5% $-123 | +10% $-29 |
| Rate | -1.0pp $-73 | -0.5pp $-144 | base $-217 | +0.5pp $-290 | +1.0pp $-365 |
UW: 25.0% down · 7.5% · 30yr · 1.5% tax · 5.0% vac · 8.0% maint · 8.0% mgmt
Financing live
Cash to close
- Down payment
- $71,250
- Closing costs
- $8,550
- Reserves months
- —
- Total cash needed
- —
Loan-product check · same deal, 3 products live
Conventional
25% down · 7.5% · 30yr
- Down + closing
- —
- Monthly P&I
- —
- Monthly cashflow
- —
- DSCR
- —
- Eligible?
- —
Personal DTI + credit; lowest rate.
DSCR
20% down · 8.5% · 30yr
- Down + closing
- —
- Monthly P&I
- —
- Monthly cashflow
- —
- DSCR
- —
- Eligible?
- —
No personal income docs; deal must DSCR.
Hard money
10% down · 12.0% · 12mo
- Down + closing
- —
- Monthly P&I
- —
- Monthly cashflow
- —
- DSCR
- —
- Eligible?
- —
Short-term bridge; refi at stabilization.
Rent comps 5 comps
| Address | Beds | Baths | Sqft | Rent | $/sqft | DOM | Units | Dist |
|---|---|---|---|---|---|---|---|---|
| 13817 Starboard Reach Dr Santa Fe, TX | 3.0–4.0 | 2.0–3.5 | 2268 | $2,445 | $1.08 | 0d | 1 | 0.16mi |
| 6136 Lago Mar Blvd Dickinson, TX | 3.0 | 2.0 | 1417 | $1,900 | $1.34 | 45d | 1 | 1.17mi |
| 6130 Lago Mar Blvd Texas City, TX | 1.0–3.0 | 1.0–2.0 | 1066 | $2,199 | $2.06 | 5d | 2 | 1.31mi |
| 640 Totem Trail Dr La Marque, TX | 4.0 | 2.5 | 2134 | $2,309 | $1.08 | 13d | 1 | 1.32mi |
| 12524 Jetty Cv Santa Fe, TX | 3.0 | 2.0 | 1803 | $2,506 | $1.39 | 24d | 1 | 1.33mi |
HOA detail
- Monthly dues
- $125 · $1,500/yr
- Likely covers
- pool
Listing history 16 events
-
2026-06-21days on market $285,000 Active 100 DOM
-
2026-06-18days on market $285,000 Active 97 DOM
-
2026-06-17days on market $285,000 Active 96 DOM
-
2026-06-16days on market $285,000 Active 95 DOM
-
2026-06-15days on market $285,000 Active 94 DOM
-
2026-06-13days on market $285,000 Active 92 DOM
-
2026-06-09days on market $285,000 Active 88 DOM
-
2026-06-08days on market $285,000 Active 87 DOM
-
2026-06-07days on market $285,000 Active 86 DOM
-
2026-06-04days on market $285,000 Active 83 DOM
-
2026-06-03days on market $285,000 Active 82 DOM
-
2026-06-02days on market $285,000 Active 81 DOM
-
2026-06-02price $285,000 Active 80 DOM
-
2026-06-01days on market $299,900 Active 80 DOM
-
2026-05-31days on market $299,900 Active 79 DOM
-
2026-03-13$299,900 Active 1000-char remark
Show marketing remark (1000 chars)
Welcome to 13717 Gaff Rig Drive, a thoughtfully designed one-story home with 3 bedrooms and 2 bathrooms featuring a desirable split floor plan. The chef-ready kitchen showcases granite countertops and a center island, opening seamlessly to the main living area, while a formal dining room provides a dedicated space for gatherings. Luxury Vinyl Plank flooring extends through the main living areas, bathrooms, and primary bedroom for a clean, modern look and easy maintenance. The primary suite features a spacious en-suite bathroom with dual vanities, a separate soaking tub and shower and two walk-in closets. Both secondary bedrooms also include walk-in closets. Enjoy outdoor relaxation on the covered patio with no back neighbors, offering privacy. Conveniently located near shopping, dining, and major roadways. Located in the Lago Mar community featuring a 12-acre Crystal Lagoon, playground, splash pad, pool, scenic trails, and golf cart-friendly streets. Schedule your private tour today.
ⓘ Source: listings_history table (triggers on properties + properties_extension) + one-shot
backfill from property_details.listing_events for pre-trigger history.
Climate risk First Street
- Flood 5/10 Major FEMA zone X (unshaded) · 67% chance over 30 yrs
- Wildfire 4/10 Moderate
- Heat 10/10 Extreme 7 d/yr ≥109°F today · 24 d/yr by 30 yrs out
- Wind 9/10 Extreme 99% chance of damaging wind over 30 yrs
- Air quality 2/10 Low 1 unhealthy d/yr today · 1 by 30 yrs out
Nearby sold comps map
Loading sold comps map…
Walkable amenities ~0.75 mi
Loading nearby amenities…
Taxation est. · year 1
- Rental income
- $28,527
- − Mortgage interest
- −$15,964
- − Property taxes
- −$4,275
- − Insurance
- −$1,425
- − Repairs & maintenance
- −$2,282
- − Management
- −$2,282
- − HOA
- −$1,500
- − Depreciation
- −$8,291
- Taxable loss
- −$7,492
- Est. tax savings @ 24.0%
- +$1,798
- After-tax cash flow
- $-800/yr
For passive investors: Depreciation is non-cash, so a rental often shows a tax loss while cash-flowing — sheltering income. Rental losses are passive: they offset passive income freely, and up to $25,000/yr can offset ordinary (W-2) income if you actively participate and your MAGI is under $100k (phasing out to $0 by $150k); unused losses carry forward. On sale, claimed depreciation is recaptured at up to 25%, and gains may owe capital-gains tax (a 1031 exchange can defer both). Figures are a year-1 estimate at your 24.0% rate — not tax advice; consult a CPA.
Condition & rehab AI · 12 photos
This single-story home is in excellent condition with a thoughtfully designed layout and modern finishes. It is move-in ready and would benefit from a fresh coat of paint on the exterior brick to enhance curb appeal.
Value-add opportunities
- Resale Paint exterior brick — Enhances curb appeal and can increase property value
- Rental Replace outdoor furniture — Improves rental appeal and comfort for tenants
Renovation cost estimate screening
Value-add ROI direction
- Resale Paint exterior brick — Enhances curb appeal and can increase property value ↑
- Rental Replace outdoor furniture — Improves rental appeal and comfort for tenants ↑
ⓘ Cost ranges are severity-bucket heuristics (US national rule-of-thumb). Get contractor quotes + a written scope before underwriting a rehab budget.
Schools (NCES district)
- District
- Dickinson ISD
- NCES district ID
- 4817070
- Math proficiency
- 39% ▼ -11.00%
- Reading proficiency
- 40% ▼ -2.00%
- Median HH income
- $61,318
- Composite
- 35.16/100
- National rank
- #5005
- State rank
- #366 of 826 in TX
Livability — Texas City
- Score
- 62/100
- State rank
- #907
- US rank
- #16268
Category grades
Schools grade is shown separately in the Schools card above.
Census & demographics
- Census place
- Texas City, TX
- City population
- 49,936
- Population (ZIP)
- 13,938
Population outlook (Galveston County) Hauer SSP2
- Today (2025)
- 390,640 people
- By 2030
- 425,226 · +8.9%
- By 2040
- 493,765 · +26.4%
- By 2050
- 559,698 · +43.3%
- By 2075
- 719,260 · +84.1%
- By 2100
- 819,628 · +109.8%
Race, ethnicity, and origin ACS 2023
- Neighborhood character
- Predominantly White (72%)
- Race & ethnicity
- White 72% Hispanic / Latino 21% Two or more races 17% Asian 2%
- Hispanic origin (detail)
- Mexican 14% Puerto Rican 3% Cuban 1%
- Common ancestry
- Lithuanian 4% Italian 3% Slovak 1%
- Foreign-born
- 5% · Canada
- Languages at home
- 89% English-only · Spanish 10% Tagalog/Filipino 1%
Political lean MEDSL · Galveston
- 2024 margin
- Strong R (+27.4) · D 35.7% · R 63.1% · Other 1.2%
- 2008→2024 swing
- -7.9pp toward R · 2008: -19.5pp · 2024: -27.4pp
- All cycles
- 2024: R+27.4 2020: R+22.6 2016: R+22.6 2012: R+26.9 2008: R+19.5
Not yet ingested
- Civics
- —
Market trends
- HPI YoY
- ▼ -54.15%
- Current HPI
- 299.2228
- Rent YoY
- —
- Metro
- —
- State GDP YoY
- ▲ 3.95%
- F500 in state
- 110
Industry mix (Fortune 500 HQ in TX)
| Industry | F500 HQs | Revenue |
|---|---|---|
| Energy | 16 | $1,198B |
|
||
| Technology | 5 | $198B |
|
||
| Engineering / Construction | 4 | $72B |
|
||
| Energy Services | 3 | $60B |
|
||
| Utilities | 3 | $41B |
|
||
| Healthcare | 2 | $330B |
|
||
Price history
1 event — show timeline
- 2026-03-13 Listed $299,900 HARMLS
Cash-flow waterfall
monthlySold comps — $/sqft
last 12 mo · ≤1 miLoading sold comps…