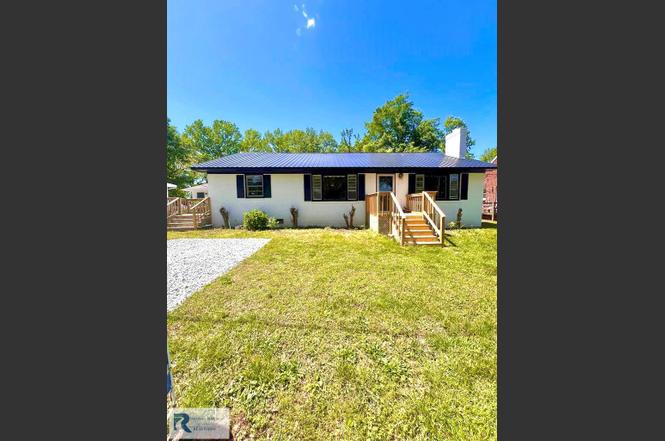
221 Atwater St · Yanceyville, NC
Flood risk 1/10 · Minimal
- FEMA flood zone
- X (unshaded)
- Chance of flooding over 30 yrs
- 0.0%
- Est. flood insurance / yr
- $507 – $1,088
Fire risk 3/10 · Minor
- Est. fire insurance / yr
- $906 – $1,684
Heat risk 6/10 · Moderate
- Hot days now (above 108°F)
- 7 days/yr
- Hot days in 30 yrs
- 17 days/yr
Wind risk 4/10 · Minor
- Chance of severe wind over 30 yrs
- 12.0%
Air-quality risk 2/10 · Minimal
- Unhealthy air days now
- 1 days/yr
- Unhealthy air days in 30 yrs
- 2 days/yr
Risk factors via First Street. Map © Google.
Why this score? — see what drove the D- grade
The composite is a weighted blend of 9 inputs, each scored 0–100. Each bar is that input's sub-score; the figure is the points it added to the 100-point composite (weight × sub-score).
- Cash flow +9.0/30.0
- Appreciation +7.9/10.0
- ARV discount +7.5/15.0
- Livability +3.4/5.0
- DSCR +2.5/10.0
- Rent growth +2.5/5.0
- Schools +2.5/10.0
- Condition / age +2.5/5.0
- 1% rule +1.7/10.0
$199,900
🖨 Deal sheet (PDF) 📄 Offer letter ✓ Due diligence
Listing remarks MLS
Freshly renovated beautiful home. This home has a new metal roof, nice laminate and hardwood floors Throughout. Comes with a new oven and refrigerator. New second bath adds the room your family needs. Located in the heart of Yanceyville, close to BYHS and convenient to everything downtown. A must see!
Key facts
- New metal roof
- New second bath
- 0.24 acre lot
Tags
Property features AI
Finance
- HOA & community: No homeowners association
Exterior
- Parking: Gravel parking
- Security: Smoke detector(s)
- Utilities: Public water; Public sewer; Gas water heater
- Home design: Single-story house; Stick/site-built construction; Existing structure; Built in 1956; Living room fireplace
- Construction: Brick construction; Crawl space foundation
- Exterior features: City lot; Public maintained road
Interior
- Kitchen: Gas water heater
- Bedrooms: Primary on main
- Flooring: Laminate flooring; Wood flooring
- Bathrooms: 2 full bathrooms
- Heating & cooling: Heat pump; Natural gas heating; Central air conditioning
- Interior features: Primary bedroom located on the main level; Attic access only; Ceiling fan(s)
- Laundry & utility: Washer hookup; Dryer connection
Neighborhood map
What this means for you Summary
Snapshot
- This is a 2-bed/1.5-bath single-family listed at $200k.
Deal economics
- At list price, monthly cash flow is $-158 ($-2k/yr) — negative.
- To cash-flow at today's rent, offer at most $172k (14.0% below list).
- To meet the 1% rule (rent ≥ 1% of price), the offer needs to be $135k (32.6% below list).
- Recommended offer: $135k (32.6% below list) — sets the bar for 1% rule.
- Cap rate 5.3% vs local median 3.6% in Yanceyville — top-decile yield for the area; either an underpriced asset or a hidden risk that comps aren't pricing in. Stress-test before assuming the spread holds.
Location & tenants
- Location reads 68/100 on livability (#179 in NC) — a middle-class / working-renter tenant base. Strengths: cost of living A+, health & safety A+, crime B+; Watch: schools F, amenities F, commute F.
- Caswell County Schools (rural): math 24% / reading 37% proficiency, ranked #146 of 178 in NC (top 82%) — families likely to look elsewhere, expect single-tenant / working-renter base with shorter leases; 61% free/reduced lunch — lower-income household profile, screen leases tightly.
- Market conditions: 23 active listings in the ZIP; 54 units permitted in Caswell County in 2024 (0 in 5+ unit buildings).
Forward outlook
- In year one you build about $13k of equity ($1k loan paydown + $11k appreciation (5.7% local appreciation)).
- Caswell County population projected at -27% by 2050 — secular population decline; favor cash flow + early exit over multi-decade hold.
- By year 3, paydown + projected appreciation supports a ~$32k cash-out refi (75% LTV) — recoverable capital for the next deal without selling this one.
Negotiation context
- It's been on market 118 days — a 9% lower offer ($182k) is reasonable based on typical stale-listing flexibility.
- 4 sale attempts since 14y ago with the ask held roughly flat each time — persistent listings suggest the price (not the market) is what's stuck; bring a comps-based counter.
- Current owner paid $30k; list at $200k implies a 566% gain — meaningful room to come down on a strong offer.
Risks & watch-outs
- Watch-outs: built in 1956 — expect roof / HVAC / electrical / plumbing capex.
- Climate carrying-cost: extreme-heat days projected 7→17/yr by 2055 (HVAC capex compounding) — expect insurance premiums to compound above CPI over the hold.
Questions for the listing agent
- What do current leases actually rent for vs. the listed asking? Can we see a recent rent roll and the last 12 months of T-12 income?
- It's been on market 118 days. Have you received any prior offers? Is the seller open to a 33% concession, seller financing, or rate buy-down credit?
- Built in 1956 — when were the roof, HVAC, electrical panel, plumbing, and water heater last replaced?
- Why hasn't it sold? Are there any deal-killer items the seller is aware of (foundation, flood, title, zoning, code violations)?
- Is there a deadline driving the sale (1031 exchange, divorce, estate, relocation)? That informs how much negotiation room exists.
- Schools are F-rated, which usually means shorter tenancies and higher turnover. Who's the typical renter profile here, and what's been the actual vacancy rate?
- The area grade is low — what's the realistic commute time and amenity access for the typical tenant pool here? Any planned neighborhood developments (good or bad) we should know about?
- What's the average days-on-market for RENTAL listings here right now (not sales)? A rising rental-DOM trend means longer vacancies and softer asking-rent achievability than the comps imply.
- What's the recent tenant-quality profile in this submarket — average credit score on applications, eviction rate, late-payment / NSF rate, and stable-employment percentage? A property-management company in the area should have these aggregated.
- How much new for-sale + rental construction is in the pipeline within 1–3 miles? Heavy new supply typically softens prices + rents 12–24 months out; constrained supply supports both.
Investment metrics
- 1% rule
- 0.67% ✗
- Cap rate
- 5.34%
- Cash-on-cash
- -3.39%
- DSCR
- 0.85
- GRM
- 12.4
CMA / ARV
- ARV (on-the-fly)
- $107,136
- Comps found
- 1
Show comp detail 1 sale within ~0.75 mi
| Address | Dist | Beds/Ba | Sqft | Sold | Price | $/sf | Match |
|---|---|---|---|---|---|---|---|
| 180 Hooper Ave | 0.62mi | 3/1.0 (+1) | 1,360 (-9%) | 4mo | $98,000 | $72 | 46 |
Match score weights: distance 35% · size 25% · config 20% · recency 20%. Top-matched comps best support the ARV.
Projected returns pro-forma
5.74% appreciation · 3.0% rent growth · sell at horizon
- IRR
- 11.9%
- Equity multiple
- 1.80×
- Total profit
- $44,500
- Equity at exit
- $122,393
- IRR
- 12.8%
- Equity multiple
- 3.49×
- Total profit
- $139,479
- Equity at exit
- $219,182
Cash invested: $55,972 (down + closing). Projections, not guarantees.
Landlord ↔ Tenant lean methodology
- Overall (STATE)
- 85 Strongly Landlord-Friendly
- State North Carolina
- 85 Strongly Landlord-Friendly · R+3
- County
- — inherits STATE
- City
- — inherits STATE
ZIP-level market 27379
- Home prices YoY
- 2.8%
- Active inventory
- 23
- Price-to-rent
- 12.4×
Monthly cashflow live
- Estimated rent
- $1,348 medium interval (Pro) →
- Mortgage (P&I)
- −$1,048
- Tax from tax record
- −$91 /mo · $1,096/yr
- Insurance
- −$83
- HOA
- −$0
- Vacancy / Maint / Mgmt
- −$283
- Net cashflow
- $-158
Break-even live
Sensitivity live
| Price | -10% $-45 | -5% $-101 | +0% $-158 | +5% $-215 | +10% $-271 |
|---|---|---|---|---|---|
| Rent | -10% $-264 | -5% $-211 | +0% $-158 | +5% $-105 | +10% $-51 |
| Rate | -1.0pp $-57 | -0.5pp $-107 | base $-158 | +0.5pp $-210 | +1.0pp $-262 |
UW: 25.0% down · 7.5% · 30yr · 1.5% tax · 5.0% vac · 8.0% maint · 8.0% mgmt
Financing live
Cash to close
- Down payment
- $49,975
- Closing costs
- $5,997
- Reserves months
- —
- Total cash needed
- —
Loan-product check · same deal, 3 products live
Conventional
25% down · 7.5% · 30yr
- Down + closing
- —
- Monthly P&I
- —
- Monthly cashflow
- —
- DSCR
- —
- Eligible?
- —
Personal DTI + credit; lowest rate.
DSCR
20% down · 8.5% · 30yr
- Down + closing
- —
- Monthly P&I
- —
- Monthly cashflow
- —
- DSCR
- —
- Eligible?
- —
No personal income docs; deal must DSCR.
Hard money
10% down · 12.0% · 12mo
- Down + closing
- —
- Monthly P&I
- —
- Monthly cashflow
- —
- DSCR
- —
- Eligible?
- —
Short-term bridge; refi at stabilization.
Listing history 30 events
-
2026-06-21days on market $199,900 Active 118 DOM
-
2026-06-19days on market $199,900 Active 116 DOM
-
2026-06-18days on market $199,900 Active 115 DOM
-
2026-06-17days on market $199,900 Active 114 DOM
-
2026-06-16days on market $199,900 Active 113 DOM
-
2026-06-15days on market $199,900 Active 112 DOM
-
2026-06-14days on market $199,900 Active 110 DOM
-
2026-06-13days on market $199,900 Active 109 DOM
-
2026-06-10days on market $199,900 Active 107 DOM
-
2026-06-09days on market $199,900 Active 106 DOM
-
2026-06-08days on market $199,900 Active 105 DOM
-
2026-06-07days on market $199,900 Active 104 DOM
-
2026-06-03days on market $199,900 Active 100 DOM
-
2026-06-02days on market $199,900 Active 99 DOM
-
2026-06-01days on market $199,900 Active 98 DOM
-
2026-05-31days on market $199,900 Active 97 DOM
-
2026-05-30days on market $199,900 Active 96 DOM
-
2026-05-11price $189,900 302-char remark
Show marketing remark (302 chars)
Freshly renovated beautiful home. This home has a new metal roof, nice laminate and hardwood floors Throughout. Comes with a new oven and refrigerator. New second bath adds the room your family needs. Located in the heart of Yanceyville, close to BYHS and convenient to everything downtown. A must see!
-
2026-02-24$199,900 Active 302-char remark
Show marketing remark (302 chars)
Freshly renovated beautiful home. This home has a new metal roof, nice laminate and hardwood floors Throughout. Comes with a new oven and refrigerator. New second bath adds the room your family needs. Located in the heart of Yanceyville, close to BYHS and convenient to everything downtown. A must see!
-
2026-02-23$199,900 Active
-
2024-09-16price $149,900
-
2024-09-16price $149,900
-
2024-09-03price $169,500
-
2024-08-01price $174,900
-
2024-08-01price $174,900
-
2024-07-01price $179,900
-
2024-07-01price $179,900
-
2024-04-22$189,900 Active
-
2013-09-27soldstatus $30,000
-
2012-12-19$34,900
ⓘ Source: listings_history table (triggers on properties + properties_extension) + one-shot
backfill from property_details.listing_events for pre-trigger history.
Tax reassessment forecast NC · Resets to sale price
- Current annual tax
- $1,096 · $91/mo
- Projected year-2 tax
- $1,639 · $137/mo
- Expected delta
- +$543/yr (+$45/mo · 49.5%)
ⓘ Screening estimate from a state-policy table — verify with the county assessor before closing.
Climate risk First Street
- Flood 1/10 Low FEMA zone X (unshaded) · 0% chance over 30 yrs
- Wildfire 3/10 Moderate
- Heat 6/10 Major 7 d/yr ≥108°F today · 17 d/yr by 30 yrs out
- Wind 4/10 Moderate 12% chance of damaging wind over 30 yrs
- Air quality 2/10 Low 1 unhealthy d/yr today · 2 by 30 yrs out
Nearby sold comps map
Loading sold comps map…
Walkable amenities ~0.75 mi
Loading nearby amenities…
Taxation est. · year 1
- Rental income
- $16,177
- − Mortgage interest
- −$11,198
- − Property taxes
- −$1,096
- − Insurance
- −$1,000
- − Repairs & maintenance
- −$1,294
- − Management
- −$1,294
- − Depreciation
- −$5,815
- Taxable loss
- −$5,520
- Est. tax savings @ 24.0%
- +$1,325
- After-tax cash flow
- $-571/yr
For passive investors: Depreciation is non-cash, so a rental often shows a tax loss while cash-flowing — sheltering income. Rental losses are passive: they offset passive income freely, and up to $25,000/yr can offset ordinary (W-2) income if you actively participate and your MAGI is under $100k (phasing out to $0 by $150k); unused losses carry forward. On sale, claimed depreciation is recaptured at up to 25%, and gains may owe capital-gains tax (a 1031 exchange can defer both). Figures are a year-1 estimate at your 24.0% rate — not tax advice; consult a CPA.
Schools (NCES district)
- District
- Caswell County Schools
- NCES district ID
- 3700660
- Math proficiency
- 24% ▼ -2.00%
- Reading proficiency
- 37% ▲ 3.00%
- Median HH income
- $38,172
- Composite
- 25.44/100
- National rank
- #7452
- State rank
- #146 of 178 in NC
Livability — Yanceyville
- Score
- 68/100
- State rank
- #179
- US rank
- #9189
Category grades
Schools grade is shown separately in the Schools card above.
Census & demographics
- Census place
- Yanceyville, NC
- Population (ZIP)
- 4,143
Population outlook (Caswell County) Hauer SSP2
- Today (2025)
- 21,389 people
- By 2030
- 20,297 · -5.1%
- By 2040
- 17,848 · -16.6%
- By 2050
- 15,578 · -27.2%
- By 2075
- 11,939 · -44.2%
- By 2100
- 8,930 · -58.2%
Race, ethnicity, and origin ACS 2023
- Neighborhood character
- Majority White (54%)
- Race & ethnicity
- White 54% Black 41% Two or more races 4% Hispanic / Latino 2%
- Common ancestry
- Romanian 4% Italian 3% Subsaharan African 3%
- Foreign-born
- 4% · Canada
- Languages at home
- 96% English-only · Russian/Polish/Slavic 2% Spanish 2%
Political lean MEDSL · Caswell
- 2024 margin
- Strong R (+24.6) · D 37.4% · R 61.9%
- 2008→2024 swing
- -27.7pp toward R · 2008: 3.1pp · 2024: -24.6pp
- All cycles
- 2024: R+24.6 2020: R+18.5 2016: R+11.5 2012: R+2.7 2008: D+3.1
Not yet ingested
- Civics
- —
Market trends
- HPI YoY
- ▲ 5.74%
- Current HPI
- 210.5496
- Rent YoY
- —
- Metro
- —
- State GDP YoY
- ▲ 3.28%
- F500 in state
- 26
Industry mix (Fortune 500 HQ in NC)
| Industry | F500 HQs | Revenue |
|---|---|---|
| Financial Services | 2 | $213B |
|
||
| Retail | 2 | $95B |
|
||
| Industrial Conglomerate | 1 | $38B |
|
||
| Metals / Steel | 1 | $35B |
|
||
| Utilities | 1 | $30B |
|
||
| Industrial Machinery | 1 | $19B |
|
||
Price history
+444.1% since first listed13 events — show timeline
- 2026-05-11 Price Changed $189,900 DRRAR
- 2026-02-24 Listed $199,900 DRRAR
- 2026-02-23 Listed $199,900 Triad MLS
- 2024-09-16 Price Changed $149,900 DRRAR
- 2024-09-16 Price Changed $149,900 Triad MLS
- 2024-09-03 Price Changed $169,500 DRRAR
- 2024-08-01 Price Changed $174,900 Triad MLS
- 2024-08-01 Price Changed $174,900 DRRAR
- 2024-07-01 Price Changed $179,900 DRRAR
- 2024-07-01 Price Changed $179,900 Triad MLS
- 2024-04-22 Listed $189,900 DRRAR
- 2013-09-27 Sold (MLS) $30,000 DRRAR
- 2012-12-19 Listed $34,900 DRRAR
Property tax history
+3.7%/yrLatest (2025): $1,096 · +10.1% YoY. Source: county tax records.
Cash-flow waterfall
monthlySold comps — $/sqft
last 12 mo · ≤1 miLoading sold comps…