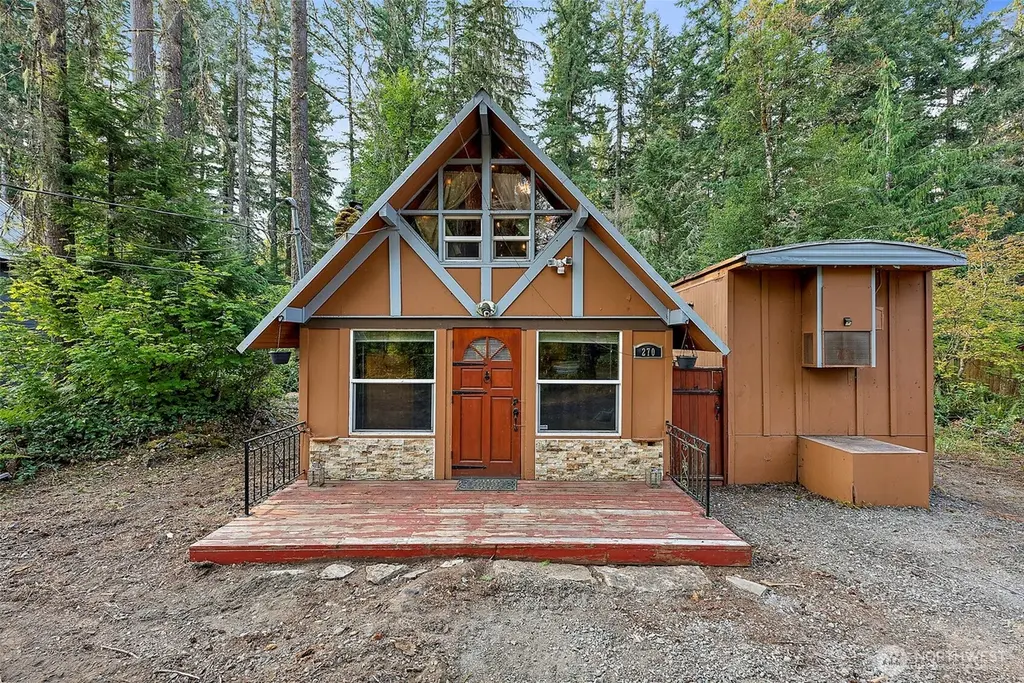
270 Skate Creek Rd N · Ashford, WA
Flood risk 1/10 · Minimal
- FEMA flood zone
- X (unshaded)
- Chance of flooding over 30 yrs
- 0.0%
- Est. flood insurance / yr
- $507 – $1,088
Fire risk 3/10 · Minor
- Est. fire insurance / yr
- $604 – $1,122
Heat risk 1/10 · Minimal
- Hot days now (above 84°F)
- 10 days/yr
- Hot days in 30 yrs
- 21 days/yr
Wind risk 1/10 · Minimal
- Chance of severe wind over 30 yrs
- —
Air-quality risk 6/10 · Moderate
- Unhealthy air days now
- 8 days/yr
- Unhealthy air days in 30 yrs
- 8 days/yr
Risk factors via First Street. Map © Google.
Why this score? — see what drove the C+ grade
The composite is a weighted blend of 9 inputs, each scored 0–100. Each bar is that input's sub-score; the figure is the points it added to the 100-point composite (weight × sub-score).
- Cash flow +16.9/30.0
- ARV discount +15.0/15.0
- Appreciation +6.0/10.0
- DSCR +5.3/10.0
- Schools +4.8/10.0
- 1% rule +4.3/10.0
- Livability +2.8/5.0
- Rent growth +2.5/5.0
- Condition / age +2.5/5.0
$289,999
🖨 Deal sheet 📄 Offer letter ✓ Due diligence
Listing remarks
Private Wooded Retreat! Country Cabin on Shy Half Acre Just 5 min to Mt Rainier Park Entrance! No CCRS or HOA! New Electrical Panel & New Mast. Come to Ski, Fish, Hike, & Relax in the Great PNW! New 3 Bd Septic, Metal Roof, SS Applcs, Pellet Stove, Main Flr Primary, Upstairs Bonus Rm, & Lrg Covered "Party" Deck! New Septic, Power, Internet, 2 Lg H2O Holding Tanks; 1200 & 50 Gal On-Site! Indoor Facilities - Tiled Shower, Hot & Cold H2O, Fir Floor & Toilet! Surrounded by Nice New Build Homes! Just 1 Hr to Tacoma, Minutes to the Elbe Scenic Train, & Nearby Alder Lake! Water is Delivered to the Property or Well Needed. Bring the RVs & Toys!
Key facts
- Country cabin
- Hot and cold h2o
- Fir floor
Tags
Neighborhood map
What this means for you Summary
Snapshot
- This is a 2-bed/1.0-bath other listed at $290k.
Deal economics
- At list price, monthly cash flow is $194 ($2k/yr) — positive.
- The deal already cash-flows at list — no discount required.
- To meet the 1% rule (rent ≥ 1% of price), the offer needs to be $269k (7.3% below list).
- Recommended offer: $255k (12.0% below list) — sets the bar for market timing.
Location & tenants
- Location reads 56/100 on livability (#543 in WA) — a working-class tenant base; expect higher turnover. Strengths: crime A, cost of living A-, housing B; Watch: employment C-, health & safety C-, schools F.
- Eatonville School District (rural): math 45% / reading 60% proficiency, ranked #116 of 291 in WA (top 40%) — acceptable for families but not a draw, mixed tenant base, ~2y average lease.
- Market conditions: 42 active listings in the ZIP; 265 units permitted in Lewis County in 2024 (44 in 5+ unit buildings).
Forward outlook
- In year one you build about $8k of equity ($2k loan paydown + $6k appreciation (2.0% local appreciation)).
- Lewis County population projected at -11% by 2050 — secular population decline; favor cash flow + early exit over multi-decade hold.
- At projected returns (2.0% appreciation + 3.0% rent growth), your $81k cash investment doubles in ~7 years — after that, you're playing with house money.
- By year 5, paydown + projected appreciation supports a ~$35k cash-out refi (75% LTV) — recoverable capital for the next deal without selling this one.
Negotiation context
- It's been on market 275 days — a 12% lower offer ($255k) is reasonable based on typical stale-listing flexibility.
- 5 sale attempts since 23y ago with the ask held roughly flat each time — persistent listings suggest the price (not the market) is what's stuck; bring a comps-based counter.
- Current owner paid $105k; list at $290k implies a 176% gain — meaningful room to come down on a strong offer.
Questions for the listing agent
- It's been on market 275 days. Have you received any prior offers? Is the seller open to a 12% concession, seller financing, or rate buy-down credit?
- Built in 1965 — when were the roof, HVAC, electrical panel, plumbing, and water heater last replaced?
- Why hasn't it sold? Are there any deal-killer items the seller is aware of (foundation, flood, title, zoning, code violations)?
- Is there a deadline driving the sale (1031 exchange, divorce, estate, relocation)? That informs how much negotiation room exists.
- Schools are F-rated, which usually means shorter tenancies and higher turnover. Who's the typical renter profile here, and what's been the actual vacancy rate?
- What's the average days-on-market for RENTAL listings here right now (not sales)? A rising rental-DOM trend means longer vacancies and softer asking-rent achievability than the comps imply.
- What's the recent tenant-quality profile in this submarket — average credit score on applications, eviction rate, late-payment / NSF rate, and stable-employment percentage? A property-management company in the area should have these aggregated.
- How much new for-sale + rental construction is in the pipeline within 1–3 miles? Heavy new supply typically softens prices + rents 12–24 months out; constrained supply supports both.
Investment metrics
- 1% rule
- 0.93% ✗
- Cap rate
- 7.09%
- Cash-on-cash
- 2.86%
- DSCR
- 1.13
- GRM
- 9.0
CMA / ARV
- ARV (median comp)
- $451,644
- List price
- $289,999
- Delta
- -35.79%
- Verdict
- UNDERPRICED
- Comps
- 12 within 1.0 mi
Projected returns pro-forma
2.02% appreciation · 3.0% rent growth · sell at horizon
- IRR
- 7.4%
- Equity multiple
- 1.40×
- Total profit
- $32,476
- Equity at exit
- $114,660
- IRR
- 10.7%
- Equity multiple
- 2.45×
- Total profit
- $117,523
- Equity at exit
- $165,325
Cash invested: $81,200 (down + closing). Projections, not guarantees.
Landlord ↔ Tenant lean methodology
- Overall (STATE)
- 28 Tenant-Leaning
- State Washington
- 28 Tenant-Leaning · D+8
- County
- — inherits STATE
- City
- — inherits STATE
ZIP-level market 98304
- Home prices YoY
- 0.7%
- Active inventory
- 42
- Price-to-rent
- 9.0×
Monthly cashflow live
- Estimated rent
- $2,688 medium interval (Pro) →
- Mortgage (P&I)
- −$1,521
- Tax from tax record
- −$289 /mo · $3,463/yr
- Insurance
- −$121
- HOA
- −$0
- Vacancy / Maint / Mgmt
- −$565
- Net cashflow
- $194
Break-even live
UW: 25.0% down · 7.5% · 30yr · 1.5% tax · 5.0% vac · 8.0% maint · 8.0% mgmt
Financing live
Cash to close
- Down payment
- $72,500
- Closing costs
- $8,700
- Reserves months
- —
- Total cash needed
- —
Loan-product check · same deal, 3 products live
Conventional
25% down · 7.5% · 30yr
- Down + closing
- —
- Monthly P&I
- —
- Monthly cashflow
- —
- DSCR
- —
- Eligible?
- —
Personal DTI + credit; lowest rate.
DSCR
20% down · 8.5% · 30yr
- Down + closing
- —
- Monthly P&I
- —
- Monthly cashflow
- —
- DSCR
- —
- Eligible?
- —
No personal income docs; deal must DSCR.
Hard money
10% down · 12.0% · 12mo
- Down + closing
- —
- Monthly P&I
- —
- Monthly cashflow
- —
- DSCR
- —
- Eligible?
- —
Short-term bridge; refi at stabilization.
Listing history 28 events
-
2026-06-18days on market $289,999 Active 275 DOM
-
2026-06-17days on market $289,999 Active 274 DOM
-
2026-06-16days on market $289,999 Active 273 DOM
-
2026-06-15days on market $289,999 Active 272 DOM
-
2026-06-13days on market $289,999 Active 270 DOM
-
2026-06-09days on market $289,999 Active 266 DOM
-
2026-06-08days on market $289,999 Active 265 DOM
-
2026-06-07days on market $289,999 Active 264 DOM
-
2026-06-04days on market $289,999 Active 261 DOM
-
2026-06-03days on market $289,999 Active 260 DOM
-
2026-06-02days on market $289,999 Active 259 DOM
-
2026-06-01days on market $289,999 Active 258 DOM
-
2026-05-31days on market $289,999 Active 257 DOM
-
2026-03-29price $289,999
-
2025-12-03status Active
-
2025-11-24status Pending - Backup Offer Requested
-
2025-09-06$295,000 Active
-
2018-07-23soldstatus $105,000 Sold
-
2018-07-23soldstatus $105,000
-
2018-07-23status Pending
-
2018-06-28status Pending Feasibility
-
2018-06-10price $114,995
-
2018-04-10$118,000 Active
-
2005-11-28soldstatus $38,000
-
2005-03-16$42,000
-
2003-03-26soldstatus $32,000
-
2003-03-26soldstatus $32,000
-
2003-01-31$36,500
ⓘ Source: listings_history table (triggers on properties + properties_extension) + one-shot
backfill from property_details.listing_events for pre-trigger history.
Tax reassessment forecast WA · Resets to sale price
- Current annual tax
- $3,463 · $289/mo
- Projected year-2 tax
- $3,463 · $289/mo
- Expected delta
- $0/yr ($0/mo · 0.0%)
ⓘ Screening estimate from a state-policy table — verify with the county assessor before closing.
Climate risk First Street
- Flood 1/10 Low FEMA zone X (unshaded) · 0% chance over 30 yrs
- Wildfire 3/10 Moderate
- Heat 1/10 Low 10 d/yr ≥84°F today · 21 d/yr by 30 yrs out
- Wind 1/10 Low
- Air quality 6/10 Major 8 unhealthy d/yr today · 8 by 30 yrs out
Nearby sold comps map
Loading sold comps map…
Walkable amenities ~0.75 mi
Loading nearby amenities…
Taxation est. · year 1
- Rental income
- $32,262
- − Mortgage interest
- −$16,244
- − Property taxes
- −$3,463
- − Insurance
- −$1,450
- − Repairs & maintenance
- −$2,581
- − Management
- −$2,581
- − Depreciation
- −$8,436
- Taxable loss
- −$2,494
- Est. tax savings @ 24.0%
- +$598
- After-tax cash flow
- $2,923/yr
For passive investors: Depreciation is non-cash, so a rental often shows a tax loss while cash-flowing — sheltering income. Rental losses are passive: they offset passive income freely, and up to $25,000/yr can offset ordinary (W-2) income if you actively participate and your MAGI is under $100k (phasing out to $0 by $150k); unused losses carry forward. On sale, claimed depreciation is recaptured at up to 25%, and gains may owe capital-gains tax (a 1031 exchange can defer both). Figures are a year-1 estimate at your 24.0% rate — not tax advice; consult a CPA.
Schools (NCES district)
- District
- Eatonville School District
- NCES district ID
- 5302370
- Math proficiency
- 45% ▼ -1.00%
- Reading proficiency
- 60% ▲ 1.00%
- Median HH income
- $58,370
- Composite
- 47.54/100
- National rank
- #4971
- State rank
- #116 of 291 in WA
Livability — Ashford
- Score
- 56/100
- State rank
- #543
- US rank
- #22815
Category grades
Schools grade is shown separately in the Schools card above.
Census & demographics
- Population (ZIP)
- 867
Population outlook (Lewis County) Hauer SSP2
- Today (2025)
- 75,749 people
- By 2030
- 74,647 · -1.5%
- By 2040
- 71,310 · -5.9%
- By 2050
- 67,748 · -10.6%
- By 2075
- 59,829 · -21.0%
- By 2100
- 52,293 · -31.0%
Race, ethnicity, and origin ACS 2023
- Neighborhood character
- Predominantly White (82%)
- Race & ethnicity
- White 82% Hispanic / Latino 12% Two or more races 9% Asian 2%
- Hispanic origin (detail)
- Mexican 5%
- Common ancestry
- Portuguese 11% Italian 7% English 6%
- Foreign-born
- 3%
- Languages at home
- 92% English-only · Spanish 5% Other Asian/Pacific 4%
Political lean MEDSL · Lewis
- 2024 margin
- Solid R (+33.0) · D 32.0% · R 65.0% · Other 3.0%
- 2008→2024 swing
- -13.8pp toward R · 2008: -19.2pp · 2024: -33.0pp
- All cycles
- 2024: R+33.0 2020: R+32.8 2016: R+36.2 2012: R+23.5 2008: R+19.2
Not yet ingested
- Civics
- —
Market trends
- HPI YoY
- ▲ 2.02%
- Current HPI
- 289.5128
- Rent YoY
- —
- Metro
- —
- State GDP YoY
- ▲ 4.65%
- F500 in state
- 22
Industry mix (Fortune 500 HQ in WA)
| Industry | F500 HQs | Revenue |
|---|---|---|
| Retail | 2 | $269B |
|
||
| Technology / Retail | 1 | $638B |
|
||
| Technology | 1 | $245B |
|
||
| Telecommunications | 1 | $38B |
|
||
| Food / Beverage | 1 | $36B |
|
||
| Automotive / Trucks | 1 | $34B |
|
||
Price history
+694.5% since first listed15 events — show timeline
- 2026-03-29 Price Changed $289,999 NWMLS as Distributed by MLS Grid
- 2025-12-03 Relisted — NWMLS as Distributed by MLS Grid
- 2025-11-24 Pending — NWMLS as Distributed by MLS Grid
- 2025-09-06 Listed $295,000 NWMLS as Distributed by MLS Grid
- 2018-07-23 Sold (Public Records) $105,000 Public Records
- 2018-07-23 Sold (MLS) $105,000 NWMLS as Distributed by MLS Grid
- 2018-07-23 Pending — NWMLS as Distributed by MLS Grid
- 2018-06-28 Pending — NWMLS as Distributed by MLS Grid
- 2018-06-10 Price Changed $114,995 NWMLS as Distributed by MLS Grid
- 2018-04-10 Listed $118,000 NWMLS as Distributed by MLS Grid
- 2005-11-28 Sold (MLS) $38,000 NWMLS as Distributed by MLS Grid
- 2005-03-16 Listed $42,000 NWMLS as Distributed by MLS Grid
- 2003-03-26 Sold (Public Records) $32,000 Public Records
- 2003-03-26 Sold (MLS) $32,000 NWMLS as Distributed by MLS Grid
- 2003-01-31 Listed $36,500 NWMLS as Distributed by MLS Grid
Property tax history
+12.5%/yrLatest (2026): $3,463 · +8.2% YoY. Source: county tax records.
Cash-flow waterfall
monthlySold comps — $/sqft
last 12 mo · ≤1 miLoading sold comps…