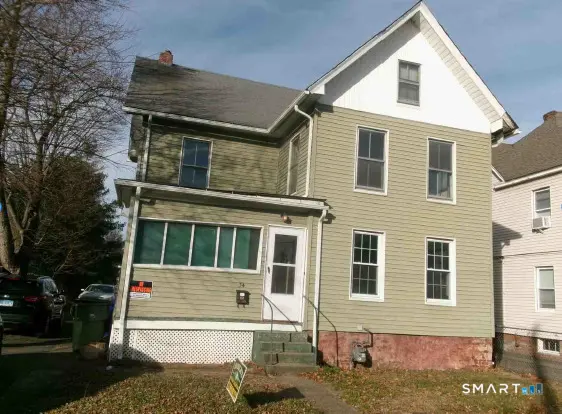
34-36 Woodbridge Ave · East Hartford, CT
Flood risk 1/10 · Minimal
- FEMA flood zone
- X (unshaded)
- Chance of flooding over 30 yrs
- 0.0%
- Est. flood insurance / yr
- $473 – $860
Fire risk 1/10 · Minimal
- Est. fire insurance / yr
- $829 – $1,539
Heat risk 5/10 · Moderate
- Hot days now (above 97°F)
- 7 days/yr
- Hot days in 30 yrs
- 16 days/yr
Wind risk 6/10 · Moderate
- Chance of severe wind over 30 yrs
- 27.0%
Air-quality risk 3/10 · Minor
- Unhealthy air days now
- 3 days/yr
- Unhealthy air days in 30 yrs
- 4 days/yr
Risk factors via First Street. Map © Google.
Why this score? — see what drove the C- grade
The composite is a weighted blend of 9 inputs, each scored 0–100. Each bar is that input's sub-score; the figure is the points it added to the 100-point composite (weight × sub-score).
- Cash flow +18.1/30.0
- ARV discount +15.0/15.0
- DSCR +5.7/10.0
- 1% rule +4.9/10.0
- Livability +3.7/5.0
- Rent growth +2.5/5.0
- Schools +2.1/10.0
- Condition / age +1.0/5.0
- Appreciation +0.0/10.0
$225,000
🖨 Deal sheet 📄 Offer letter ✓ Due diligence
Listing remarks MLS
This is a four bedroom, two full bathroom colonial house with 2,102 square feet. House is being sold as is.
Key facts
- 8,712 sq ft lot
- Built 1873
- Listed 35 days
Neighborhood map
What this means for you Summary
Snapshot
- This is a 4-bed/2.0-bath single-family listed at $225k. Condition is rated poor.
Deal economics
- At list price, monthly cash flow is $197 ($2k/yr) — positive.
- The deal already cash-flows at list — no discount required.
- To meet the 1% rule (rent ≥ 1% of price), the offer needs to be $222k (1.4% below list).
- Recommended offer: $218k (3.0% below list) — sets the bar for market timing.
- Cap rate 7.3% vs local median 4.2% in East Hartford — top-decile yield for the area; either an underpriced asset or a hidden risk that comps aren't pricing in. Stress-test before assuming the spread holds.
Location & tenants
- Location reads 73/100 on livability (#76 in CT) — a middle-class / working-renter tenant base. Strengths: housing A+, crime A, commute A-; Watch: schools D+, amenities F, health & safety F.
- East Hartford School District (urban): math 17% / reading 30% proficiency, ranked #140 of 153 in CT (top 92%) — low school quality limits family demand, transient renter base, plan for 1-2y turnover.
- Market conditions: 47 active listings in the ZIP; 1 comparable units currently listed for rent nearby; 1,867 units permitted in Capitol Planning Region in 2024 (1,399 in 5+ unit buildings).
- At $2,218/mo this rent would consume 47% of the median local household income ($57k/yr) (locally 1205% of renters already pay >50% of income on rent) — very limited rent-growth headroom before tenants either downsize or default.
Forward outlook
- Local home prices are declining (-3.0%/yr); year-one equity from $2k of loan paydown is wiped out by about $7k of value loss. Plan a longer hold.
Negotiation context
- It's been on market 35 days — a 3% lower offer ($218k) is reasonable based on typical stale-listing flexibility.
- 3 sale attempts; this cycle's ask is 29% above the opening price — seller raised mid-cycle; expect resistance to lowballs.
Risks & watch-outs
- Watch-outs: built in 1873 — expect roof / HVAC / electrical / plumbing capex.
- Climate carrying-cost: major wind risk, 27% chance of damaging wind over 30y; extreme-heat days projected 7→16/yr by 2055 (HVAC capex compounding) — expect insurance premiums to compound above CPI over the hold.
Questions for the listing agent
- It's been on market 35 days. Have you received any prior offers? Is the seller open to a 3% concession, seller financing, or rate buy-down credit?
- Have any recent inspections been done? Can we get a copy of the seller's disclosures and any deferred-maintenance estimates?
- Built in 1873 — when were the roof, HVAC, electrical panel, plumbing, and water heater last replaced?
- Is there a deadline driving the sale (1031 exchange, divorce, estate, relocation)? That informs how much negotiation room exists.
- Schools are D-rated, which usually means shorter tenancies and higher turnover. Who's the typical renter profile here, and what's been the actual vacancy rate?
- What's the average days-on-market for RENTAL listings here right now (not sales)? A rising rental-DOM trend means longer vacancies and softer asking-rent achievability than the comps imply.
- What's the recent tenant-quality profile in this submarket — average credit score on applications, eviction rate, late-payment / NSF rate, and stable-employment percentage? A property-management company in the area should have these aggregated.
- How much new for-sale + rental construction is in the pipeline within 1–3 miles? Heavy new supply typically softens prices + rents 12–24 months out; constrained supply supports both.
Investment metrics
- 1% rule
- 0.99% ✗
- Cap rate
- 7.35%
- Cash-on-cash
- 3.76%
- DSCR
- 1.17
- GRM
- 8.5
CMA / ARV
- ARV (median comp)
- $303,003
- List price
- $225,000
- Delta
- -25.74%
- Verdict
- UNDERPRICED
- Comps
- 20 within 1.0 mi
Show comp detail 3 sales within ~0.75 mi
| Address | Dist | Beds/Ba | Sqft | Sold | Price | $/sf | Match |
|---|---|---|---|---|---|---|---|
| 54 Adams St | 0.22mi | 4/2.0 | 2,102 (0%) | 5mo | $340,000 | $162 | 85 |
| 53 Wells Ave | 0.41mi | 4/2.0 | 1,824 (-13%) | 10mo | $290,000 | $159 | 50 |
| 60 Mohawk Dr | 0.54mi | 3/2.0 (-1) | 2,268 (+8%) | 17mo | $305,000 | $134 | 42 |
Match score weights: distance 35% · size 25% · config 20% · recency 20%. Top-matched comps best support the ARV.
Projected returns pro-forma
-3.0% appreciation · 3.0% rent growth · sell at horizon
- IRR
- -10.4%
- Equity multiple
- 0.62×
- Total profit
- $-23,854
- Equity at exit
- $33,548
- IRR
- -1.0%
- Equity multiple
- 0.93×
- Total profit
- $-4,448
- Equity at exit
- $19,454
Cash invested: $63,000 (down + closing). Projections, not guarantees.
Landlord ↔ Tenant lean methodology
- Overall (STATE)
- 27 Tenant-Leaning
- State Connecticut
- 27 Tenant-Leaning · D+7
- County
- — inherits STATE
- City
- — inherits STATE
ZIP-level market 06108
- Home prices YoY
- -17.6%
- Active inventory
- 47
- Price-to-rent
- 8.5×
Monthly cashflow live
- Estimated rent
- $2,218 medium interval (Pro) →
- Mortgage (P&I)
- −$1,180
- Tax est. 1.5%
- −$281 /mo · $3,375/yr
- Insurance
- −$94
- HOA
- −$0
- Vacancy / Maint / Mgmt
- −$466
- Net cashflow
- $197
Break-even live
UW: 25.0% down · 7.5% · 30yr · 1.5% tax · 5.0% vac · 8.0% maint · 8.0% mgmt
Financing live
Cash to close
- Down payment
- $56,250
- Closing costs
- $6,750
- Reserves months
- —
- Total cash needed
- —
Loan-product check · same deal, 3 products live
Conventional
25% down · 7.5% · 30yr
- Down + closing
- —
- Monthly P&I
- —
- Monthly cashflow
- —
- DSCR
- —
- Eligible?
- —
Personal DTI + credit; lowest rate.
DSCR
20% down · 8.5% · 30yr
- Down + closing
- —
- Monthly P&I
- —
- Monthly cashflow
- —
- DSCR
- —
- Eligible?
- —
No personal income docs; deal must DSCR.
Hard money
10% down · 12.0% · 12mo
- Down + closing
- —
- Monthly P&I
- —
- Monthly cashflow
- —
- DSCR
- —
- Eligible?
- —
Short-term bridge; refi at stabilization.
Rent comps 1 comps
| Address | Beds | Baths | Sqft | Rent | $/sqft | DOM | Units | Dist |
|---|---|---|---|---|---|---|---|---|
| 26-28 Elmer St Unit 2nd floor East Hartford, CT | 3.0 | 1.0 | 1500 | $2,000 | $1.33 | 44d | 1 | 1.17mi |
Listing history 7 events
-
2026-05-10status Under Contract 107-char remark
Show marketing remark (107 chars)
This is a four bedroom, two full bathroom colonial house with 2,102 square feet. House is being sold as is.
-
2026-04-23status Active 107-char remark
Show marketing remark (107 chars)
This is a four bedroom, two full bathroom colonial house with 2,102 square feet. House is being sold as is.
-
2026-04-21status Under Contract 107-char remark
Show marketing remark (107 chars)
This is a four bedroom, two full bathroom colonial house with 2,102 square feet. House is being sold as is.
-
2026-04-16status Active 107-char remark
Show marketing remark (107 chars)
This is a four bedroom, two full bathroom colonial house with 2,102 square feet. House is being sold as is.
-
2026-02-14status Under Contract 107-char remark
Show marketing remark (107 chars)
This is a four bedroom, two full bathroom colonial house with 2,102 square feet. House is being sold as is.
-
2026-02-05price $225,000 107-char remark
Show marketing remark (107 chars)
This is a four bedroom, two full bathroom colonial house with 2,102 square feet. House is being sold as is.
-
2026-01-30$175,000 Active 107-char remark
Show marketing remark (107 chars)
This is a four bedroom, two full bathroom colonial house with 2,102 square feet. House is being sold as is.
ⓘ Source: listings_history table (triggers on properties + properties_extension) + one-shot
backfill from property_details.listing_events for pre-trigger history.
Climate risk First Street
- Flood 1/10 Low FEMA zone X (unshaded) · 0% chance over 30 yrs
- Wildfire 1/10 Low
- Heat 5/10 Major 7 d/yr ≥97°F today · 16 d/yr by 30 yrs out
- Wind 6/10 Major 27% chance of damaging wind over 30 yrs
- Air quality 3/10 Moderate 3 unhealthy d/yr today · 4 by 30 yrs out
Nearby sold comps map
Loading sold comps map…
Walkable amenities ~0.75 mi
Loading nearby amenities…
Taxation est. · year 1
- Rental income
- $26,617
- − Mortgage interest
- −$12,603
- − Property taxes
- −$3,375
- − Insurance
- −$1,125
- − Repairs & maintenance
- −$2,129
- − Management
- −$2,129
- − Depreciation
- −$6,545
- Taxable loss
- −$1,290
- Est. tax savings @ 24.0%
- +$310
- After-tax cash flow
- $2,678/yr
For passive investors: Depreciation is non-cash, so a rental often shows a tax loss while cash-flowing — sheltering income. Rental losses are passive: they offset passive income freely, and up to $25,000/yr can offset ordinary (W-2) income if you actively participate and your MAGI is under $100k (phasing out to $0 by $150k); unused losses carry forward. On sale, claimed depreciation is recaptured at up to 25%, and gains may owe capital-gains tax (a 1031 exchange can defer both). Figures are a year-1 estimate at your 24.0% rate — not tax advice; consult a CPA.
Condition & rehab AI · 9 photos
This property requires extensive renovation and repair work to bring it up to a livable condition. A complete renovation is recommended to increase its resale and rental value.
Repairs flagged
- Major Exposed subfloor — Needs complete removal and replacement
- Major Debris — Needs removal for safety and aesthetics
- Major Incomplete renovation — Needs full renovation to meet standards
Value-add opportunities
- Both Complete renovation of kitchen and bathrooms — Modernizing spaces will attract buyers and renters
- Both New flooring throughout — New flooring will improve aesthetics and functionality
- Both Painting interior and exterior — Fresh paint will enhance curb appeal and interior aesthetics
- Both HVAC system upgrade — Upgrading HVAC will improve comfort and energy efficiency
- Both Landscaping and curb appeal improvements — Aesthetic improvements will attract buyers and renters
Renovation cost estimate screening
| Repair item | Severity | Est. cost |
|---|---|---|
| Exposed subfloor · Needs complete removal and replacement | Major | $15,000–50,000 |
| Debris · Needs removal for safety and aesthetics | Major | $15,000–50,000 |
| Incomplete renovation · Needs full renovation to meet standards | Major | $15,000–50,000 |
| Total estimated repair cost · 3 items | $45,000–150,000 |
Value-add ROI direction
- Both Complete renovation of kitchen and bathrooms — Modernizing spaces will attract buyers and renters ↑
- Both New flooring throughout — New flooring will improve aesthetics and functionality ↑
- Both Painting interior and exterior — Fresh paint will enhance curb appeal and interior aesthetics ↑
- Both HVAC system upgrade — Upgrading HVAC will improve comfort and energy efficiency ↑
- Both Landscaping and curb appeal improvements — Aesthetic improvements will attract buyers and renters ↑
ⓘ Cost ranges are severity-bucket heuristics (US national rule-of-thumb). Get contractor quotes + a written scope before underwriting a rehab budget.
Schools (NCES district)
- District
- East Hartford School District
- NCES district ID
- 0901260
- Math proficiency
- 17% ▼ -5.00%
- Reading proficiency
- 30% ▼ -7.00%
- Median HH income
- $49,691
- Composite
- 20.74/100
- National rank
- #8519
- State rank
- #140 of 153 in CT
Livability — East Hartford
- Score
- 73/100
- State rank
- #76
- US rank
- #5527
Category grades
Schools grade is shown separately in the Schools card above.
Census & demographics
- Census place
- East Hartford, CT
- County
- Hartford County · 754,208 people
- City population
- 50,918
- Metro
- Hartford-East Hartford-Middletown, CT
- Population (ZIP)
- 23,499
- Household income
- $56,663
- Rent vs Own
- Severe rent burden
- 1205.0
Population outlook (Capitol County) Hauer SSP2
- By 2040
- 1,063,519
Race, ethnicity, and origin ACS 2023
- Neighborhood character
- Diverse neighborhood (Simpson 0.68)
- Race & ethnicity
- Hispanic / Latino 44% Black 26% White 23% Two or more races 18% Asian 2%
- Hispanic origin (detail)
- Mexican 2% Puerto Rican 28% Dominican 2% Salvadoran 1%
- Common ancestry
- Romanian 4% Lithuanian 4% Estonian 2%
- Foreign-born
- 22% · Canada, Jamaica, Vietnam
- Languages at home
- 55% English-only · Spanish 35% Other Indo-European 3% French/Haitian/Cajun 2%
Political lean MEDSL · Capitol
- 2024 margin
- Strong D (+21.9) · D 60.1% · R 38.2% · Other 1.7%
- All cycles
- 2024: D+21.9
Not yet ingested
- Civics
- —
Market trends
- HPI YoY
- ▼ -65.15%
- Current HPI
- 306.0426
- Rent YoY
- —
- Metro
- Hartford-East Hartford-Middletown, CT
- State GDP YoY
- ▲ 1.06%
- F500 in state
- 38
Industry mix (Fortune 500 HQ in CT)
| Industry | F500 HQs | Revenue |
|---|---|---|
| Industrial Machinery | 4 | $38B |
|
||
| Insurance | 3 | $71B |
|
||
| Financial Services | 2 | $25B |
|
||
| Transportation / Logistics | 2 | $18B |
|
||
| Healthcare | 1 | $247B |
|
||
| Telecommunications | 1 | $55B |
|
||
Price history
+28.6% since first listed7 events — show timeline
- 2026-05-10 Pending — Smart MLS
- 2026-04-23 Relisted — Smart MLS
- 2026-04-21 Pending — Smart MLS
- 2026-04-16 Relisted — Smart MLS
- 2026-02-14 Pending — Smart MLS
- 2026-02-05 Price Changed $225,000 Smart MLS
- 2026-01-30 Listed $175,000 Smart MLS
Cash-flow waterfall
monthlySold comps — $/sqft
last 12 mo · ≤1 miLoading sold comps…