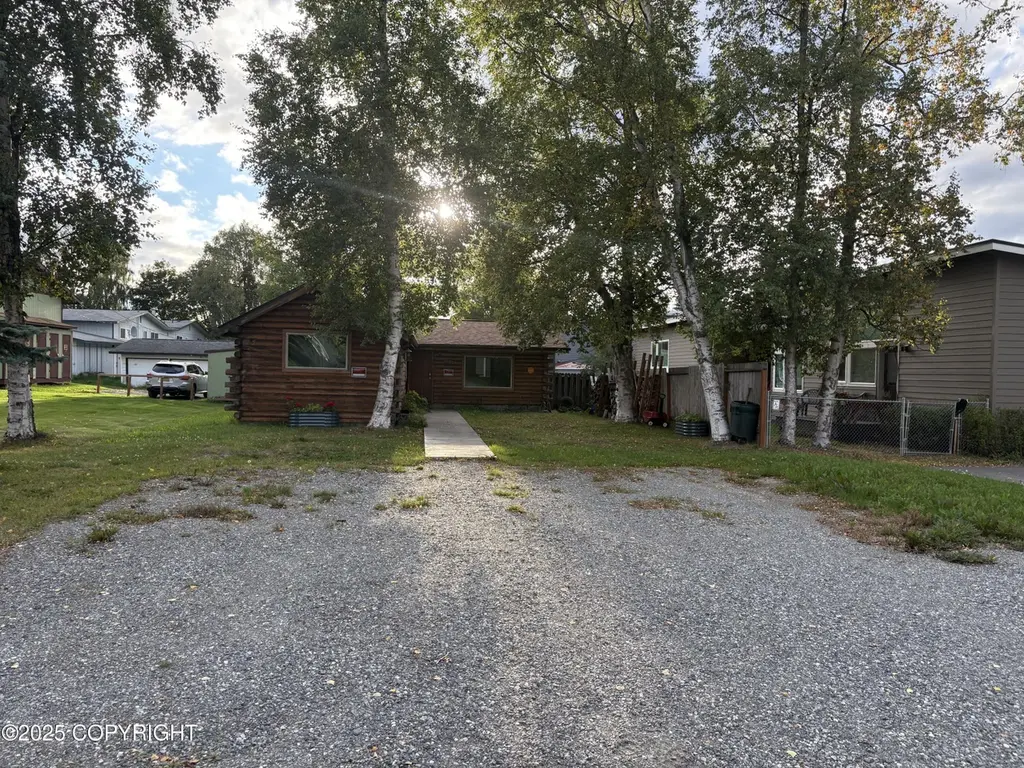
4106 Harrison St · Anchorage, AK
Flood risk 1/10 · Minimal
- FEMA flood zone
- X (unshaded)
- Chance of flooding over 30 yrs
- 0.0%
- Est. flood insurance / yr
- $473 – $860
Fire risk No data
- Est. fire insurance / yr
- —
Heat risk No data
- Hot days now (above threshold)
- —
- Hot days in 30 yrs
- —
Wind risk No data
- Chance of severe wind over 30 yrs
- —
Air-quality risk 1/10 · Minimal
- Unhealthy air days now
- —
- Unhealthy air days in 30 yrs
- —
Risk factors via First Street. Map © Google.
Why this score? — see what drove the D+ grade
The composite is a weighted blend of 9 inputs, each scored 0–100. Each bar is that input's sub-score; the figure is the points it added to the 100-point composite (weight × sub-score).
- ARV discount +15.0/15.0
- Cash flow +8.7/30.0
- Appreciation +6.5/10.0
- Livability +3.9/5.0
- Schools +3.7/10.0
- Rent growth +3.1/5.0
- 1% rule +2.6/10.0
- Condition / age +2.5/5.0
- DSCR +2.4/10.0
$290,000
🖨 Deal sheet (PDF) 📄 Offer letter ✓ Due diligence
Listing remarks
This Beautiful, unique three-bedroom, one bath log home on a large lot in a great midtown location with plenty of parking also has gated alley access to a large concrete pad for RV or Boat storage. A gorgeous fireplace with vaulted wood ceiling in the living room and kitchen area. This property also features a large 20'x18' detached shop with electric adjacent to the concrete RV/Boat storage pad.
Key facts
- Concrete pad
- Gated alley access
- Detached shop
Tags
Property features AI
Exterior
- Parking: No garage; No carport
- Utilities: Public sewer; Paved road access
- Home design: Residential property; Not attached to another unit; Built in 1961; Other foundation
- Construction: Shingle roof
- Exterior features: Fenced yard; Private yard; Road service access; Exterior storage
Interior
- Kitchen: Refrigerator
- Bedrooms: 3 bedrooms
- Bathrooms: 1 full bathroom
- Heating & cooling: Electric heating; Wood stove heating; Fireplace for supplemental heat
- Interior features: Refrigerator; Electric appliances; Fireplace; Wood stove
Neighborhood map
What this means for you Summary
Snapshot
- This is a 3-bed/1.0-bath single-family listed at $290k.
Deal economics
- At list price, monthly cash flow is $-242 ($-3k/yr) — negative.
- To cash-flow at today's rent, offer at most $247k (14.7% below list).
- To meet the 1% rule (rent ≥ 1% of price), the offer needs to be $222k (23.5% below list).
- Recommended offer: $222k (23.5% below list) — sets the bar for 1% rule.
- Cap rate 5.3% vs local median 3.8% in Anchorage — top-decile yield for the area; either an underpriced asset or a hidden risk that comps aren't pricing in. Stress-test before assuming the spread holds.
Location & tenants
- Location reads 78/100 on livability (#6 in AK, #2,553 nationally) — a middle-class / working-renter tenant base. Strengths: amenities A+, commute A+, employment A+; Watch: crime F, cost of living F.
- Anchorage School District (urban): math 37% / reading 43% proficiency, ranked #6 of 21 in AK (top 29%) — families likely to look elsewhere, expect single-tenant / working-renter base with shorter leases.
- Zoned schools: Willow Crest Elementary (math 22% / reading 22%, grade F, #128 of 156 statewide, top 86%, 284 students, 100% FRL); Romig Middle School (math 24% / reading 44%, grade F, #22 of 36 statewide, top 63%, 720 students, 37% FRL) — zoned schools average 69% FRL vs 38% district-wide (31 pts higher); higher-poverty schools than district average — tighter screening recommended.
- Zoned-school proficiency averages 28% at this address vs 40% district-wide (-12 pts) — the specific schools serving this property underperform the Anchorage School District average; the district grade overstates school quality for this exact location.
- Market conditions: Rents rising (+2.3%/yr); 65 active listings in the ZIP; 10 comparable units currently listed for rent nearby; rentals at typical pace (median 25d on market — plan ~3-4 weeks tenant-placement turnaround); solid renter incomes; 306 units permitted in Anchorage Municipality in 2024 (90 in 5+ unit buildings).
- This rent runs 35% of the median local income ($76k/yr) — at the standard rent-burdened threshold; future hikes will face affordability resistance.
Forward outlook
- In year one you build about $11k of equity ($2k loan paydown + $9k appreciation (3.1% local appreciation)).
- Anchorage County population projected at +12% by 2050 — modest demand growth; plan on rents tracking national, not racing it.
- By year 4, paydown + projected appreciation supports a ~$37k cash-out refi (75% LTV) — recoverable capital for the next deal without selling this one.
Negotiation context
- It's been on market 37 days — a 3% lower offer ($281k) is reasonable based on typical stale-listing flexibility.
- 3 sale attempts since 29y ago; this cycle's ask has dropped $30k (9%) from the opening price — seller is motivated, your offer sets the floor, not the list.
Questions for the listing agent
- What do current leases actually rent for vs. the listed asking? Can we see a recent rent roll and the last 12 months of T-12 income?
- It's been on market 37 days. Have you received any prior offers? Is the seller open to a 24% concession, seller financing, or rate buy-down credit?
- Built in 1961 — when were the roof, HVAC, electrical panel, plumbing, and water heater last replaced?
- Is there a deadline driving the sale (1031 exchange, divorce, estate, relocation)? That informs how much negotiation room exists.
- Schools are B-rated — typically a magnet for longer-tenancy family renters. What's the average tenant stay here, and is there a school-zone premium baked into asking?
- Crime grade is F in this area — have there been break-ins, vandalism, or insurance claims at this property in the last 3 years? What carrier currently insures it and at what premium?
- The area grade is low — what's the realistic commute time and amenity access for the typical tenant pool here? Any planned neighborhood developments (good or bad) we should know about?
- What's the average days-on-market for RENTAL listings here right now (not sales)? A rising rental-DOM trend means longer vacancies and softer asking-rent achievability than the comps imply.
- What's the recent tenant-quality profile in this submarket — average credit score on applications, eviction rate, late-payment / NSF rate, and stable-employment percentage? A property-management company in the area should have these aggregated.
- How much new for-sale + rental construction is in the pipeline within 1–3 miles? Heavy new supply typically softens prices + rents 12–24 months out; constrained supply supports both.
Investment metrics
- 1% rule
- 0.76% ✗
- Cap rate
- 5.29%
- Cash-on-cash
- -3.57%
- DSCR
- 0.84
- GRM
- 10.9
CMA / ARV
- ARV (on-the-fly)
- $376,500
- Comps found
- 12
Show comp detail 12 sales within ~0.75 mi
| Address | Dist | Beds/Ba | Sqft | Sold | Price | $/sf | Match |
|---|---|---|---|---|---|---|---|
| 4295 Greenland Dr | 0.24mi | 3/2.0 | 1,500 (0%) | 16mo | $320,000 | $213 | 72 |
| 2202 Lincoln Ave | 0.50mi | 3/1.0 | 1,536 (+2%) | 6mo | $385,000 | $251 | 67 |
| 817 Shakespeare Cir | 0.60mi | 3/2.0 | 1,488 (-1%) | 3mo | $317,000 | $213 | 64 |
| 4002 Taft Dr | 0.49mi | 2/2.0 (-1) | 1,540 (+3%) | 0mo | $425,000 | $276 | 64 |
| 4210 Cope St | 0.18mi | 3/2.0 | 1,289 (-14%) | 1mo | $170,000 | $132 | 63 |
| 1500 Oxford Dr | 0.50mi | 3/2.0 | 1,486 (-1%) | 11mo | $385,000 | $259 | 62 |
| 2000 Wenmatt Cir | 0.46mi | 3/2.0 | 1,543 (+3%) | 10mo | $369,000 | $239 | 62 |
| 2040 Wenmatt Cir | 0.49mi | 3/2.0 | 1,572 (+5%) | 5mo | $465,000 | $296 | 61 |
| 3512 Cope St | 0.38mi | 4/3.0 (+1) | 1,579 (+5%) | 5mo | $559,000 | $354 | 56 |
| 2201 W 47th Ave | 0.65mi | 3/2.0 | 1,632 (+9%) | 3mo | $388,900 | $238 | 49 |
| 3401 Dorbrandt St | 0.47mi | 2/3.0 (-1) | 1,463 (-2%) | 17mo | $110,000 | $75 | 46 |
| 3314 Outta Pl | 0.70mi | 2/2.0 (-1) | 1,588 (+6%) | 10mo | $560,000 | $353 | 40 |
Match score weights: distance 35% · size 25% · config 20% · recency 20%. Top-matched comps best support the ARV.
Projected returns pro-forma
3.1% appreciation · 2.28% rent growth · sell at horizon
- IRR
- 4.2%
- Equity multiple
- 1.24×
- Total profit
- $19,493
- Equity at exit
- $132,024
- IRR
- 7.0%
- Equity multiple
- 2.07×
- Total profit
- $87,010
- Equity at exit
- $204,738
Cash invested: $81,200 (down + closing). Projections, not guarantees.
Landlord ↔ Tenant lean methodology
- Overall (STATE)
- 80 Strongly Landlord-Friendly
- State Alaska
- 80 Strongly Landlord-Friendly · R+8
- County
- — inherits STATE
- City
- — inherits STATE
ZIP-level market 99503
- Home prices YoY
- 1.3%
- Rents YoY
- 2.3%
- Active inventory
- 65
- Price-to-rent
- 10.9×
Monthly cashflow live
- Estimated rent
- $2,218 high interval (Pro) →
- Mortgage (P&I)
- −$1,521
- Tax from tax record
- −$352 /mo · $4,227/yr
- Insurance
- −$121
- HOA
- −$0
- Vacancy / Maint / Mgmt
- −$466
- Net cashflow
- $-242
Break-even live
Sensitivity live
| Price | -10% $-78 | -5% $-160 | +0% $-242 | +5% $-324 | +10% $-406 |
|---|---|---|---|---|---|
| Rent | -10% $-417 | -5% $-329 | +0% $-242 | +5% $-154 | +10% $-67 |
| Rate | -1.0pp $-96 | -0.5pp $-168 | base $-242 | +0.5pp $-317 | +1.0pp $-393 |
UW: 25.0% down · 7.5% · 30yr · 1.5% tax · 5.0% vac · 8.0% maint · 8.0% mgmt
Financing live
Cash to close
- Down payment
- $72,500
- Closing costs
- $8,700
- Reserves months
- —
- Total cash needed
- —
Loan-product check · same deal, 3 products live
Conventional
25% down · 7.5% · 30yr
- Down + closing
- —
- Monthly P&I
- —
- Monthly cashflow
- —
- DSCR
- —
- Eligible?
- —
Personal DTI + credit; lowest rate.
DSCR
20% down · 8.5% · 30yr
- Down + closing
- —
- Monthly P&I
- —
- Monthly cashflow
- —
- DSCR
- —
- Eligible?
- —
No personal income docs; deal must DSCR.
Hard money
10% down · 12.0% · 12mo
- Down + closing
- —
- Monthly P&I
- —
- Monthly cashflow
- —
- DSCR
- —
- Eligible?
- —
Short-term bridge; refi at stabilization.
Rent comps 10 comps
| Address | Beds | Baths | Sqft | Rent | $/sqft | DOM | Units | Dist |
|---|---|---|---|---|---|---|---|---|
| 1400 W 47th Ave Unit B Anchorage, AK | 2.0 | 2.0 | 1876 | $2,395 | $1.28 | 24d | 1 | 0.39mi |
| 625 W 46th Ave Anchorage, AK | 1.0–2.0 | 1.0 | 950 | $1,640 | $1.73 | 14d | 7 | 0.47mi |
| 3345 Mount Vernon Ct Anchorage, AK | 3.0 | 2.5 | 1421 | $2,500 | $1.76 | 24d | 1 | 0.63mi |
| 2700 McRae Rd Unit 7 Anchorage, AK | 4.0 | 2.0 | 1400 | $2,950 | $2.11 | 14d | 1 | 0.98mi |
| 1472 W 25th Ave Anchorage, AK | 2.0 | 1.5 | 1100 | $2,800 | $2.55 | 44d | 1 | 1.07mi |
| 2810 W Northern Lights Blvd Unit 11 Anchorage, AK | 3.0 | 1.0 | 1050 | $1,825 | $1.74 | 14d | 1 | 1.30mi |
| 290 E 56th Ave Unit 290 Anchorage, AK | 2.0 | 2.0 | 1500 | $2,300 | $1.53 | 44d | 1 | 1.34mi |
| 3401 Lakeshore Dr Anchorage, AK | 2.0 | 2.0 | 1050 | $2,295 | $2.19 | 14d | 1 | 1.39mi |
| 2000 Blueberry St Unit 2000 Anchorage, AK | 2.0 | 1.5 | 1200 | $2,700 | $2.25 | 44d | 1 | 1.40mi |
| 5911 Denali St Unit B2 Anchorage, AK | 3.0 | 1.5 | 1100 | $1,700 | $1.55 | 24d | 1 | 1.46mi |
Listing history 21 events
-
2026-06-18days on market $290,000 Active 37 DOM
-
2026-06-17days on market $290,000 Active 36 DOM
-
2026-06-16days on market $290,000 Active 35 DOM
-
2026-06-15days on market $290,000 Active 34 DOM
-
2026-06-14days on market $290,000 Active 32 DOM
-
2026-06-13days on market $290,000 Active 31 DOM
-
2026-06-10days on market $290,000 Active 29 DOM
-
2026-06-09days on market $290,000 Active 28 DOM
-
2026-06-08days on market $290,000 Active 27 DOM
-
2026-06-07days on market $290,000 Active 26 DOM
-
2026-06-03days on market $290,000 Active 22 DOM
-
2026-06-02days on market $290,000 Active 21 DOM
-
2026-06-01days on market $290,000 Active 20 DOM
-
2026-05-31days on market $290,000 Active 19 DOM
-
2026-05-30days on market $290,000 Active 18 DOM
-
2026-05-20price $290,000
-
2026-05-20status Active
-
2026-04-01status Pending
-
2026-03-23$320,000 Active
-
1998-04-20soldstatus
-
1997-10-13$118,900
ⓘ Source: listings_history table (triggers on properties + properties_extension) + one-shot
backfill from property_details.listing_events for pre-trigger history.
Tax reassessment forecast AK · Partial reset (capped growth)
- Current annual tax
- $4,227 · $352/mo
- Projected year-2 tax
- $4,227 · $352/mo
- Expected delta
- $0/yr ($0/mo · 0.0%)
ⓘ Screening estimate from a state-policy table — verify with the county assessor before closing.
Climate risk First Street
- Flood 1/10 Low FEMA zone X (unshaded) · 0% chance over 30 yrs
- Air quality 1/10 Low
Nearby sold comps map
Loading sold comps map…
Walkable amenities ~0.75 mi
Loading nearby amenities…
Taxation est. · year 1
- Rental income
- $26,613
- − Mortgage interest
- −$16,245
- − Property taxes
- −$4,227
- − Insurance
- −$1,450
- − Repairs & maintenance
- −$2,129
- − Management
- −$2,129
- − Depreciation
- −$8,436
- Taxable loss
- −$8,003
- Est. tax savings @ 24.0%
- +$1,921
- After-tax cash flow
- $-981/yr
For passive investors: Depreciation is non-cash, so a rental often shows a tax loss while cash-flowing — sheltering income. Rental losses are passive: they offset passive income freely, and up to $25,000/yr can offset ordinary (W-2) income if you actively participate and your MAGI is under $100k (phasing out to $0 by $150k); unused losses carry forward. On sale, claimed depreciation is recaptured at up to 25%, and gains may owe capital-gains tax (a 1031 exchange can defer both). Figures are a year-1 estimate at your 24.0% rate — not tax advice; consult a CPA.
Schools (NCES district)
- District
- Anchorage School District
- NCES district ID
- 0200180
- Math proficiency
- 37% ▼ -2.00%
- Reading proficiency
- 43% ▲ 1.00%
- Median HH income
- $76,447
- Composite
- 37.0/100
- National rank
- #4523
- State rank
- #6 of 21 in AK
Livability — Anchorage
- Score
- 78/100
- State rank
- #6
- US rank
- #2553
Category grades
Schools grade is shown separately in the Schools card above.
Census & demographics
- Census place
- Anchorage, AK
- County
- Anchorage Borough · 246,594 people
- City population
- 218,117
- Metro
- Anchorage, AK
- Population (ZIP)
- 12,964
- Household income
- $76,144
- Rent vs Own
- Severe rent burden
- 747.0
Population outlook (Anchorage County) Hauer SSP2
- Today (2025)
- 314,993 people
- By 2030
- 321,771 · +2.2%
- By 2040
- 335,493 · +6.5%
- By 2050
- 352,799 · +12.0%
- By 2075
- 414,771 · +31.7%
- By 2100
- 474,485 · +50.6%
Race, ethnicity, and origin ACS 2023
- Neighborhood character
- Highly diverse neighborhood (Simpson 0.78)
- Race & ethnicity
- White 43% Asian 15% Native American 15% Two or more races 13% Hispanic / Latino 8% Black 8% Pacific Islander 1%
- Hispanic origin (detail)
- Mexican 4%
- Common ancestry
- Lithuanian 2% Slovak 2% Romanian 2%
- Foreign-born
- 17% · Canada, Jamaica, China
- Languages at home
- 75% English-only · Tagalog/Filipino 9% Spanish 6% Other Asian/Pacific 3%
Political lean MEDSL · Anchorage
- 2024 margin
- D (+12.7) · D 56.3% · R 43.7%
- 2016→2024 swing
- +27.9pp toward D · 2016: -15.2pp · 2024: 12.7pp
- All cycles
- 2024: D+12.7 2016: R+15.2
Not yet ingested
- Civics
- —
Market trends
- HPI YoY
- ▲ 3.10%
- Current HPI
- 238.2191
- Rent YoY
- ▲ 2.28%
- Metro
- Anchorage, AK
- State GDP YoY
- —
- F500 in state
- 0
Price history
+143.9% since first listed6 events — show timeline
- 2026-05-20 Price Changed $290,000 AKMLS
- 2026-05-20 Relisted — AKMLS
- 2026-04-01 Pending — AKMLS
- 2026-03-23 Listed $320,000 AKMLS
- 1998-04-20 Sold (Public Records) — Public Records
- 1997-10-13 Listed $118,900 AKMLS
Property tax history
+3.8%/yrLatest (2025): $4,227 · +1.9% YoY. Source: county tax records.
Cash-flow waterfall
monthlySold comps — $/sqft
last 12 mo · ≤1 miLoading sold comps…