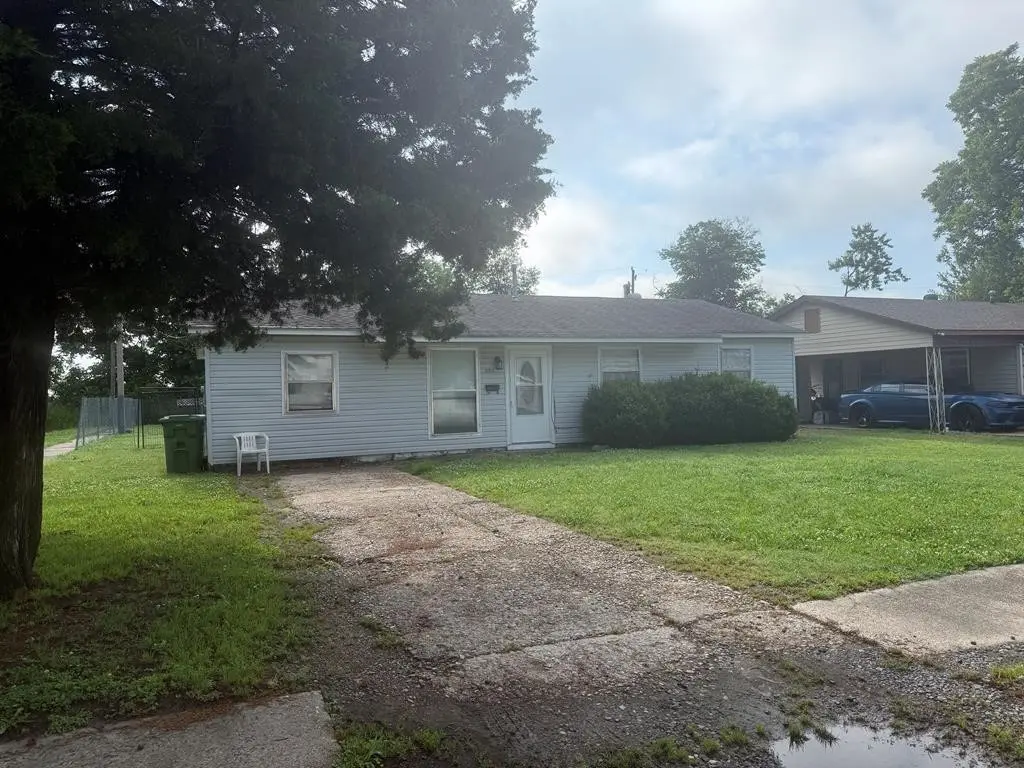
398 Summit St · Blytheville, AR
Flood risk 1/10 · Minimal
- FEMA flood zone
- X (shaded)
- Chance of flooding over 30 yrs
- 0.0%
- Est. flood insurance / yr
- $507 – $1,088
Fire risk 1/10 · Minimal
- Est. fire insurance / yr
- $1,499 – $2,785
Heat risk 6/10 · Moderate
- Hot days now (above 109°F)
- 7 days/yr
- Hot days in 30 yrs
- 20 days/yr
Wind risk 4/10 · Minor
- Chance of severe wind over 30 yrs
- 9.0%
Air-quality risk 2/10 · Minimal
- Unhealthy air days now
- 0 days/yr
- Unhealthy air days in 30 yrs
- 1 days/yr
Risk factors via First Street. Map © Google.
Why this score? — see what drove the B grade
The composite is a weighted blend of 9 inputs, each scored 0–100. Each bar is that input's sub-score; the figure is the points it added to the 100-point composite (weight × sub-score).
- Cash flow +30.0/30.0
- ARV discount +12.4/15.0
- DSCR +10.0/10.0
- 1% rule +9.0/10.0
- Livability +3.2/5.0
- Rent growth +2.5/5.0
- Condition / age +2.5/5.0
- Schools +0.8/10.0
- Appreciation +0.0/10.0
$69,900
🖨 Deal sheet (PDF) 📄 Offer letter ✓ Due diligence
Listing remarks
Great starter home or GREAT investment!! This home has been remodeled and is fully furnished, including all appliances and TVs. The home has vinyl floors, lots of closet space, and a huge den or fourth bedroom. There is a huge fenced-in back yard and ready for the next owner.
Key facts
- Remodeled
- Vinyl floors
- Lots of closet space
Tags
Property features AI
Exterior
- Parking: No garage
- Utilities: Public water; Public sewer; Natural gas available
- Home design: Single-family residence; One level; Located in the North Acres subdivision
- Construction: Vinyl siding; Slab foundation; Other roof type
- Exterior features: Corner lot; No additional exterior features listed; Patio/porch details not listed
Interior
- Bathrooms: 1 full bathroom
- Heating & cooling: Central heating; Central air conditioning; Ceiling fan(s) for cooling
- Interior features: Ceiling fans throughout; Blinds on windows; Electric water heater
Neighborhood map
What this means for you Summary
Snapshot
- This is a 4-bed/1.0-bath single-family listed at $70k.
Deal economics
- At list price, monthly cash flow is $323 ($4k/yr) — positive.
- The deal already cash-flows at list — no discount required.
- Meets the 1% rule at list price ($975 rent vs $70k).
- Cap rate 11.8% vs local median 6.8% in Blytheville — top-decile yield for the area; either an underpriced asset or a hidden risk that comps aren't pricing in. Stress-test before assuming the spread holds.
Location & tenants
- Location reads 64/100 on livability (#168 in AR) — a middle-class / working-renter tenant base. Strengths: cost of living A+, housing A+, health & safety A+; Watch: amenities D, crime F, commute F.
- Blytheville School District (town): math 8% / reading 12% proficiency, ranked #233 of 238 in AR (top 98%) — low school quality limits family demand, transient renter base, plan for 1-2y turnover; 96% free/reduced lunch — lower-income household profile, screen leases tightly.
- Zoned schools: Blytheville Primary School (431 students, 97% FRL); Blytheville Middle School (math 6% / reading 14%, grade F, #195 of 201 statewide, top 97%, 324 students, 100% FRL); Blytheville High School (math 5% / reading 14%, grade F, #280 of 292 statewide, top 96%, 460 students, 100% FRL) — zoned schools at 99% FRL track the district average.
- Market conditions: 135 active listings in the ZIP; 2 comparable units currently listed for rent nearby; 69 units permitted in Mississippi County in 2024 (0 in 5+ unit buildings).
Forward outlook
- Local home prices are declining (-3.0%/yr); year-one equity from $483 of loan paydown is wiped out by about $2k of value loss. Plan a longer hold.
- Mississippi County population projected at -30% by 2050 — secular population decline; favor cash flow + early exit over multi-decade hold.
- At projected returns (-3.0% appreciation + 3.0% rent growth), your $20k cash investment doubles in ~7 years — after that, you're playing with house money.
Negotiation context
- Only 14 days on market — expect competitive offers; lowballing is unlikely to land.
Risks & watch-outs
- Climate carrying-cost: extreme-heat days projected 7→20/yr by 2055 (HVAC capex compounding) — expect insurance premiums to compound above CPI over the hold.
Questions for the listing agent
- Built in 1968 — when were the roof, HVAC, electrical panel, plumbing, and water heater last replaced?
- Is there a deadline driving the sale (1031 exchange, divorce, estate, relocation)? That informs how much negotiation room exists.
- Schools are F-rated, which usually means shorter tenancies and higher turnover. Who's the typical renter profile here, and what's been the actual vacancy rate?
- Crime grade is F in this area — have there been break-ins, vandalism, or insurance claims at this property in the last 3 years? What carrier currently insures it and at what premium?
- What's the average days-on-market for RENTAL listings here right now (not sales)? A rising rental-DOM trend means longer vacancies and softer asking-rent achievability than the comps imply.
- What's the recent tenant-quality profile in this submarket — average credit score on applications, eviction rate, late-payment / NSF rate, and stable-employment percentage? A property-management company in the area should have these aggregated.
- How much new for-sale + rental construction is in the pipeline within 1–3 miles? Heavy new supply typically softens prices + rents 12–24 months out; constrained supply supports both.
Investment metrics
- 1% rule
- 1.40% ✓
- Cap rate
- 11.83%
- Cash-on-cash
- 19.79%
- DSCR
- 1.88
- GRM
- 6.0
CMA / ARV
- ARV (on-the-fly)
- $78,390
- Comps found
- 12
Show comp detail 12 sales within ~0.75 mi
| Address | Dist | Beds/Ba | Sqft | Sold | Price | $/sf | Match |
|---|---|---|---|---|---|---|---|
| 600 N Hollywood St | 0.15mi | 3/1.5 (-1) | 1,232 (+5%) | 11mo | $78,000 | $63 | 68 |
| 901 N Ruddle Rd N | 0.41mi | 3/2.0 (-1) | 1,120 (-4%) | 5mo | $89,900 | $80 | 60 |
| 819 Melody Ln | 0.16mi | 3/1.5 (-1) | 1,328 (+14%) | 3mo | $120,000 | $90 | 60 |
| 1133 Leawood St | 0.55mi | 3/1.5 (-1) | 1,206 (+3%) | 6mo | $114,000 | $95 | 57 |
| 1112 Ward Ln | 0.61mi | 3/1.5 (-1) | 1,168 (-0%) | 12mo | $105,000 | $90 | 54 |
| 804 Robindale Rd | 0.25mi | 3/2.0 (-1) | 1,237 (+6%) | 21mo | $35,000 | $28 | 52 |
| 114 N Hollywood St | 0.22mi | 3/1.0 (-1) | 1,056 (-10%) | 20mo | $65,000 | $62 | 52 |
| 1117 Ohio St | 0.53mi | 3/2.0 (-1) | 1,204 (+3%) | 15mo | $95,000 | $79 | 49 |
| 712 SE Parkway | 0.55mi | 3/1.0 (-1) | 1,115 (-5%) | 19mo | $38,500 | $35 | 46 |
| 1215 E Industrial Dr | 0.67mi | 3/2.0 (-1) | 1,192 (+2%) | 14mo | $19,000 | $16 | 45 |
| 820 Grandview St | 0.61mi | 3/2.5 (-1) | 1,064 (-9%) | 8mo | $55,000 | $52 | 39 |
| 301 E Missouri St E | 0.71mi | 3/1.0 (-1) | 1,308 (+12%) | 8mo | $88,000 | $67 | 36 |
Match score weights: distance 35% · size 25% · config 20% · recency 20%. Top-matched comps best support the ARV.
Projected returns pro-forma
-3.0% appreciation · 3.0% rent growth · sell at horizon
- IRR
- 11.9%
- Equity multiple
- 1.47×
- Total profit
- $9,221
- Equity at exit
- $10,422
- IRR
- 20.8%
- Equity multiple
- 2.76×
- Total profit
- $34,469
- Equity at exit
- $6,044
Cash invested: $19,572 (down + closing). Projections, not guarantees.
Landlord ↔ Tenant lean methodology
- Overall (STATE)
- 92 Strongly Landlord-Friendly
- State Arkansas
- 92 Strongly Landlord-Friendly · R+14
- County
- — inherits STATE
- City
- — inherits STATE
ZIP-level market 72315
- Home prices YoY
- -32.5%
- Active inventory
- 135
- Price-to-rent
- 6.0×
Monthly cashflow live
- Estimated rent
- $975 medium interval (Pro) →
- Mortgage (P&I)
- −$367
- Tax from tax record
- −$52 /mo · $626/yr
- Insurance
- −$29
- HOA
- −$0
- Vacancy / Maint / Mgmt
- −$205
- Net cashflow
- $323
Break-even live
Sensitivity live
| Price | -10% $362 | -5% $343 | +0% $323 | +5% $303 | +10% $283 |
|---|---|---|---|---|---|
| Rent | -10% $246 | -5% $284 | +0% $323 | +5% $361 | +10% $400 |
| Rate | -1.0pp $358 | -0.5pp $341 | base $323 | +0.5pp $305 | +1.0pp $286 |
UW: 25.0% down · 7.5% · 30yr · 1.5% tax · 5.0% vac · 8.0% maint · 8.0% mgmt
Financing live
Cash to close
- Down payment
- $17,475
- Closing costs
- $2,097
- Reserves months
- —
- Total cash needed
- —
Loan-product check · same deal, 3 products live
Conventional
25% down · 7.5% · 30yr
- Down + closing
- —
- Monthly P&I
- —
- Monthly cashflow
- —
- DSCR
- —
- Eligible?
- —
Personal DTI + credit; lowest rate.
DSCR
20% down · 8.5% · 30yr
- Down + closing
- —
- Monthly P&I
- —
- Monthly cashflow
- —
- DSCR
- —
- Eligible?
- —
No personal income docs; deal must DSCR.
Hard money
10% down · 12.0% · 12mo
- Down + closing
- —
- Monthly P&I
- —
- Monthly cashflow
- —
- DSCR
- —
- Eligible?
- —
Short-term bridge; refi at stabilization.
Rent comps 2 comps
| Address | Beds | Baths | Sqft | Rent | $/sqft | DOM | Units | Dist |
|---|---|---|---|---|---|---|---|---|
| 389 N Hollywood Ave Unit E8 Blytheville, AR | 3.0 | 1.0 | 833 | $850 | $1.02 | 21d | 1 | 0.17mi |
| 1219 E Cherry St Blytheville, AR | 4.0 | 1.0 | 1300 | $1,295 | $1.00 | 21d | 1 | 0.55mi |
Listing history 12 events
-
2026-06-19days on market $69,900 Active 14 DOM
-
2026-06-18days on market $69,900 Active 13 DOM
-
2026-06-17days on market $69,900 Active 12 DOM
-
2026-06-16days on market $69,900 Active 11 DOM
-
2026-06-15days on market $69,900 Active 10 DOM
-
2026-06-14days on market $69,900 Active 8 DOM
-
2026-06-12days on market $69,900 Active 7 DOM
-
2026-06-09days on market $69,900 Active 4 DOM
-
2026-06-08days on market $69,900 Active 3 DOM
-
2026-06-07days on market $69,900 Active 2 DOM
-
2026-06-07status $69,900 Active 1 DOM
-
2026-05-27$69,900 Active
ⓘ Source: listings_history table (triggers on properties + properties_extension) + one-shot
backfill from property_details.listing_events for pre-trigger history.
Tax reassessment forecast AR · Resets to sale price
- Current annual tax
- $626 · $52/mo
- Projected year-2 tax
- $626 · $52/mo
- Expected delta
- $0/yr ($0/mo · 0.0%)
ⓘ Screening estimate from a state-policy table — verify with the county assessor before closing.
Climate risk First Street
- Flood 1/10 Low FEMA zone X (shaded) · 0% chance over 30 yrs
- Wildfire 1/10 Low
- Heat 6/10 Major 7 d/yr ≥109°F today · 20 d/yr by 30 yrs out
- Wind 4/10 Moderate 9% chance of damaging wind over 30 yrs
- Air quality 2/10 Low 0 unhealthy d/yr today · 1 by 30 yrs out
Nearby sold comps map
Loading sold comps map…
Walkable amenities ~0.75 mi
Loading nearby amenities…
Taxation est. · year 1
- Rental income
- $11,705
- − Mortgage interest
- −$3,915
- − Property taxes
- −$626
- − Insurance
- −$350
- − Repairs & maintenance
- −$936
- − Management
- −$936
- − Depreciation
- −$2,033
- Taxable income
- $2,908
- Est. tax owed @ 24.0%
- −$698
- After-tax cash flow
- $3,175/yr
For passive investors: Depreciation is non-cash, so a rental often shows a tax loss while cash-flowing — sheltering income. Rental losses are passive: they offset passive income freely, and up to $25,000/yr can offset ordinary (W-2) income if you actively participate and your MAGI is under $100k (phasing out to $0 by $150k); unused losses carry forward. On sale, claimed depreciation is recaptured at up to 25%, and gains may owe capital-gains tax (a 1031 exchange can defer both). Figures are a year-1 estimate at your 24.0% rate — not tax advice; consult a CPA.
Schools (NCES district)
- District
- Blytheville School District
- NCES district ID
- 0503320
- Math proficiency
- 8% ▼ -11.00%
- Reading proficiency
- 12% ▼ -9.00%
- Median HH income
- $33,356
- Composite
- 8.02/100
- National rank
- #9922
- State rank
- #233 of 238 in AR
Livability — Blytheville
- Score
- 64/100
- State rank
- #168
- US rank
- #14094
Category grades
Schools grade is shown separately in the Schools card above.
Census & demographics
- Census place
- Blytheville, AR
- City population
- 20,100
- Population (ZIP)
- 20,100
Population outlook (Mississippi County) Hauer SSP2
- Today (2025)
- 38,959 people
- By 2030
- 36,401 · -6.6%
- By 2040
- 31,526 · -19.1%
- By 2050
- 27,058 · -30.5%
- By 2075
- 17,847 · -54.2%
- By 2100
- 11,024 · -71.7%
Race, ethnicity, and origin ACS 2023
- Neighborhood character
- Diverse neighborhood (Simpson 0.57)
- Race & ethnicity
- White 50% Black 42% Hispanic / Latino 4% Two or more races 4%
- Common ancestry
- Iranian 3% Italian 1% Slovak 1%
- Foreign-born
- 3% · Canada
- Languages at home
- 96% English-only · Spanish 3%
Political lean MEDSL · Mississippi
- 2024 margin
- Solid R (+31.6) · D 33.4% · R 65.0% · Other 1.7%
- 2008→2024 swing
- -29.4pp toward R · 2008: -2.2pp · 2024: -31.6pp
- All cycles
- 2024: R+31.6 2020: R+22.2 2016: R+10.5 2012: R+1.1 2008: R+2.2
Not yet ingested
- Civics
- —
Market trends
- HPI YoY
- ▼ -84.32%
- Current HPI
- 175.5603
- Rent YoY
- —
- Metro
- —
- State GDP YoY
- ▲ 3.80%
- F500 in state
- 10
Industry mix (Fortune 500 HQ in AR)
| Industry | F500 HQs | Revenue |
|---|---|---|
| Retail | 1 | $681B |
|
||
| Food / Agriculture | 1 | $53B |
|
||
| Retail / Energy | 1 | $22B |
|
||
| Transportation / Logistics | 1 | $12B |
|
||
| Energy | 1 | $4B |
|
||
Price history
1 event — show timeline
- 2026-05-27 Listed $69,900 EARA
Property tax history
+0.0%/yrLatest (2025): $626 · +0.0% YoY. Source: county tax records.
Cash-flow waterfall
monthlySold comps — $/sqft
last 12 mo · ≤1 miLoading sold comps…