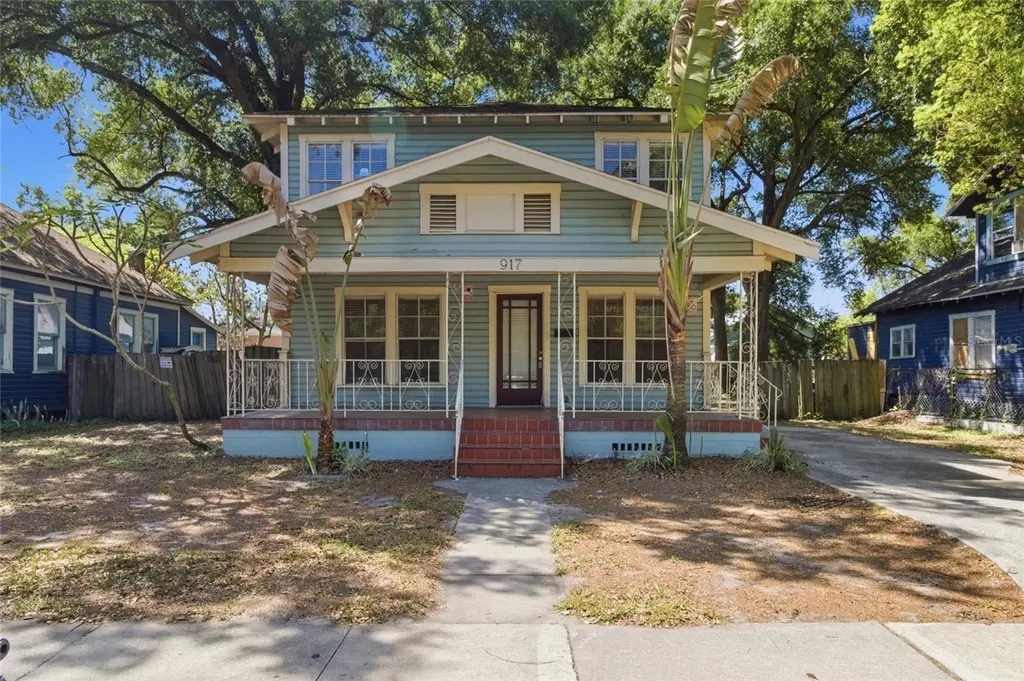
917 E 26th Ave · Tampa, FL
Flood risk 1/10 · Minimal
- FEMA flood zone
- X (unshaded)
- Chance of flooding over 30 yrs
- 0.0%
- Est. flood insurance / yr
- $507 – $1,088
Fire risk 1/10 · Minimal
- Est. fire insurance / yr
- $947 – $1,759
Heat risk 10/10 · Severe
- Hot days now (above 107°F)
- 7 days/yr
- Hot days in 30 yrs
- 26 days/yr
Wind risk 9/10 · Severe
- Chance of severe wind over 30 yrs
- 99.0%
Air-quality risk 3/10 · Minor
- Unhealthy air days now
- 3 days/yr
- Unhealthy air days in 30 yrs
- 4 days/yr
Risk factors via First Street. Map © Google.
Why this score? — see what drove the C- grade
The composite is a weighted blend of 9 inputs, each scored 0–100. Each bar is that input's sub-score; the figure is the points it added to the 100-point composite (weight × sub-score).
- Cash flow +14.8/30.0
- Appreciation +10.0/10.0
- ARV discount +7.5/15.0
- DSCR +4.5/10.0
- Schools +4.2/10.0
- Livability +4.0/5.0
- 1% rule +3.6/10.0
- Rent growth +2.6/5.0
- Condition / age +2.5/5.0
$325,000
🖨 Deal sheet 📄 Offer letter ✓ Due diligence
Listing remarks MLS
Own a piece of history with this 4-bedroom, 2-bath, two-story Key West-style charmer located in the historic Ybor Heights area of Tampa. Built in 1915, this 1,612 sq ft home is full of character and ready for updates and repairs to restore it to its full potential. The first floor features a living room, dining room, kitchen, and a primary bedroom with an ensuite bath. Upstairs, you’ll find a hallway leading to three additional bedrooms and a full bath, offering plenty of space for comfortable living. Step out the rear kitchen door onto a large wooden deck overlooking the fenced backyard—an ideal setting for entertaining, barbecuing, and enjoying Florida’s warm weather with family and friends. This property has been an income-producing rental since 2014, and the seller has never occupied the home. It presents an excellent opportunity for investors or buyers looking to renovate a historic property. Conveniently located just 1.9 miles from Ybor City and 2 miles to downtown Tampa/Channelside, with easy access to Interstate 275 and Interstate 4 for commuting and exploring the area. Roof age is unknown, Small Repairs were completed No Replacement: HVAC 2 units 2019 and 2023: Hot water heater 2018:
Key facts
- Large wooden deck
- Key west style
- Fenced backyard
Tags
Neighborhood map
What this means for you Summary
Snapshot
- This is a 4-bed/2.0-bath single-family listed at $325k.
Deal economics
- At list price, monthly cash flow is $90 ($1k/yr) — positive.
- The deal already cash-flows at list — no discount required.
- To meet the 1% rule (rent ≥ 1% of price), the offer needs to be $278k (14.4% below list).
- Recommended offer: $278k (14.4% below list) — sets the bar for 1% rule.
Location & tenants
- Location reads 79/100 on livability (#142 in FL, #2,135 nationally) — a middle-class / working-renter tenant base. Strengths: commute A+, housing A+, health & safety A+; Watch: schools C-, crime D+.
- Hillsborough (suburban): math 47% / reading 50% proficiency, ranked #41 of 73 in FL (top 56%) — families likely to look elsewhere, expect single-tenant / working-renter base with shorter leases.
- Market conditions: Rents flat; 187 active listings in the ZIP; 40 comparable units currently listed for rent nearby; rentals at typical pace (median 18d on market — plan ~3-4 weeks tenant-placement turnaround); lower-income renter base — watch delinquency; 9,053 units permitted in Hillsborough County in 2024 (4,555 in 5+ unit buildings).
- At $2,783/mo this rent would consume 90% of the median local household income ($37k/yr) (locally 1374% of renters already pay >50% of income on rent) — very limited rent-growth headroom before tenants either downsize or default.
Forward outlook
- In year one you build about $35k of equity ($2k loan paydown + $32k appreciation (10.0% local appreciation)).
- Hillsborough County population projected at +37% by 2050 — long-run rental-demand tailwind backs the buy-and-hold thesis.
- At projected returns (10.0% appreciation + 0.6% rent growth), your $91k cash investment doubles in ~3 years — after that, you're playing with house money.
- By year 2, paydown + projected appreciation supports a ~$56k cash-out refi (75% LTV) — recoverable capital for the next deal without selling this one.
Negotiation context
- It's been on market 63 days — a 6% lower offer ($306k) is reasonable based on typical stale-listing flexibility.
- 5 sale attempts since 21y ago with the ask held roughly flat each time — persistent listings suggest the price (not the market) is what's stuck; bring a comps-based counter.
- Current owner paid $23k; list at $325k implies a 1313% gain — meaningful room to come down on a strong offer.
Risks & watch-outs
- Watch-outs: built in 1915 — expect roof / HVAC / electrical / plumbing capex.
- Climate carrying-cost: severe wind risk, 99% chance of damaging wind over 30y; extreme-heat days projected 7→26/yr by 2055 (HVAC capex compounding) — expect insurance premiums to compound above CPI over the hold.
Questions for the listing agent
- It's been on market 63 days. Have you received any prior offers? Is the seller open to a 14% concession, seller financing, or rate buy-down credit?
- Built in 1915 — when were the roof, HVAC, electrical panel, plumbing, and water heater last replaced?
- Why hasn't it sold? Are there any deal-killer items the seller is aware of (foundation, flood, title, zoning, code violations)?
- Is there a deadline driving the sale (1031 exchange, divorce, estate, relocation)? That informs how much negotiation room exists.
- Crime grade is D in this area — have there been break-ins, vandalism, or insurance claims at this property in the last 3 years? What carrier currently insures it and at what premium?
- What's the average days-on-market for RENTAL listings here right now (not sales)? A rising rental-DOM trend means longer vacancies and softer asking-rent achievability than the comps imply.
- What's the recent tenant-quality profile in this submarket — average credit score on applications, eviction rate, late-payment / NSF rate, and stable-employment percentage? A property-management company in the area should have these aggregated.
- How much new for-sale + rental construction is in the pipeline within 1–3 miles? Heavy new supply typically softens prices + rents 12–24 months out; constrained supply supports both.
Investment metrics
- 1% rule
- 0.86% ✗
- Cap rate
- 6.63%
- Cash-on-cash
- 1.19%
- DSCR
- 1.05
- GRM
- 9.7
CMA / ARV
No comps found within radius.
Projected returns pro-forma
10.0% appreciation · 0.58% rent growth · sell at horizon
- IRR
- 24.3%
- Equity multiple
- 2.94×
- Total profit
- $176,096
- Equity at exit
- $292,786
- IRR
- 21.0%
- Equity multiple
- 6.51×
- Total profit
- $501,824
- Equity at exit
- $631,404
Cash invested: $91,000 (down + closing). Projections, not guarantees.
Landlord ↔ Tenant lean methodology
- Overall (STATE)
- 87 Strongly Landlord-Friendly
- State Florida
- 87 Strongly Landlord-Friendly · R+3
- County
- — inherits STATE
- City
- — inherits STATE
ZIP-level market 33605
- Home prices YoY
- 3.7%
- Rents YoY
- 0.6%
- Active inventory
- 187
- Price-to-rent
- 9.7×
Monthly cashflow live
- Estimated rent
- $2,783 high interval (Pro) →
- Mortgage (P&I)
- −$1,704
- Tax from tax record
- −$268 /mo · $3,222/yr
- Insurance
- −$135
- HOA
- −$0
- Vacancy / Maint / Mgmt
- −$584
- Net cashflow
- $90
Break-even live
UW: 25.0% down · 7.5% · 30yr · 1.5% tax · 5.0% vac · 8.0% maint · 8.0% mgmt
Financing live
Cash to close
- Down payment
- $81,250
- Closing costs
- $9,750
- Reserves months
- —
- Total cash needed
- —
Loan-product check · same deal, 3 products live
Conventional
25% down · 7.5% · 30yr
- Down + closing
- —
- Monthly P&I
- —
- Monthly cashflow
- —
- DSCR
- —
- Eligible?
- —
Personal DTI + credit; lowest rate.
DSCR
20% down · 8.5% · 30yr
- Down + closing
- —
- Monthly P&I
- —
- Monthly cashflow
- —
- DSCR
- —
- Eligible?
- —
No personal income docs; deal must DSCR.
Hard money
10% down · 12.0% · 12mo
- Down + closing
- —
- Monthly P&I
- —
- Monthly cashflow
- —
- DSCR
- —
- Eligible?
- —
Short-term bridge; refi at stabilization.
Rent comps 40 comps
| Address | Beds | Baths | Sqft | Rent | $/sqft | DOM | Units | Dist |
|---|---|---|---|---|---|---|---|---|
| 916 E 25th Ave Tampa, FL | 3.0 | 2.0 | 1525 | $2,600 | $1.70 | 10d | 1 | 0.04mi |
| 3511 Cone Ct Tampa, FL | 3.0 | 2.0 | 1256 | $2,200 | $1.75 | 5d | 1 | 0.22mi |
| 3519 N 10th St Tampa, FL | 3.0 | 2.0 | 1200 | $1,850 | $1.54 | 17d | 1 | 0.24mi |
| 809 E Baker St Unit A Tampa, FL | 3.0 | 1.0 | 1083 | $2,200 | $2.03 | 24d | 1 | 0.26mi |
| 515 E Adalee St Tampa, FL | 3.0 | 2.0 | 1552 | $2,650 | $1.71 | 5d | 1 | 0.28mi |
| 3601 N 13th St Tampa, FL | 3.0 | 2.5 | 1800 | $2,550 | $1.42 | 24d | 1 | 0.35mi |
| 2825 N Taliaferro Ave Tampa, FL | 4.0 | 2.0 | 1484 | $3,500 | $2.36 | 24d | 1 | 0.36mi |
| 1003 E 19th Ave Unit 1053143P Tampa, FL | 4.0 | 3.0 | 1614 | $4,674 | $2.90 | 3d | 1 | 0.38mi |
| 411 E Adalee St Tampa, FL | 3.0 | 1.0 | 1200 | $2,500 | $2.08 | 24d | 1 | 0.39mi |
| 1305 E Louise Ave Tampa, FL | 3.0 | 2.0 | 1384 | $2,700 | $1.95 | 24d | 1 | 0.47mi |
| 3021 Sanchez St Tampa, FL | 3.0 | 1.0 | 1300 | $2,195 | $1.69 | 24d | 1 | 0.50mi |
| 3210 N 16th St Tampa, FL | 4.0 | 2.0 | 1380 | $1,995 | $1.45 | 21d | 1 | 0.51mi |
| 3210 N 16th St Tampa, FL | 4.0 | 2.0 | 1380 | $1,875 | $1.36 | 2d | 1 | 0.51mi |
| 2904 N Jefferson St Tampa, FL | 4.0 | 3.0 | 2078 | $4,400 | $2.12 | 5d | 1 | 0.52mi |
| 1520 E 21st Ave Tampa, FL | 3.0 | 2.0 | 1671 | $2,350 | $1.41 | 16d | 1 | 0.53mi |
| 309 E Selma Ave Tampa, FL | 3.0 | 2.0 | 1170 | $3,095 | $2.65 | 5d | 1 | 0.63mi |
| 1504 E 33rd Ave Tampa, FL | 3.0 | 2.0 | 1108 | $2,900 | $2.62 | 24d | 1 | 0.65mi |
| 418 E Amelia Ave Unit A Tampa, FL | 3.0 | 2.0 | 1050 | $1,800 | $1.71 | 24d | 1 | 0.65mi |
| 102 W Adalee St #4 Tampa, FL | 3.0 | 3.5 | 2175 | $4,950 | $2.28 | 24d | 1 | 0.68mi |
| 807 E Genesee St Unit 1/2 Tampa, FL | 3.0 | 2.0 | 1414 | $2,400 | $1.70 | 21d | 1 | 0.71mi |
| 807 E Genesee St Tampa, FL | 3.0 | 2.0 | 1414 | $2,400 | $1.70 | 20d | 1 | 0.71mi |
| 210 E Columbus Dr Unit A Tampa, FL | 4.0 | 2.5 | 2050 | $3,995 | $1.95 | 5d | 1 | 0.71mi |
| 4017 N Seminole Ave Tampa, FL | 4.0 | 1.0 | 1104 | $1,950 | $1.77 | 24d | 1 | 0.71mi |
| 1807 E 20th Ave Tampa, FL | 3.0 | 2.0 | 1131 | $2,900 | $2.56 | 24d | 1 | 0.76mi |
| 1108 E Chelsea St Tampa, FL | 3.0 | 2.0 | 1637 | $3,250 | $1.99 | 24d | 1 | 0.80mi |
| 2807 N Highland Ave Tampa, FL | 4.0 | 2.0 | 1312 | $3,128 | $2.38 | 5d | 1 | 0.82mi |
| 307 W Woodlawn Ave Tampa, FL | 4.0 | 3.0 | 1274 | $3,095 | $2.43 | 3d | 1 | 0.83mi |
| 1602 E North Bay St Tampa, FL | 3.0 | 2.0 | 1200 | $2,100 | $1.75 | 24d | 1 | 0.84mi |
| 206 W Warren Ave Unit 1053150P Tampa, FL | 3.0 | 2.0 | 1323 | $3,699 | $2.80 | 5d | 1 | 0.86mi |
| 2708 N 19th St Tampa, FL | 3.0 | 2.0 | 1680 | $2,200 | $1.31 | 16d | 1 | 0.86mi |
| 2910 N Ola Ave Unit 1300725P Tampa, FL | 3.0 | 2.0 | 2206 | $4,334 | $1.96 | 3d | 1 | 0.89mi |
| 1301 E Cayuga St Tampa, FL | 3.0 | 1.5 | 1216 | $2,200 | $1.81 | 24d | 1 | 0.91mi |
| 2108 E 22nd Ave Tampa, FL | 3.0 | 3.0 | 1308 | $2,100 | $1.61 | 3d | 1 | 0.92mi |
| 2108 E 22nd Ave Tampa, FL | 3.0 | 3.0 | 1308 | $2,100 | $1.61 | 5d | 1 | 0.92mi |
| 2904 Banza St Tampa, FL | 4.0 | 3.0 | 2031 | $3,200 | $1.58 | 24d | 1 | 0.92mi |
| 3906 N Ola Ave Tampa, FL | 3.0 | 2.0 | 1225 | $2,575 | $2.10 | 24d | 1 | 0.94mi |
| 2002 E 18th Ave Tampa, FL | 4.0 | 2.0 | 1084 | $2,400 | $2.21 | 5d | 1 | 0.94mi |
| 212 W North Bay St Tampa, FL | 3.0 | 1.0 | 1065 | $2,600 | $2.44 | 3d | 1 | 0.95mi |
| 310 W Warren Ave Unit 1372309P Tampa, FL | 3.0 | 2.0 | 1302 | $4,552 | $3.50 | 2d | 1 | 0.95mi |
| 3916 N Ola Ave Tampa, FL | 3.0 | 2.0 | 1673 | $3,200 | $1.91 | 17d | 1 | 0.97mi |
Listing history 27 events
-
2026-06-18days on market $325,000 Active 63 DOM
-
2026-06-17days on market $325,000 Active 62 DOM
-
2026-06-16days on market $325,000 Active 61 DOM
-
2026-06-15days on market $325,000 Active 60 DOM
-
2026-06-13days on market $325,000 Active 58 DOM
-
2026-06-13days on market $325,000 Active 57 DOM
-
2026-06-09days on market $325,000 Active 54 DOM
-
2026-06-08days on market $325,000 Active 53 DOM
-
2026-06-07days on market $325,000 Active 52 DOM
-
2026-06-04days on market $325,000 Active 49 DOM
-
2026-06-03days on market $325,000 Active 48 DOM
-
2026-06-02days on market $325,000 Active 47 DOM
-
2026-06-01days on market $325,000 Active 46 DOM
-
2026-05-31days on market $325,000 Active 45 DOM
-
2026-05-13price $325,000 1229-char remark
Show marketing remark (1229 chars)
Own a piece of history with this 4-bedroom, 2-bath, two-story Key West-style charmer located in the historic Ybor Heights area of Tampa. Built in 1915, this 1,612 sq ft home is full of character and ready for updates and repairs to restore it to its full potential. The first floor features a living room, dining room, kitchen, and a primary bedroom with an ensuite bath. Upstairs, you’ll find a hallway leading to three additional bedrooms and a full bath, offering plenty of space for comfortable living. Step out the rear kitchen door onto a large wooden deck overlooking the fenced backyard—an ideal setting for entertaining, barbecuing, and enjoying Florida’s warm weather with family and friends. This property has been an income-producing rental since 2014, and the seller has never occupied the home. It presents an excellent opportunity for investors or buyers looking to renovate a historic property. Conveniently located just 1.9 miles from Ybor City and 2 miles to downtown Tampa/Channelside, with easy access to Interstate 275 and Interstate 4 for commuting and exploring the area. Roof age is unknown, Small Repairs were completed No Replacement: HVAC 2 units 2019 and 2023: Hot water heater 2018:
-
2026-04-16$330,000 Active 1229-char remark
Show marketing remark (1229 chars)
Own a piece of history with this 4-bedroom, 2-bath, two-story Key West-style charmer located in the historic Ybor Heights area of Tampa. Built in 1915, this 1,612 sq ft home is full of character and ready for updates and repairs to restore it to its full potential. The first floor features a living room, dining room, kitchen, and a primary bedroom with an ensuite bath. Upstairs, you’ll find a hallway leading to three additional bedrooms and a full bath, offering plenty of space for comfortable living. Step out the rear kitchen door onto a large wooden deck overlooking the fenced backyard—an ideal setting for entertaining, barbecuing, and enjoying Florida’s warm weather with family and friends. This property has been an income-producing rental since 2014, and the seller has never occupied the home. It presents an excellent opportunity for investors or buyers looking to renovate a historic property. Conveniently located just 1.9 miles from Ybor City and 2 miles to downtown Tampa/Channelside, with easy access to Interstate 275 and Interstate 4 for commuting and exploring the area. Roof age is unknown, Small Repairs were completed No Replacement: HVAC 2 units 2019 and 2023: Hot water heater 2018:
-
2013-11-07soldstatus $23,000 9-char remark
Show marketing remark (9 chars)
TOO LATE!
-
2012-11-23$23,000 9-char remark
Show marketing remark (9 chars)
TOO LATE!
-
2012-09-28historical
-
2011-10-09$60,000
-
2006-06-28soldstatus $185,000
-
2006-06-26soldstatus $185,000
-
2006-03-17$185,000
-
2005-09-28$185,000
-
2000-08-16soldstatus $69,800
-
1998-10-26soldstatus $27,000
-
1995-11-03soldstatus $14,400
ⓘ Source: listings_history table (triggers on properties + properties_extension) + one-shot
backfill from property_details.listing_events for pre-trigger history.
Tax reassessment forecast FL · Resets to sale price
- Current annual tax
- $3,222 · $268/mo
- Projected year-2 tax
- $3,222 · $268/mo
- Expected delta
- $0/yr ($0/mo · -0.0%)
ⓘ Screening estimate from a state-policy table — verify with the county assessor before closing.
Climate risk First Street
- Flood 1/10 Low FEMA zone X (unshaded) · 0% chance over 30 yrs
- Wildfire 1/10 Low
- Heat 10/10 Extreme 7 d/yr ≥107°F today · 26 d/yr by 30 yrs out
- Wind 9/10 Extreme 99% chance of damaging wind over 30 yrs
- Air quality 3/10 Moderate 3 unhealthy d/yr today · 4 by 30 yrs out
Nearby sold comps map
Loading sold comps map…
Walkable amenities ~0.75 mi
Loading nearby amenities…
Taxation est. · year 1
- Rental income
- $33,396
- − Mortgage interest
- −$18,205
- − Property taxes
- −$3,222
- − Insurance
- −$1,625
- − Repairs & maintenance
- −$2,672
- − Management
- −$2,672
- − Depreciation
- −$9,455
- Taxable loss
- −$4,454
- Est. tax savings @ 24.0%
- +$1,069
- After-tax cash flow
- $2,153/yr
For passive investors: Depreciation is non-cash, so a rental often shows a tax loss while cash-flowing — sheltering income. Rental losses are passive: they offset passive income freely, and up to $25,000/yr can offset ordinary (W-2) income if you actively participate and your MAGI is under $100k (phasing out to $0 by $150k); unused losses carry forward. On sale, claimed depreciation is recaptured at up to 25%, and gains may owe capital-gains tax (a 1031 exchange can defer both). Figures are a year-1 estimate at your 24.0% rate — not tax advice; consult a CPA.
Schools (NCES district)
- District
- Hillsborough
- NCES district ID
- 1200870
- Math proficiency
- 47% ▼ -8.00%
- Reading proficiency
- 50% ▼ -4.00%
- Median HH income
- $50,622
- Composite
- 41.6/100
- National rank
- #3435
- State rank
- #41 of 73 in FL
Livability — Tampa
- Score
- 79/100
- State rank
- #142
- US rank
- #2135
Category grades
Schools grade is shown separately in the Schools card above.
Census & demographics
- Census place
- Tampa, FL
- County
- Hillsborough County · 1,540,968 people
- City population
- 523,346
- Metro
- Tampa-St. Petersburg-Clearwater, FL
- Population (ZIP)
- 16,030
- Household income
- $36,975
- Rent vs Own
- Severe rent burden
- 1374.0
Population outlook (Hillsborough County) Hauer SSP2
- Today (2025)
- 1,607,022 people
- By 2030
- 1,733,968 · +7.9%
- By 2040
- 1,979,565 · +23.2%
- By 2050
- 2,203,427 · +37.1%
- By 2075
- 2,667,893 · +66.0%
- By 2100
- 2,891,558 · +79.9%
Race, ethnicity, and origin ACS 2023
- Neighborhood character
- Diverse neighborhood (Simpson 0.66)
- Race & ethnicity
- Black 48% Hispanic / Latino 28% Two or more races 18% White 17% Asian 1%
- Hispanic origin (detail)
- Mexican 6% Puerto Rican 8% Cuban 6% Dominican 1%
- Common ancestry
- Hispanic 2% Romanian 1% Lithuanian 1%
- Foreign-born
- 17% · Canada, Vietnam, Jamaica
- Languages at home
- 72% English-only · Spanish 24% French/Haitian/Cajun 3% Other Asian/Pacific 1%
Political lean MEDSL · Hillsborough
- 2024 margin
- Toss-up / Even · D 47.8% · R 50.9% · Other 1.3%
- 2008→2024 swing
- -10.2pp toward R · 2008: 7.1pp · 2024: -3.1pp
- All cycles
- 2024: R+3.1 2020: D+6.9 2016: D+6.8 2012: D+6.7 2008: D+7.1
Not yet ingested
- Civics
- —
Market trends
- HPI YoY
- ▲ 17.43%
- Current HPI
- 494.1871
- Rent YoY
- ▲ 0.58%
- Metro
- Tampa-St. Petersburg-Clearwater, FL
- State GDP YoY
- ▲ 3.28%
- F500 in state
- 36
Industry mix (Fortune 500 HQ in FL)
| Industry | F500 HQs | Revenue |
|---|---|---|
| Industrial Technology | 2 | $29B |
|
||
| Insurance | 2 | $17B |
|
||
| Retail | 1 | $60B |
|
||
| Technology Distribution | 1 | $58B |
|
||
| Homebuilding | 1 | $35B |
|
||
| Technology Manufacturing | 1 | $35B |
|
||
Price history
+2156.9% since first listed13 events — show timeline
- 2026-05-13 Price Changed $325,000 Stellar MLS as Distributed by MLS Grid
- 2026-04-16 Listed $330,000 Stellar MLS as Distributed by MLS Grid
- 2013-11-07 Sold (MLS) $23,000 Stellar MLS as Distributed by MLS Grid
- 2012-11-23 Listed $23,000 Stellar MLS as Distributed by MLS Grid
- 2012-09-28 Listing Removed — Stellar MLS as Distributed by MLS Grid
- 2011-10-09 Listed $60,000 Stellar MLS as Distributed by MLS Grid
- 2006-06-28 Sold (Public Records) $185,000 Public Records
- 2006-06-26 Sold (MLS) $185,000 Stellar MLS as Distributed by MLS Grid
- 2006-03-17 Listed $185,000 Stellar MLS as Distributed by MLS Grid
- 2005-09-28 Listed $185,000 Stellar MLS as Distributed by MLS Grid
- 2000-08-16 Sold (Public Records) $69,800 Public Records
- 1998-10-26 Sold (Public Records) $27,000 Public Records
- 1995-11-03 Sold (Public Records) $14,400 Public Records
Property tax history
+46.8%/yrLatest (2025): $3,222 · +11.2% YoY. Source: county tax records.
Cash-flow waterfall
monthlySold comps — $/sqft
last 12 mo · ≤1 miLoading sold comps…