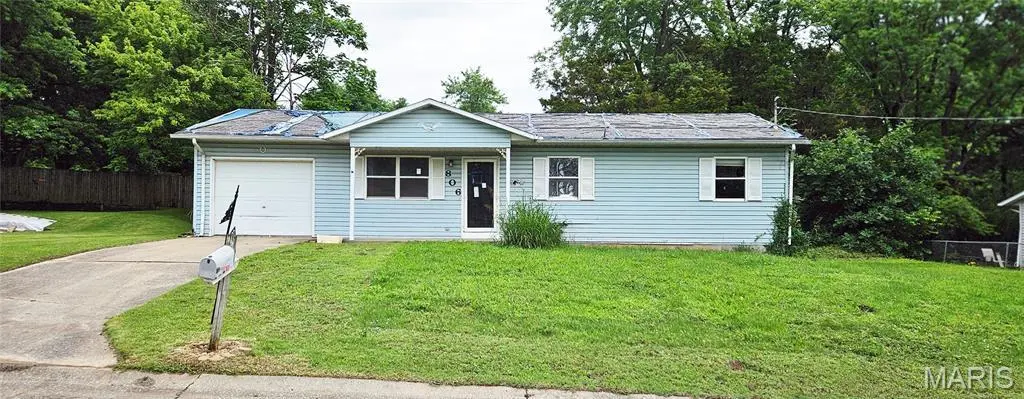
806 Andrew St · Jackson, MO
Flood risk 1/10 · Minimal
- FEMA flood zone
- X (unshaded)
- Chance of flooding over 30 yrs
- 0.0%
- Est. flood insurance / yr
- $473 – $860
Fire risk 3/10 · Minor
- Est. fire insurance / yr
- $1,054 – $1,958
Heat risk 5/10 · Moderate
- Hot days now (above 109°F)
- 7 days/yr
- Hot days in 30 yrs
- 22 days/yr
Wind risk 2/10 · Minimal
- Chance of severe wind over 30 yrs
- 3.0%
Air-quality risk 2/10 · Minimal
- Unhealthy air days now
- 0 days/yr
- Unhealthy air days in 30 yrs
- 1 days/yr
Risk factors via First Street. Map © Google.
Why this score? — see what drove the D+ grade
The composite is a weighted blend of 9 inputs, each scored 0–100. Each bar is that input's sub-score; the figure is the points it added to the 100-point composite (weight × sub-score).
- Cash flow +15.0/30.0
- ARV discount +7.5/15.0
- 1% rule +5.0/10.0
- DSCR +5.0/10.0
- Schools +4.0/10.0
- Rent growth +3.6/5.0
- Livability +3.5/5.0
- Condition / age +2.5/5.0
- Appreciation +0.0/10.0
$25,460
🖨 Deal sheet 📄 Offer letter ✓ Due diligence
Listing remarks
Whoa - hold up! This was one of those cases where so much junk was left behind I just knew Oscar the Grouch was gonna jump out from behind a pile of "who knows what" and just go to town gnawing on my ankle like a chicken bone! Luckily you don't have to take such risks when you come to check out this fixer-upper that just hit the market in Jackson, MO. .. because the clean-out crew did a great job hauling everything off! If 'ol Oscar was ever hiding in there - well, he's off to the next one now! If you've been shopping for a home in this area for long then you already know that fixer-upper or not - opportunities for a 3 bedroom 1 bath with attached garage and basement in a sol
Key facts
- 8,058 sq ft lot
- Garage
- Built 1989
Property features AI
Finance
- Other: Lot dimensions approximately 95 x 86 (0.185 acre); Road surface: asphalt; Lot size source: public records
- Financial info: Property offered via auction; Lease not considered
Exterior
- Parking: Attached garage that faces front (1-car); Concrete driveway/parking
- Utilities: Public water; Public sewer; Electricity connected (220 volts); Natural gas connected; Cable and phone available
- Home design: Single-family residence; One story; House structure; Ownership: Government; Fixer condition
- Construction: Vinyl siding and frame construction with asphalt and concrete elements; Asphalt roof; Concrete perimeter foundation; Built area (above grade) from public records: 1,008
- Exterior features: Back yard and front yard; City lot; Asphalt road frontage
Interior
- Kitchen: Kitchen on the main level
- Bedrooms: 3 bedrooms on the main level
- Flooring: Carpet, laminate and vinyl flooring
- Bathrooms: 1 full bathroom on the main level
- Heating & cooling: Forced air heating (natural gas); Central air conditioning
- Interior features: Basement: concrete, full and unfinished; 6 total rooms
- Laundry & utility: Utilities include natural gas and 220V electric
Neighborhood map
What this means for you Summary
Snapshot
- This is a 3-bed/1.0-bath single-family listed at $25k.
Deal economics
- At list price, monthly cash flow is $836 ($10k/yr) — positive.
- The deal already cash-flows at list — no discount required.
- Meets the 1% rule at list price ($1k rent vs $25k).
- Recommended offer: $25k (1.5% below list) — sets the bar for market timing.
- Cap rate 45.7% vs local median 3.4% in Jackson — top-decile yield for the area; either an underpriced asset or a hidden risk that comps aren't pricing in. Stress-test before assuming the spread holds.
Location & tenants
- Location reads 69/100 on livability (#160 in MO) — a middle-class / working-renter tenant base. Strengths: crime A+, cost of living A+, housing A+; Watch: amenities F, commute F, health & safety F.
- Jackson R-II (suburban): math 41% / reading 51% proficiency, ranked #73 of 324 in MO (top 22%) — families likely to look elsewhere, expect single-tenant / working-renter base with shorter leases.
- Zoned schools: Orchard Drive Elem. (math 37% / reading 42%, grade F, #537 of 1,115 statewide, top 53%, 388 students, 52% FRL); Jackson Sr. High (math 45% / reading 62%, grade C-, #83 of 521 statewide, top 16%, 1,764 students, 30% FRL).
- Market conditions: Rents rising fast (+4.5%/yr); 176 active listings in the ZIP; 1 comparable units currently listed for rent nearby; solid renter incomes; 81 units permitted in Cape Girardeau County in 2024 (0 in 5+ unit buildings).
Forward outlook
- Local home prices are declining (-3.0%/yr); year-one equity from $176 of loan paydown is wiped out by about $764 of value loss. Plan a longer hold.
- Cape Girardeau County population projected at +17% by 2050 — long-run rental-demand tailwind backs the buy-and-hold thesis.
- At projected returns (-3.0% appreciation + 4.5% rent growth), your $7k cash investment doubles in ~1 year — after that, you're playing with house money.
Negotiation context
- It's been on market 15 days — a 2% lower offer ($25k) is reasonable based on typical stale-listing flexibility.
Risks & watch-outs
- Watch-outs: property tax is 3.4% of price.
- Climate carrying-cost: extreme-heat days projected 7→22/yr by 2055 (HVAC capex compounding) — expect insurance premiums to compound above CPI over the hold.
Questions for the listing agent
- Property tax is high relative to price — has the assessment been appealed recently, and will the sale trigger a re-assessment?
- Is there a deadline driving the sale (1031 exchange, divorce, estate, relocation)? That informs how much negotiation room exists.
- The area grade is low — what's the realistic commute time and amenity access for the typical tenant pool here? Any planned neighborhood developments (good or bad) we should know about?
- What's the average days-on-market for RENTAL listings here right now (not sales)? A rising rental-DOM trend means longer vacancies and softer asking-rent achievability than the comps imply.
- What's the recent tenant-quality profile in this submarket — average credit score on applications, eviction rate, late-payment / NSF rate, and stable-employment percentage? A property-management company in the area should have these aggregated.
- How much new for-sale + rental construction is in the pipeline within 1–3 miles? Heavy new supply typically softens prices + rents 12–24 months out; constrained supply supports both.
Investment metrics
- 1% rule
- 5.23% ✓
- Cap rate
- 45.71%
- Cash-on-cash
- 140.79%
- DSCR
- 7.26
- GRM
- 1.6
CMA / ARV
- ARV (on-the-fly)
- $173,376
- Comps found
- 12
Show comp detail 12 sales within ~0.75 mi
| Address | Dist | Beds/Ba | Sqft | Sold | Price | $/sf | Match |
|---|---|---|---|---|---|---|---|
| 723 August St | 0.08mi | 3/1.5 | 1,008 (0%) | 3mo | $189,900 | $188 | 92 |
| 911 Odus Dr | 0.06mi | 3/2.0 | 1,060 (+5%) | 0mo | $170,000 | $160 | 85 |
| 805 Andrew St | 0.02mi | 4/1.5 (+1) | 972 (-4%) | 2mo | $190,000 | $195 | 85 |
| 688 N Hope St | 0.38mi | 2/1.0 (-1) | 1,025 (+2%) | 2mo | $164,900 | $161 | 73 |
| 905 Greensferry Rd | 0.33mi | 2/1.0 (-1) | 988 (-2%) | 9mo | $165,000 | $167 | 69 |
| 408 N Donald St | 0.46mi | 3/1.0 | 1,060 (+5%) | 2mo | $175,000 | $165 | 68 |
| 409 N Maryland St | 0.34mi | 3/1.0 | 902 (-10%) | 10mo | $161,000 | $178 | 58 |
| 417 Plain View Ave | 0.38mi | 2/1.0 (-1) | 869 (-14%) | 2mo | $149,900 | $172 | 53 |
| 535 Goodson Dr | 0.45mi | 3/2.0 | 1,128 (+12%) | 6mo | $179,900 | $159 | 50 |
| 211 N Russell Ave | 0.73mi | 2/1.0 (-1) | 970 (-4%) | 7mo | $109,900 | $113 | 49 |
| 1003 Anna St | 0.70mi | 2/1.0 (-1) | 884 (-12%) | 5mo | $165,000 | $187 | 38 |
| 729 Wedge Ln | 0.63mi | 2/2.0 (-1) | 1,140 (+13%) | 11mo | $205,000 | $180 | 30 |
Match score weights: distance 35% · size 25% · config 20% · recency 20%. Top-matched comps best support the ARV.
Projected returns pro-forma
-3.0% appreciation · 4.49% rent growth · sell at horizon
- IRR
- —
- Equity multiple
- 8.18×
- Total profit
- $51,214
- Equity at exit
- $3,796
- IRR
- —
- Equity multiple
- 18.10×
- Total profit
- $121,937
- Equity at exit
- $2,201
Cash invested: $7,129 (down + closing). Projections, not guarantees.
Landlord ↔ Tenant lean methodology
- Overall (STATE)
- 81 Strongly Landlord-Friendly
- State Missouri
- 81 Strongly Landlord-Friendly · R+10
- County
- — inherits STATE
- City
- — inherits STATE
ZIP-level market 63755
- Rents YoY
- 4.5%
- Active inventory
- 176
- Price-to-rent
- 1.6×
Monthly cashflow live
- Estimated rent
- $1,331 medium interval (Pro) →
- Mortgage (P&I)
- −$134
- Tax from tax record
- −$71 /mo · $855/yr
- Insurance
- −$11
- HOA
- −$0
- Vacancy / Maint / Mgmt
- −$280
- Net cashflow
- $836
Break-even live
UW: 25.0% down · 7.5% · 30yr · 1.5% tax · 5.0% vac · 8.0% maint · 8.0% mgmt
Financing live
Cash to close
- Down payment
- $6,365
- Closing costs
- $764
- Reserves months
- —
- Total cash needed
- —
Loan-product check · same deal, 3 products live
Conventional
25% down · 7.5% · 30yr
- Down + closing
- —
- Monthly P&I
- —
- Monthly cashflow
- —
- DSCR
- —
- Eligible?
- —
Personal DTI + credit; lowest rate.
DSCR
20% down · 8.5% · 30yr
- Down + closing
- —
- Monthly P&I
- —
- Monthly cashflow
- —
- DSCR
- —
- Eligible?
- —
No personal income docs; deal must DSCR.
Hard money
10% down · 12.0% · 12mo
- Down + closing
- —
- Monthly P&I
- —
- Monthly cashflow
- —
- DSCR
- —
- Eligible?
- —
Short-term bridge; refi at stabilization.
Rent comps 1 comps
| Address | Beds | Baths | Sqft | Rent | $/sqft | DOM | Units | Dist |
|---|---|---|---|---|---|---|---|---|
| 122 S Bellevue St Unit 4 Jackson, MO | 2.0 | 1.5 | 1000 | $1,150 | $1.15 | 43d | 1 | 0.49mi |
Listing history 12 events
-
2026-06-19days on market $25,460 Active 15 DOM
-
2026-06-18days on market $25,460 Active 14 DOM
-
2026-06-17days on market $25,460 Active 13 DOM
-
2026-06-16days on market $25,460 Active 12 DOM
-
2026-06-15days on market $25,460 Active 11 DOM
-
2026-06-14days on market $25,460 Active 9 DOM
-
2026-06-13days on market $25,460 Active 8 DOM
-
2026-06-10days on market $25,460 Active 6 DOM
-
2026-06-09days on market $25,460 Active 5 DOM
-
2026-06-08days on market $25,460 Active 4 DOM
-
2026-06-07remarks 689-char remark
-
2026-06-07$25,460 Active 3 DOM
ⓘ Source: listings_history table (triggers on properties + properties_extension) + one-shot
backfill from property_details.listing_events for pre-trigger history.
Tax reassessment forecast MO · Resets to sale price
- Current annual tax
- $855 · $71/mo
- Projected year-2 tax
- $855 · $71/mo
- Expected delta
- $0/yr ($0/mo · -0.0%)
ⓘ Screening estimate from a state-policy table — verify with the county assessor before closing.
Climate risk First Street
- Flood 1/10 Low FEMA zone X (unshaded) · 0% chance over 30 yrs
- Wildfire 3/10 Moderate
- Heat 5/10 Major 7 d/yr ≥109°F today · 22 d/yr by 30 yrs out
- Wind 2/10 Low 3% chance of damaging wind over 30 yrs
- Air quality 2/10 Low 0 unhealthy d/yr today · 1 by 30 yrs out
Nearby sold comps map
Loading sold comps map…
Walkable amenities ~0.75 mi
Loading nearby amenities…
Taxation est. · year 1
- Rental income
- $15,976
- − Mortgage interest
- −$1,426
- − Property taxes
- −$855
- − Insurance
- −$127
- − Repairs & maintenance
- −$1,278
- − Management
- −$1,278
- − Depreciation
- −$741
- Taxable income
- $10,271
- Est. tax owed @ 24.0%
- −$2,465
- After-tax cash flow
- $7,572/yr
For passive investors: Depreciation is non-cash, so a rental often shows a tax loss while cash-flowing — sheltering income. Rental losses are passive: they offset passive income freely, and up to $25,000/yr can offset ordinary (W-2) income if you actively participate and your MAGI is under $100k (phasing out to $0 by $150k); unused losses carry forward. On sale, claimed depreciation is recaptured at up to 25%, and gains may owe capital-gains tax (a 1031 exchange can defer both). Figures are a year-1 estimate at your 24.0% rate — not tax advice; consult a CPA.
Schools (NCES district)
- District
- Jackson R-II
- NCES district ID
- 2915600
- Math proficiency
- 41% ▼ -6.00%
- Reading proficiency
- 51% ▬ 0.00%
- Median HH income
- $52,935
- Composite
- 39.72/100
- National rank
- #3898
- State rank
- #73 of 324 in MO
Livability — Jackson
- Score
- 69/100
- State rank
- #160
- US rank
- #8843
Category grades
Schools grade is shown separately in the Schools card above.
Census & demographics
- Census place
- Jackson, MO
- County
- Cape Girardeau County · 75,175 people
- City population
- 27,629
- Metro
- Cape Girardeau, MO-IL
- Population (ZIP)
- 27,629
- Household income
- $78,750
- Rent vs Own
- Severe rent burden
- 354.0
Population outlook (Cape Girardeau County) Hauer SSP2
- Today (2025)
- 84,807 people
- By 2030
- 88,016 · +3.8%
- By 2040
- 93,914 · +10.7%
- By 2050
- 99,541 · +17.4%
- By 2075
- 114,527 · +35.0%
- By 2100
- 121,718 · +43.5%
Race, ethnicity, and origin ACS 2023
- Neighborhood character
- Predominantly White (92%)
- Race & ethnicity
- White 92% Two or more races 4% Hispanic / Latino 3% Black 2%
- Common ancestry
- Slovak 2% Italian 2% Lithuanian 1%
- Foreign-born
- 1% · Canada
- Languages at home
- 98% English-only · Spanish 1%
Political lean MEDSL · Cape Girardeau
- 2024 margin
- Solid R (+46.5) · D 26.2% · R 72.7% · Other 1.1%
- 2008→2024 swing
- -12.9pp toward R · 2008: -33.6pp · 2024: -46.5pp
- All cycles
- 2024: R+46.5 2020: R+45.0 2016: R+50.1 2012: R+43.8 2008: R+33.6
Not yet ingested
- Civics
- —
Market trends
- HPI YoY
- ▼ -120.83%
- Current HPI
- 179.1136
- Rent YoY
- ▲ 4.49%
- Metro
- Cape Girardeau, MO-IL
- State GDP YoY
- ▲ 1.84%
- F500 in state
- 20
Industry mix (Fortune 500 HQ in MO)
| Industry | F500 HQs | Revenue |
|---|---|---|
| Healthcare | 1 | $163B |
|
||
| Insurance | 1 | $21B |
|
||
| Industrial Technology | 1 | $17B |
|
||
| Retail | 1 | $16B |
|
||
| Industrial Distribution | 1 | $10B |
|
||
| Utilities | 1 | $9B |
|
||
Price history
1 event — show timeline
- 2026-06-04 Listed $25,460 MARIS as Distributed by MLS Grid
Property tax history
+1.2%/yrLatest (2025): $855 · +5.1% YoY. Source: county tax records.
Cash-flow waterfall
monthlySold comps — $/sqft
last 12 mo · ≤1 miLoading sold comps…