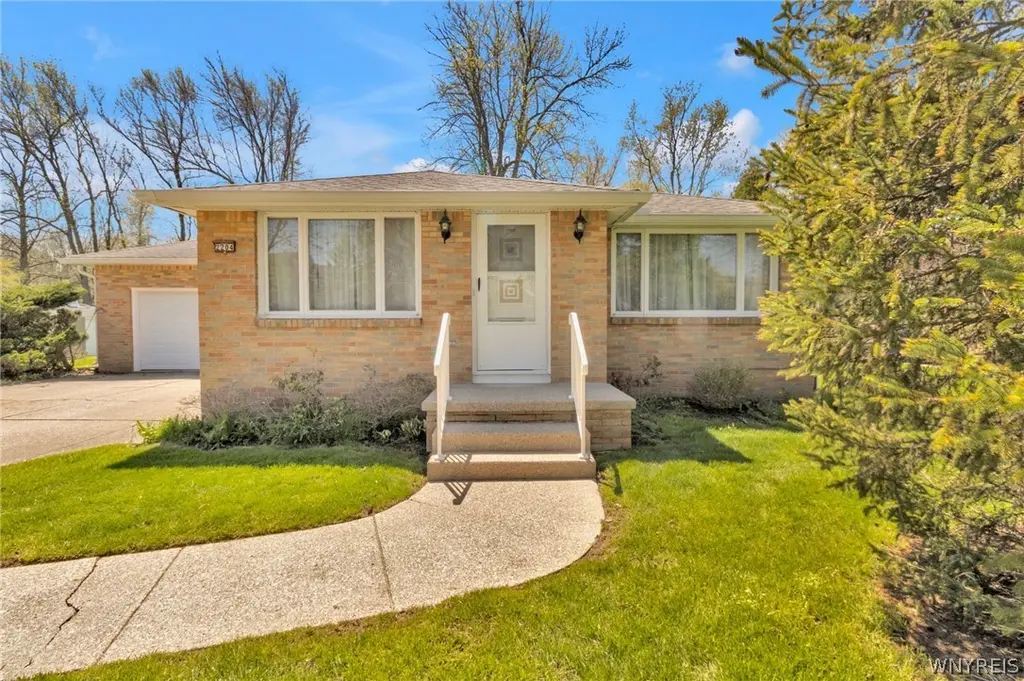
2204 N Forest Rd · University at Buffalo, NY
Flood risk 4/10 · Minor
- FEMA flood zone
- AE
- Chance of flooding over 30 yrs
- 0.22%
- Est. flood insurance / yr
- $2,026 – $9,024
Fire risk 2/10 · Minimal
- Est. fire insurance / yr
- $691 – $1,283
Heat risk 2/10 · Minimal
- Hot days now (above 94°F)
- 7 days/yr
- Hot days in 30 yrs
- 15 days/yr
Wind risk 1/10 · Minimal
- Chance of severe wind over 30 yrs
- —
Air-quality risk 3/10 · Minor
- Unhealthy air days now
- 2 days/yr
- Unhealthy air days in 30 yrs
- 3 days/yr
Risk factors via First Street. Map © Google.
Why this score? — see what drove the C- grade
The composite is a weighted blend of 9 inputs, each scored 0–100. Each bar is that input's sub-score; the figure is the points it added to the 100-point composite (weight × sub-score).
- ARV discount +15.0/15.0
- Cash flow +12.0/30.0
- Schools +6.3/10.0
- Livability +4.4/5.0
- Rent growth +3.8/5.0
- DSCR +3.5/10.0
- 1% rule +3.3/10.0
- Condition / age +2.5/5.0
- Appreciation +0.0/10.0
$267,900
🖨 Deal sheet 📄 Offer letter ✓ Due diligence
Listing remarks
Set on just over an acre backing to Ellicott Creek, this 3-bedroom Ranch offers easy, single-level living w/ a serene backyard setting surrounded by lush green space and mature trees. The main living space is inviting and open, featuring a living room/dining combination that flows into the eat-in kitchen w/ granite countertops, tile backsplash and a full suite of appliances included. A small front foyer and closet create a defined entry before stepping into the main living area. Hardwood flooring extends through all three bedrooms. The smallest bedroom is currently being used as first-floor laundry and could easily be converted back, if desired. Additional features include a full basement w
Key facts
- Granite countertops
- Tile backsplash
- Mature trees
Tags
Property features AI
Exterior
- Parking: Attached garage with 2 spaces; Garage door opener; Garage storage
- Utilities: Electricity available and connected (circuit breakers); Public water connected; Sewer connected
- Home design: Single-story home; Existing construction
- Construction: Brick and composite siding; Copper plumbing; Architectural shingle roof; Poured foundation
- Exterior features: Concrete driveway; Patio; River access to Ellicott Creek; Stream on property; Rectangular lot
Interior
- Kitchen: Electric oven; Electric range; Dishwasher; Refrigerator; Granite counters; Eat-in kitchen
- Bedrooms: Three main-level bedrooms
- Flooring: Carpet; Ceramic tile; Hardwood; Laminate; Varies
- Bathrooms: One full bathroom on the main level
- Heating & cooling: Ductless cooling; Ductless heating; Gas heating; Baseboard heating; Programmable thermostat
- Interior features: Ceiling fan(s); Entrance foyer; Eat-in kitchen; Granite counters; Living/dining room; Storage; Natural woodwork; Bedroom on main level; Programmable thermostat
- Laundry & utility: Main-level laundry; Washer; Dryer; Gas water heater
Neighborhood map
What this means for you Summary
Snapshot
- This is a 3-bed/1.0-bath single-family listed at $268k.
Deal economics
- At list price, monthly cash flow is $-526 ($-6k/yr) — negative.
- To cash-flow at today's rent, offer at most $175k (34.7% below list).
- To meet the 1% rule (rent ≥ 1% of price), the offer needs to be $224k (16.5% below list).
- Recommended offer: $175k (34.7% below list) — sets the bar for cash-flow.
- Cap rate 6.0% vs local median 2.8% in University at Buffalo — top-decile yield for the area; either an underpriced asset or a hidden risk that comps aren't pricing in. Stress-test before assuming the spread holds.
Location & tenants
- Location reads 88/100 on livability (#9 in NY, #176 nationally) — a professional / high-income tenant draw. Strengths: schools A+, amenities A+, commute A+; Watch: cost of living D+, employment F.
- Williamsville Central School District (suburban): math 64% / reading 77% proficiency, ranked #114 of 590 in NY (top 19%) — strong family-tenant draw, lease renewals of 3-5y typical; only 10% free/reduced lunch — higher-income household profile.
- Market conditions: Rents rising fast (+5.0%/yr); 329 active listings in the ZIP; 8 comparable units currently listed for rent nearby; rentals leasing fast (median 3d on market — plan ~1-2 weeks tenant-placement turnaround); solid renter incomes; 1,244 units permitted in Erie County in 2024 (563 in 5+ unit buildings).
Forward outlook
- Local home prices are declining (-3.0%/yr); year-one equity from $2k of loan paydown is wiped out by about $8k of value loss. Plan a longer hold.
Negotiation context
- Only 9 days on market — expect competitive offers; lowballing is unlikely to land.
Risks & watch-outs
- Watch-outs: flood insurance adds $460/mo.
- Climate carrying-cost: in FEMA flood zone AE (mandatory federal flood insurance) — expect insurance premiums to compound above CPI over the hold.
Questions for the listing agent
- What do current leases actually rent for vs. the listed asking? Can we see a recent rent roll and the last 12 months of T-12 income?
- Built in 1964 — when were the roof, HVAC, electrical panel, plumbing, and water heater last replaced?
- What's the actual annual flood-insurance premium (NFIP or private), and is the property in a SFHA with mandatory coverage?
- Is there a deadline driving the sale (1031 exchange, divorce, estate, relocation)? That informs how much negotiation room exists.
- Schools are A-rated — typically a magnet for longer-tenancy family renters. What's the average tenant stay here, and is there a school-zone premium baked into asking?
- What's the average days-on-market for RENTAL listings here right now (not sales)? A rising rental-DOM trend means longer vacancies and softer asking-rent achievability than the comps imply.
- What's the recent tenant-quality profile in this submarket — average credit score on applications, eviction rate, late-payment / NSF rate, and stable-employment percentage? A property-management company in the area should have these aggregated.
- How much new for-sale + rental construction is in the pipeline within 1–3 miles? Heavy new supply typically softens prices + rents 12–24 months out; constrained supply supports both.
Investment metrics
- 1% rule
- 0.83% ✗
- Cap rate
- 6.00%
- Cash-on-cash
- -1.05%
- DSCR
- 0.95
- GRM
- 10.0
CMA / ARV
- ARV (median comp)
- $322,843
- List price
- $267,900
- Delta
- -17.02%
- Verdict
- UNDERPRICED
- Comps
- 20 within 1.0 mi
Show comp detail 2 sales within ~0.75 mi
| Address | Dist | Beds/Ba | Sqft | Sold | Price | $/sf | Match |
|---|---|---|---|---|---|---|---|
| 21 Stahl Rd | 0.16mi | 3/1.0 | 1,267 (+7%) | 15mo | $170,000 | $134 | 69 |
| 425 Robin Rd | 0.62mi | 3/1.5 | 1,270 (+7%) | 21mo | $265,000 | $209 | 40 |
Match score weights: distance 35% · size 25% · config 20% · recency 20%. Top-matched comps best support the ARV.
Projected returns pro-forma
-3.0% appreciation · 5.01% rent growth · sell at horizon
- IRR
- -28.1%
- Equity multiple
- 0.04×
- Total profit
- $-72,006
- Equity at exit
- $39,945
- IRR
- -19.0%
- Equity multiple
- -0.13×
- Total profit
- $-84,896
- Equity at exit
- $23,163
Cash invested: $75,012 (down + closing). Projections, not guarantees.
Landlord ↔ Tenant lean methodology
- Overall (STATE)
- 15 Strongly Tenant-Friendly
- State New York
- 15 Strongly Tenant-Friendly · D+10
- County
- — inherits STATE
- City
- — inherits STATE
ZIP-level market 14221
- Rents YoY
- 5.0%
- Active inventory
- 329
- Price-to-rent
- 10.0×
Monthly cashflow live
- Estimated rent
- $2,236 high interval (Pro) →
- Mortgage (P&I)
- −$1,405
- Tax from tax record
- −$315 /mo · $3,784/yr
- Insurance
- −$112
- Flood insurance flood zone
- −$460 /mo · $5,525/yr
- HOA
- −$0
- Vacancy / Maint / Mgmt
- −$469
- Net cashflow
- $-526
Break-even live
UW: 25.0% down · 7.5% · 30yr · 1.5% tax · 5.0% vac · 8.0% maint · 8.0% mgmt
Financing live
Cash to close
- Down payment
- $66,975
- Closing costs
- $8,037
- Reserves months
- —
- Total cash needed
- —
Loan-product check · same deal, 3 products live
Conventional
25% down · 7.5% · 30yr
- Down + closing
- —
- Monthly P&I
- —
- Monthly cashflow
- —
- DSCR
- —
- Eligible?
- —
Personal DTI + credit; lowest rate.
DSCR
20% down · 8.5% · 30yr
- Down + closing
- —
- Monthly P&I
- —
- Monthly cashflow
- —
- DSCR
- —
- Eligible?
- —
No personal income docs; deal must DSCR.
Hard money
10% down · 12.0% · 12mo
- Down + closing
- —
- Monthly P&I
- —
- Monthly cashflow
- —
- DSCR
- —
- Eligible?
- —
Short-term bridge; refi at stabilization.
Rent comps 8 comps
| Address | Beds | Baths | Sqft | Rent | $/sqft | DOM | Units | Dist |
|---|---|---|---|---|---|---|---|---|
| 2635 N Forest Rd Unit Type A Getzville, NY | 2.0 | 2.0 | 1140 | $2,199 | $1.93 | 1d | 1 | 0.79mi |
| 2635 N Forest Rd Getzville, NY | 3.0 | 2.0 | 1340 | $2,395 | $1.79 | 10d | 1 | 0.79mi |
| 2675 Millersport Hwy Getzville, NY | 2.0–3.0 | 2.0 | 1210 | $2,130 | $1.76 | 3d | 9 | 0.95mi |
| 2791 N Forest Rd Getzville, NY | 3.0 | 1.0 | 1160 | $2,400 | $2.07 | 3d | 1 | 1.08mi |
| 1325 N Forest Rd Buffalo, NY | 1.0–3.0 | 1.0 | 870 | $2,095 | $2.41 | 1d | 9 | 1.22mi |
| 1525 Amherst Manor Dr Buffalo, NY | 2.0 | 2.0 | 1080 | $1,495 | $1.38 | 1d | 5 | 1.26mi |
| 695 Skinnersville Rd Buffalo, NY | 2.0 | 1.5 | 1328 | $1,990 | $1.50 | 1d | 1 | 1.46mi |
| 1880 Sweet Home Rd Buffalo, NY | 1.0–2.0 | 1.0 | 745 | $2,030 | $2.72 | 2d | 6 | 1.49mi |
Listing history 1 events
-
2026-05-12$267,900 Active 1458-char remark
ⓘ Source: listings_history table (triggers on properties + properties_extension) + one-shot
backfill from property_details.listing_events for pre-trigger history.
Tax reassessment forecast NY · Partial reset (capped growth)
- Current annual tax
- $3,784 · $315/mo
- Projected year-2 tax
- $4,156 · $346/mo
- Expected delta
- +$372/yr (+$31/mo · 9.8%)
ⓘ Screening estimate from a state-policy table — verify with the county assessor before closing.
Climate risk First Street
- Flood 4/10 Moderate FEMA zone AE · 22% chance over 30 yrs
- Wildfire 2/10 Low
- Heat 2/10 Low 7 d/yr ≥94°F today · 15 d/yr by 30 yrs out
- Wind 1/10 Low
- Air quality 3/10 Moderate 2 unhealthy d/yr today · 3 by 30 yrs out
Nearby sold comps map
Loading sold comps map…
Walkable amenities ~0.75 mi
Loading nearby amenities…
Taxation est. · year 1
- Rental income
- $26,828
- − Mortgage interest
- −$15,007
- − Property taxes
- −$3,784
- − Insurance
- −$6,865
- − Repairs & maintenance
- −$2,146
- − Management
- −$2,146
- − Depreciation
- −$7,793
- Taxable loss
- −$10,914
- Est. tax savings @ 24.0%
- +$2,619
- After-tax cash flow
- $-3,695/yr
For passive investors: Depreciation is non-cash, so a rental often shows a tax loss while cash-flowing — sheltering income. Rental losses are passive: they offset passive income freely, and up to $25,000/yr can offset ordinary (W-2) income if you actively participate and your MAGI is under $100k (phasing out to $0 by $150k); unused losses carry forward. On sale, claimed depreciation is recaptured at up to 25%, and gains may owe capital-gains tax (a 1031 exchange can defer both). Figures are a year-1 estimate at your 24.0% rate — not tax advice; consult a CPA.
Schools (NCES district)
- District
- Williamsville Central School District
- NCES district ID
- 3631470
- Math proficiency
- 64% ▼ -14.00%
- Reading proficiency
- 77% ▲ 6.00%
- Median HH income
- $79,907
- Composite
- 62.59/100
- National rank
- #678
- State rank
- #114 of 590 in NY
Livability — University at Buffalo
- Score
- 88/100
- State rank
- #9
- US rank
- #176
Category grades
Schools grade is shown separately in the Schools card above.
Census & demographics
- County
- Erie County · 714,559 people
- City population
- 5,827
- Metro
- Buffalo-Cheektowaga, NY
- Population (ZIP)
- 55,255
- Household income
- $101,615
- Rent vs Own
- Severe rent burden
- 1956.0
Population outlook (Erie County) Hauer SSP2
- Today (2025)
- 933,037 people
- By 2030
- 935,181 · +0.2%
- By 2040
- 928,531 · -0.5%
- By 2050
- 905,725 · -2.9%
- By 2075
- 834,037 · -10.6%
- By 2100
- 708,033 · -24.1%
Race, ethnicity, and origin ACS 2023
- Neighborhood character
- Predominantly White (84%)
- Race & ethnicity
- White 84% Asian 8% Two or more races 4% Hispanic / Latino 3% Black 2%
- Common ancestry
- Romanian 15% Lithuanian 2% Slovak 2%
- Foreign-born
- 10% · Canada, China, South Korea
- Languages at home
- 88% English-only · Other Indo-European 3% Other Asian/Pacific 2% Spanish 2%
Political lean MEDSL · Erie
- 2024 margin
- Lean D (+9.7) · D 54.8% · R 45.2%
- 2008→2024 swing
- -7.9pp toward R · 2008: 17.5pp · 2024: 9.7pp
- All cycles
- 2024: D+9.7 2020: D+14.7 2016: D+4.8 2012: D+15.6 2008: D+17.5
Not yet ingested
- Civics
- —
Market trends
- HPI YoY
- ▼ -301.37%
- Current HPI
- 322.6947
- Rent YoY
- ▲ 5.01%
- Metro
- Buffalo-Cheektowaga, NY
- State GDP YoY
- ▲ 2.60%
- F500 in state
- 92
Industry mix (Fortune 500 HQ in NY)
| Industry | F500 HQs | Revenue |
|---|---|---|
| Financial Services | 10 | $950B |
|
||
| Consumer Goods | 9 | $162B |
|
||
| Insurance | 4 | $225B |
|
||
| Telecommunications | 2 | $144B |
|
||
| Pharmaceuticals | 2 | $112B |
|
||
| Media / Entertainment | 2 | $69B |
|
||
Price history
2 events — show timeline
- 2026-05-21 Pending — WNYREIS
- 2026-05-12 Listed $267,900 WNYREIS
Property tax history
+8.7%/yrLatest (2025): $3,784 · -8.0% YoY. Source: county tax records.
Cash-flow waterfall
monthlySold comps — $/sqft
last 12 mo · ≤1 miLoading sold comps…