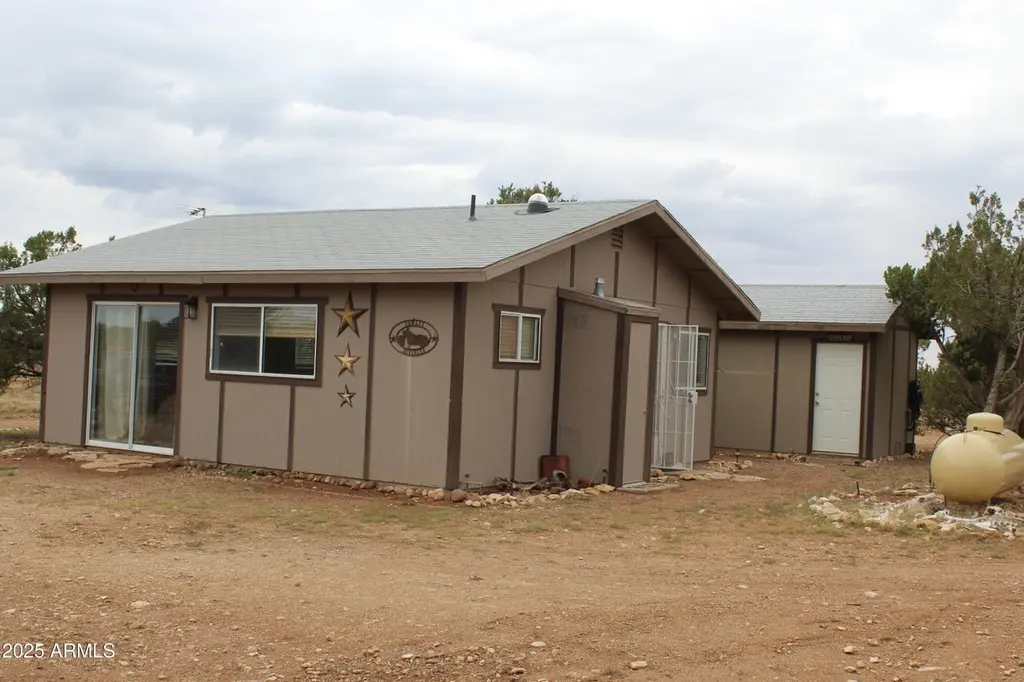
979 Elk Run Rd · Heber-Overgaard, AZ
Flood risk 1/10 · Minimal
- FEMA flood zone
- X (unshaded)
- Chance of flooding over 30 yrs
- 0.0%
- Est. flood insurance / yr
- $507 – $1,088
Fire risk 9/10 · Severe
- Est. fire insurance / yr
- $610 – $1,132
Heat risk 2/10 · Minimal
- Hot days now (above 87°F)
- 7 days/yr
- Hot days in 30 yrs
- 18 days/yr
Wind risk 1/10 · Minimal
- Chance of severe wind over 30 yrs
- —
Air-quality risk 1/10 · Minimal
- Unhealthy air days now
- 0 days/yr
- Unhealthy air days in 30 yrs
- 0 days/yr
Risk factors via First Street. Map © Google.
Why this score? — see what drove the C- grade
The composite is a weighted blend of 9 inputs, each scored 0–100. Each bar is that input's sub-score; the figure is the points it added to the 100-point composite (weight × sub-score).
- Cash flow +15.7/30.0
- ARV discount +9.7/15.0
- Appreciation +5.4/10.0
- DSCR +4.8/10.0
- 1% rule +4.3/10.0
- Schools +4.0/10.0
- Rent growth +2.5/5.0
- Livability +2.5/5.0
- Condition / age +2.2/5.0
$185,000
🖨 Deal sheet (PDF) 📄 Offer letter ✓ Due diligence
Listing remarks MLS
Looking for that summer retreat or getaway cabin, well here is an ideal home for that. A 1 bedroom 1 bath site-built home with concrete slab foundation on 9.35 acres with new blinds, tile floor, a gas range, solar refrigerator and a washer, dryer. The solar system has (2) $1,500 lithium batteries, with solar panels. There is a separate 625 sq ft bunkhouse with a covered deck and it comes partially furnished along with a storage shed and (2) 1000 gallon water storage tanks. One water storage tank is used for (2) fenced 10x20 raised garden beds. Come take a Look before it is gone.
Key facts
- Lithium batteries
- Solar system
- Solar panels
Tags
Neighborhood map
What this means for you Summary
Snapshot
- This is a 1-bed/1.0-bath single-family listed at $185k. Condition is rated fair.
Deal economics
- At list price, monthly cash flow is $81 ($968/yr) — positive.
- The deal already cash-flows at list — no discount required.
- To meet the 1% rule (rent ≥ 1% of price), the offer needs to be $172k (7.0% below list).
- Recommended offer: $163k (12.0% below list) — sets the bar for market timing.
- Cap rate 6.8% vs local median 3.2% in Heber-Overgaard — top-decile yield for the area; either an underpriced asset or a hidden risk that comps aren't pricing in. Stress-test before assuming the spread holds.
Location & tenants
- Location reads: area grade C — affects rentability + tenant quality, not the cash-flow math above.
- Heber-Overgaard Unified District (4392) (rural): math 52% / reading 45% proficiency, ranked #51 of 249 in AZ (top 20%) — families likely to look elsewhere, expect single-tenant / working-renter base with shorter leases.
- Market conditions: 157 active listings in the ZIP; 485 units permitted in Navajo County in 2024 (11 in 5+ unit buildings).
Forward outlook
- In year one you build about $3k of equity ($1k loan paydown + $2k appreciation (0.9% local appreciation)).
- Navajo County population projected at -16% by 2050 — secular population decline; favor cash flow + early exit over multi-decade hold.
- At projected returns (0.9% appreciation + 3.0% rent growth), your $52k cash investment doubles in ~9 years — after that, you're playing with house money.
- By year 10, paydown + projected appreciation supports a ~$31k cash-out refi (75% LTV) — recoverable capital for the next deal without selling this one.
Negotiation context
- It's been on market 328 days — a 12% lower offer ($163k) is reasonable based on typical stale-listing flexibility.
- 3 sale attempts since 4y ago with the ask held roughly flat each time — persistent listings suggest the price (not the market) is what's stuck; bring a comps-based counter.
- Current owner paid $110k; list at $185k implies a 68% gain — meaningful room to come down on a strong offer.
Risks & watch-outs
- Climate carrying-cost: severe wildfire risk — expect insurance premiums to compound above CPI over the hold.
Questions for the listing agent
- It's been on market 328 days. Have you received any prior offers? Is the seller open to a 12% concession, seller financing, or rate buy-down credit?
- Have any recent inspections been done? Can we get a copy of the seller's disclosures and any deferred-maintenance estimates?
- Why hasn't it sold? Are there any deal-killer items the seller is aware of (foundation, flood, title, zoning, code violations)?
- Is there a deadline driving the sale (1031 exchange, divorce, estate, relocation)? That informs how much negotiation room exists.
- What's the average days-on-market for RENTAL listings here right now (not sales)? A rising rental-DOM trend means longer vacancies and softer asking-rent achievability than the comps imply.
- What's the recent tenant-quality profile in this submarket — average credit score on applications, eviction rate, late-payment / NSF rate, and stable-employment percentage? A property-management company in the area should have these aggregated.
- How much new for-sale + rental construction is in the pipeline within 1–3 miles? Heavy new supply typically softens prices + rents 12–24 months out; constrained supply supports both.
Investment metrics
- 1% rule
- 0.93% ✗
- Cap rate
- 6.82%
- Cash-on-cash
- 1.87%
- DSCR
- 1.08
- GRM
- 9.0
CMA / ARV
- ARV (median comp)
- $194,332
- List price
- $185,000
- Delta
- -4.80%
- Verdict
- FAIR
- Comps
- 18 within 2.0 mi
Projected returns pro-forma
0.86% appreciation · 3.0% rent growth · sell at horizon
- IRR
- 2.8%
- Equity multiple
- 1.14×
- Total profit
- $7,332
- Equity at exit
- $61,785
- IRR
- 7.5%
- Equity multiple
- 1.89×
- Total profit
- $46,266
- Equity at exit
- $81,056
Cash invested: $51,800 (down + closing). Projections, not guarantees.
Landlord ↔ Tenant lean methodology
- Overall (STATE)
- 87 Strongly Landlord-Friendly
- State Arizona
- 87 Strongly Landlord-Friendly · R+3
- County
- — inherits STATE
- City
- — inherits STATE
ZIP-level market 85928
- Home prices YoY
- 0.2%
- Active inventory
- 157
- Price-to-rent
- 9.0×
Monthly cashflow live
- Estimated rent
- $1,720 medium interval (Pro) →
- Mortgage (P&I)
- −$970
- Tax est. 1.5%
- −$231 /mo · $2,775/yr
- Insurance
- −$77
- HOA
- −$0
- Vacancy / Maint / Mgmt
- −$361
- Net cashflow
- $81
Break-even live
Sensitivity live
| Price | -10% $208 | -5% $145 | +0% $81 | +5% $17 | +10% $-47 |
|---|---|---|---|---|---|
| Rent | -10% $-55 | -5% $13 | +0% $81 | +5% $149 | +10% $217 |
| Rate | -1.0pp $174 | -0.5pp $128 | base $81 | +0.5pp $33 | +1.0pp $-16 |
UW: 25.0% down · 7.5% · 30yr · 1.5% tax · 5.0% vac · 8.0% maint · 8.0% mgmt
Financing live
Cash to close
- Down payment
- $46,250
- Closing costs
- $5,550
- Reserves months
- —
- Total cash needed
- —
Loan-product check · same deal, 3 products live
Conventional
25% down · 7.5% · 30yr
- Down + closing
- —
- Monthly P&I
- —
- Monthly cashflow
- —
- DSCR
- —
- Eligible?
- —
Personal DTI + credit; lowest rate.
DSCR
20% down · 8.5% · 30yr
- Down + closing
- —
- Monthly P&I
- —
- Monthly cashflow
- —
- DSCR
- —
- Eligible?
- —
No personal income docs; deal must DSCR.
Hard money
10% down · 12.0% · 12mo
- Down + closing
- —
- Monthly P&I
- —
- Monthly cashflow
- —
- DSCR
- —
- Eligible?
- —
Short-term bridge; refi at stabilization.
Listing history 23 events
-
2026-06-21days on market $185,000 Active 328 DOM
-
2026-06-19days on market $185,000 Active 326 DOM
-
2026-06-18days on market $185,000 Active 325 DOM
-
2026-06-17days on market $185,000 Active 324 DOM
-
2026-06-16days on market $185,000 Active 323 DOM
-
2026-06-15days on market $185,000 Active 322 DOM
-
2026-06-14days on market $185,000 Active 320 DOM
-
2026-06-12days on market $185,000 Active 319 DOM
-
2026-06-09days on market $185,000 Active 316 DOM
-
2026-06-08days on market $185,000 Active 315 DOM
-
2026-06-07days on market $185,000 Active 314 DOM
-
2026-06-07days on market $185,000 Active 313 DOM
-
2026-06-04days on market $185,000 Active 310 DOM
-
2026-06-02days on market $185,000 Active 309 DOM
-
2026-06-01days on market $185,000 Active 308 DOM
-
2026-05-31days on market $185,000 Active 307 DOM
-
2026-05-31days on market $185,000 Active 306 DOM
-
2025-07-27$185,000 Active 585-char remark
Show marketing remark (585 chars)
Looking for that summer retreat or getaway cabin, well here is an ideal home for that. A 1 bedroom 1 bath site-built home with concrete slab foundation on 9.35 acres with new blinds, tile floor, a gas range, solar refrigerator and a washer, dryer. The solar system has (2) $1,500 lithium batteries, with solar panels. There is a separate 625 sq ft bunkhouse with a covered deck and it comes partially furnished along with a storage shed and (2) 1000 gallon water storage tanks. One water storage tank is used for (2) fenced 10x20 raised garden beds. Come take a Look before it is gone.
-
2025-07-26$185,000 Active 585-char remark
Show marketing remark (585 chars)
Looking for that summer retreat or getaway cabin, well here is an ideal home for that. A 1 bedroom 1 bath site-built home with concrete slab foundation on 9.35 acres with new blinds, tile floor, a gas range, solar refrigerator and a washer, dryer. The solar system has (2) $1,500 lithium batteries, with solar panels. There is a separate 625 sq ft bunkhouse with a covered deck and it comes partially furnished along with a storage shed and (2) 1000 gallon water storage tanks. One water storage tank is used for (2) fenced 10x20 raised garden beds. Come take a Look before it is gone.
-
2022-11-14soldstatus $110,000 Closed
-
2022-10-17historical
-
2022-08-11price $119,000
-
2022-01-10$150,000 Active
ⓘ Source: listings_history table (triggers on properties + properties_extension) + one-shot
backfill from property_details.listing_events for pre-trigger history.
Climate risk First Street
- Flood 1/10 Low FEMA zone X (unshaded) · 0% chance over 30 yrs
- Wildfire 9/10 Extreme
- Heat 2/10 Low 7 d/yr ≥87°F today · 18 d/yr by 30 yrs out
- Wind 1/10 Low
- Air quality 1/10 Low 0 unhealthy d/yr today · 0 by 30 yrs out
Nearby sold comps map
Loading sold comps map…
Walkable amenities ~0.75 mi
Loading nearby amenities…
Taxation est. · year 1
- Rental income
- $20,645
- − Mortgage interest
- −$10,363
- − Property taxes
- −$2,775
- − Insurance
- −$925
- − Repairs & maintenance
- −$1,652
- − Management
- −$1,652
- − Depreciation
- −$5,382
- Taxable loss
- −$2,103
- Est. tax savings @ 24.0%
- +$505
- After-tax cash flow
- $1,472/yr
For passive investors: Depreciation is non-cash, so a rental often shows a tax loss while cash-flowing — sheltering income. Rental losses are passive: they offset passive income freely, and up to $25,000/yr can offset ordinary (W-2) income if you actively participate and your MAGI is under $100k (phasing out to $0 by $150k); unused losses carry forward. On sale, claimed depreciation is recaptured at up to 25%, and gains may owe capital-gains tax (a 1031 exchange can defer both). Figures are a year-1 estimate at your 24.0% rate — not tax advice; consult a CPA.
Condition & rehab AI · 13 photos
This property requires moderate repairs and maintenance to improve its condition and value. Painting, flooring replacement, and appliance updates would significantly enhance its appeal.
Repairs flagged
- Major Kitchen appliances — Old and worn
- Major Bathroom cleaning — Cluttered and in need of cleaning
- Major Exterior siding — Signs of wear
Value-add opportunities
- Both Painting interior walls — Enhances curb appeal and interior aesthetics
- Both Flooring replacement in kitchen and bathrooms — Improves functionality and aesthetics
- Both Kitchen appliance replacement — Enhances functionality and aesthetics
- Both Bathroom cleaning and organization — Enhances functionality and aesthetics
Renovation cost estimate screening
| Repair item | Severity | Est. cost |
|---|---|---|
| Kitchen appliances · Old and worn | Major | $15,000–50,000 |
| Bathroom cleaning · Cluttered and in need of cleaning | Major | $15,000–50,000 |
| Exterior siding · Signs of wear | Major | $15,000–50,000 |
| Total estimated repair cost · 3 items | $45,000–150,000 |
Value-add ROI direction
- Both Painting interior walls — Enhances curb appeal and interior aesthetics ↑
- Both Flooring replacement in kitchen and bathrooms — Improves functionality and aesthetics ↑
- Both Kitchen appliance replacement — Enhances functionality and aesthetics ↑
- Both Bathroom cleaning and organization — Enhances functionality and aesthetics ↑
ⓘ Cost ranges are severity-bucket heuristics (US national rule-of-thumb). Get contractor quotes + a written scope before underwriting a rehab budget.
Schools (NCES district)
- District
- Heber-Overgaard Unified District (4392)
- NCES district ID
- 0400026
- Math proficiency
- 52% ▼ -5.00%
- Reading proficiency
- 45% ▼ -1.00%
- Median HH income
- $37,916
- Composite
- 40.42/100
- National rank
- #3727
- State rank
- #51 of 249 in AZ
Livability — Heber-Overgaard
No livability data for this city. (Only ~50 U.S. cities are tracked.)
Census & demographics
- Census place
- Heber-Overgaard, AZ
- Population (ZIP)
- 376
Population outlook (Navajo County) Hauer SSP2
- Today (2025)
- 105,760 people
- By 2030
- 103,301 · -2.3%
- By 2040
- 97,070 · -8.2%
- By 2050
- 88,850 · -16.0%
- By 2075
- 65,180 · -38.4%
- By 2100
- 37,281 · -64.7%
Race, ethnicity, and origin ACS 2023
- Neighborhood character
- Predominantly White (100%)
- Race & ethnicity
- White 100%
- Common ancestry
- Iranian 6% Slovak 6% Lithuanian 5%
Political lean MEDSL · Navajo
- 2024 margin
- R (+17.2) · D 40.9% · R 58.1%
- 2008→2024 swing
- -5.5pp toward R · 2008: -11.7pp · 2024: -17.2pp
- All cycles
- 2024: R+17.2 2020: R+8.2 2016: R+7.9 2012: R+8.4 2008: R+11.7
Not yet ingested
- Civics
- —
Market trends
- HPI YoY
- ▲ 0.86%
- Current HPI
- 443.6984
- Rent YoY
- —
- Metro
- —
- State GDP YoY
- ▲ 4.54%
- F500 in state
- 20
Industry mix (Fortune 500 HQ in AZ)
| Industry | F500 HQs | Revenue |
|---|---|---|
| Technology | 2 | $13B |
|
||
| Mining / Metals | 1 | $23B |
|
||
| Environmental Services | 1 | $16B |
|
||
| Metals / Steel | 1 | $14B |
|
||
| Technology Distribution | 1 | $9B |
|
||
| Homebuilding | 1 | $8B |
|
||
Price history
+23.3% since first listed6 events — show timeline
- 2025-07-27 Listed $185,000 WMMLS
- 2025-07-26 Listed $185,000 ARMLS
- 2022-11-14 Sold (MLS) $110,000 WMMLS
- 2022-10-17 Delisted — WMMLS
- 2022-08-11 Price Changed $119,000 WMMLS
- 2022-01-10 Listed $150,000 WMMLS
Cash-flow waterfall
monthlySold comps — $/sqft
last 12 mo · ≤1 miLoading sold comps…