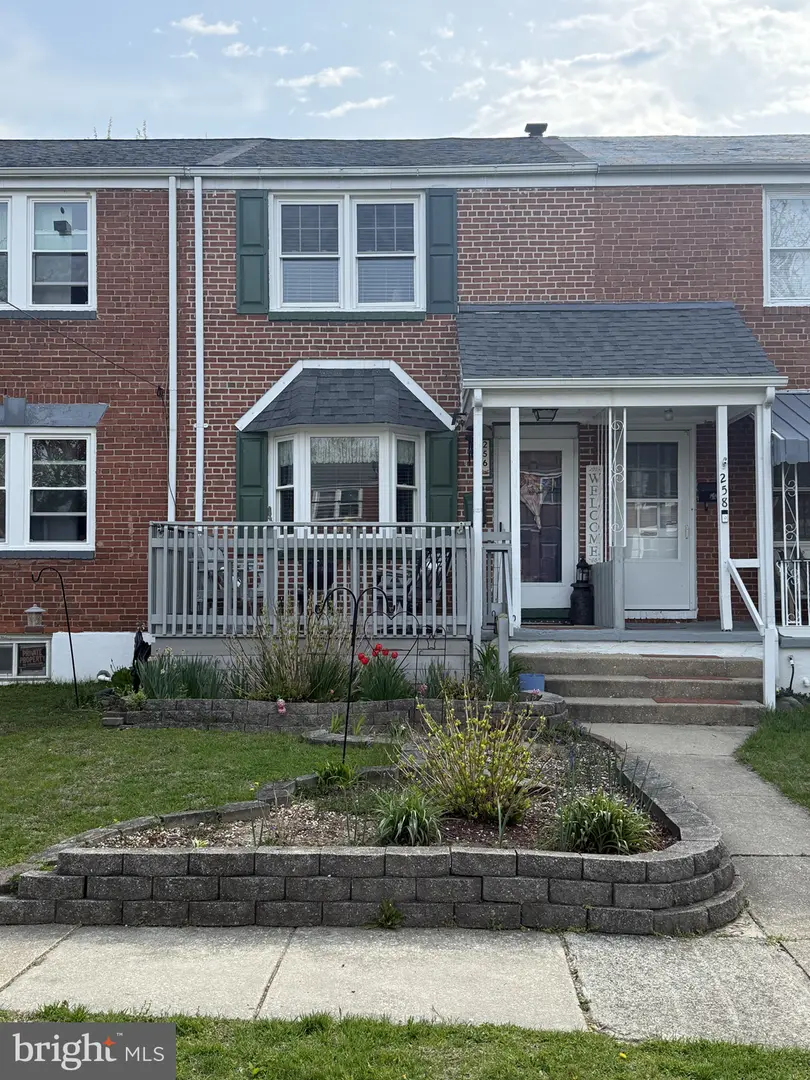
256 Birch Ave · Elsmere, DE
Flood risk 1/10 · Minimal
- FEMA flood zone
- X (unshaded)
- Chance of flooding over 30 yrs
- 0.0%
- Est. flood insurance / yr
- $473 – $860
Fire risk 1/10 · Minimal
- Est. fire insurance / yr
- $476 – $884
Heat risk 7/10 · Major
- Hot days now (above 103°F)
- 7 days/yr
- Hot days in 30 yrs
- 15 days/yr
Wind risk 6/10 · Moderate
- Chance of severe wind over 30 yrs
- 27.0%
Air-quality risk 3/10 · Minor
- Unhealthy air days now
- 3 days/yr
- Unhealthy air days in 30 yrs
- 4 days/yr
Risk factors via First Street. Map © Google.
Why this score? — see what drove the D+ grade
The composite is a weighted blend of 9 inputs, each scored 0–100. Each bar is that input's sub-score; the figure is the points it added to the 100-point composite (weight × sub-score).
- Cash flow +15.4/30.0
- ARV discount +11.4/15.0
- DSCR +4.7/10.0
- Rent growth +4.1/5.0
- Livability +3.8/5.0
- 1% rule +3.1/10.0
- Schools +3.1/10.0
- Condition / age +2.5/5.0
- Appreciation +0.0/10.0
$187,500
🖨 Deal sheet (PDF) 📄 Offer letter ✓ Due diligence
Listing remarks
2BR/1BA brick row home in Elsmere Manor with replacement windows and efficient layout. Main level features living room and dining area open to the kitchen. Two bedrooms upstairs. Partially finished walk-out basement adds additional living/storage space. Front porch/deck and rear patio with pergola, swing, and shed. In need of updates—great opportunity to build sweat equity. Sold as-is, where-is.
Key facts
- Kitchen
- Living room
- Dining area
Tags
Neighborhood map
What this means for you Summary
Snapshot
- This is a 2-bed/1.0-bath townhouse listed at $188k.
Deal economics
- At list price, monthly cash flow is $73 ($881/yr) — positive.
- The deal already cash-flows at list — no discount required.
- To meet the 1% rule (rent ≥ 1% of price), the offer needs to be $151k (19.4% below list).
- Recommended offer: $151k (19.4% below list) — sets the bar for 1% rule.
- Cap rate 6.8% vs local median 4.7% in Elsmere — top-decile yield for the area; either an underpriced asset or a hidden risk that comps aren't pricing in. Stress-test before assuming the spread holds.
Location & tenants
- Location reads 76/100 on livability (#5 in DE, #3,599 nationally) — a middle-class / working-renter tenant base. Strengths: cost of living A+, housing A+, employment B+; Watch: amenities F, commute F.
- Red Clay Consolidated School District (suburban): math 27% / reading 42% proficiency, ranked #12 of 26 in DE (top 46%) — families likely to look elsewhere, expect single-tenant / working-renter base with shorter leases.
- Zoned schools: Baltz (Austin D.) Elementary School (math 14% / reading 24%, grade F, #83 of 105 statewide, top 79%, 528 students, 0% FRL); Dupont (Alexis I.) Middle School (math 7% / reading 24%, grade F, #33 of 36 statewide, top 91%, 492 students, 0% FRL); Mckean (Thomas) High School (math 2% / reading 17%, grade F, #38 of 40 statewide, top 100%, 927 students, 0% FRL) — zoned schools average 0% FRL vs 44% district-wide (44 pts lower); this property's tenant base skews higher-income than the district average.
- Zoned-school proficiency averages 15% at this address vs 34% district-wide (-20 pts) — the specific schools serving this property underperform the Red Clay Consolidated School District average; the district grade overstates school quality for this exact location.
- Market conditions: Rents rising fast (+6.3%/yr); 168 active listings in the ZIP; 25 comparable units currently listed for rent nearby; rentals at typical pace (median 18d on market — plan ~3-4 weeks tenant-placement turnaround); 1,367 units permitted in New Castle County in 2024 (201 in 5+ unit buildings).
- This rent runs 30% of the median local income ($60k/yr) — at the standard rent-burdened threshold; future hikes will face affordability resistance.
Forward outlook
- Local home prices are declining (-3.0%/yr); year-one equity from $1k of loan paydown is wiped out by about $6k of value loss. Plan a longer hold.
- New Castle County population projected at +9% by 2050 — modest demand growth; plan on rents tracking national, not racing it.
Negotiation context
- Only 2 days on market — expect competitive offers; lowballing is unlikely to land.
- Current owner paid $36k; list at $188k implies a 422% gain — meaningful room to come down on a strong offer.
Risks & watch-outs
- Watch-outs: built in 1944 — expect roof / HVAC / electrical / plumbing capex.
- Climate carrying-cost: major wind risk, 27% chance of damaging wind over 30y; extreme-heat days projected 7→15/yr by 2055 (HVAC capex compounding) — expect insurance premiums to compound above CPI over the hold.
Questions for the listing agent
- Built in 1944 — when were the roof, HVAC, electrical panel, plumbing, and water heater last replaced?
- Is there a deadline driving the sale (1031 exchange, divorce, estate, relocation)? That informs how much negotiation room exists.
- Schools are D-rated, which usually means shorter tenancies and higher turnover. Who's the typical renter profile here, and what's been the actual vacancy rate?
- The area grade is low — what's the realistic commute time and amenity access for the typical tenant pool here? Any planned neighborhood developments (good or bad) we should know about?
- What's the average days-on-market for RENTAL listings here right now (not sales)? A rising rental-DOM trend means longer vacancies and softer asking-rent achievability than the comps imply.
- What's the recent tenant-quality profile in this submarket — average credit score on applications, eviction rate, late-payment / NSF rate, and stable-employment percentage? A property-management company in the area should have these aggregated.
- How much new for-sale + rental construction is in the pipeline within 1–3 miles? Heavy new supply typically softens prices + rents 12–24 months out; constrained supply supports both.
Investment metrics
- 1% rule
- 0.81% ✗
- Cap rate
- 6.76%
- Cash-on-cash
- 1.68%
- DSCR
- 1.07
- GRM
- 10.3
CMA / ARV
- ARV (on-the-fly)
- $205,200
- Comps found
- 12
Show comp detail 12 sales within ~0.75 mi
| Address | Dist | Beds/Ba | Sqft | Sold | Price | $/sf | Match |
|---|---|---|---|---|---|---|---|
| 288 Filbert Ave | 0.09mi | 2/1.0 | 950 (0%) | 1mo | $205,000 | $216 | 95 |
| 1021 Dover Ave | 0.07mi | 2/1.0 | 950 (0%) | 5mo | $189,000 | $199 | 93 |
| 1015 Baltimore Ave | 0.13mi | 2/1.0 | 960 (+1%) | 1mo | $210,900 | $220 | 91 |
| 126 Birch Ave | 0.17mi | 2/1.0 | 950 (0%) | 1mo | $165,000 | $174 | 91 |
| 132 Birch Ave | 0.16mi | 2/1.0 | 960 (+1%) | 2mo | $200,000 | $208 | 89 |
| 127 Bungalow Ave | 0.31mi | 3/1.0 (+1) | 1,000 (+5%) | 8mo | $185,000 | $185 | 66 |
| 1366 Maple Ave | 0.42mi | 3/1.0 (+1) | 1,025 (+8%) | 0mo | $180,000 | $176 | 62 |
| 1300 Cypress Ave | 0.33mi | 3/1.0 (+1) | 875 (-8%) | 6mo | $215,000 | $246 | 61 |
| 1315 Maple Ave | 0.36mi | 3/1.0 (+1) | 1,025 (+8%) | 9mo | $215,000 | $210 | 58 |
| 217 Locust Ave | 0.18mi | 3/1.0 (+1) | 1,075 (+13%) | 10mo | $236,000 | $220 | 56 |
| 1336 Cypress Ave | 0.41mi | 3/1.0 (+1) | 1,040 (+10%) | 10mo | $250,000 | $240 | 52 |
| 7 Glenway Place Aka Norway Ave | 0.68mi | 2/1.5 | 1,000 (+5%) | 10mo | $245,000 | $245 | 49 |
Match score weights: distance 35% · size 25% · config 20% · recency 20%. Top-matched comps best support the ARV.
Projected returns pro-forma
-3.0% appreciation · 6.35% rent growth · sell at horizon
- IRR
- -10.4%
- Equity multiple
- 0.61×
- Total profit
- $-20,523
- Equity at exit
- $27,957
- IRR
- 2.6%
- Equity multiple
- 1.21×
- Total profit
- $10,965
- Equity at exit
- $16,212
Cash invested: $52,500 (down + closing). Projections, not guarantees.
Landlord ↔ Tenant lean methodology
- Overall (STATE)
- 70 Landlord-Friendly
- State Delaware
- 70 Landlord-Friendly · D+7
- County
- — inherits STATE
- City
- — inherits STATE
ZIP-level market 19805
- Rents YoY
- 6.3%
- Active inventory
- 168
- Price-to-rent
- 10.3×
Monthly cashflow live
- Estimated rent
- $1,512 high interval (Pro) →
- Mortgage (P&I)
- −$983
- Tax from tax record
- −$60 /mo · $714/yr
- Insurance
- −$78
- HOA
- −$0
- Vacancy / Maint / Mgmt
- −$317
- Net cashflow
- $73
Break-even live
Sensitivity live
| Price | -10% $180 | -5% $127 | +0% $73 | +5% $20 | +10% $-33 |
|---|---|---|---|---|---|
| Rent | -10% $-46 | -5% $14 | +0% $73 | +5% $133 | +10% $193 |
| Rate | -1.0pp $168 | -0.5pp $121 | base $73 | +0.5pp $25 | +1.0pp $-25 |
UW: 25.0% down · 7.5% · 30yr · 1.5% tax · 5.0% vac · 8.0% maint · 8.0% mgmt
Financing live
Cash to close
- Down payment
- $46,875
- Closing costs
- $5,625
- Reserves months
- —
- Total cash needed
- —
Loan-product check · same deal, 3 products live
Conventional
25% down · 7.5% · 30yr
- Down + closing
- —
- Monthly P&I
- —
- Monthly cashflow
- —
- DSCR
- —
- Eligible?
- —
Personal DTI + credit; lowest rate.
DSCR
20% down · 8.5% · 30yr
- Down + closing
- —
- Monthly P&I
- —
- Monthly cashflow
- —
- DSCR
- —
- Eligible?
- —
No personal income docs; deal must DSCR.
Hard money
10% down · 12.0% · 12mo
- Down + closing
- —
- Monthly P&I
- —
- Monthly cashflow
- —
- DSCR
- —
- Eligible?
- —
Short-term bridge; refi at stabilization.
Rent comps 25 comps
| Address | Beds | Baths | Sqft | Rent | $/sqft | DOM | Units | Dist |
|---|---|---|---|---|---|---|---|---|
| 5 Ruth Rd Elsmere, DE | 1.0–2.0 | 1.0 | 650 | $1,450 | $2.23 | 15d | 1 | 0.36mi |
| 1355 Maple Ave Elsmere, DE | 2.0 | 1.0 | 900 | $1,475 | $1.64 | 45d | 1 | 0.46mi |
| 131 Scarborough Park Dr Wilmington, DE | 1.0–2.0 | 1.0–1.5 | 837 | $1,700 | $2.03 | 45d | 1 | 0.53mi |
| 2700 Boulevard Rd Wilmington, DE | 1.0–2.0 | 1.0 | 743 | $1,525 | $2.05 | 1d | 7 | 0.60mi |
| 201 New Rd Wilmington, DE | 2.0 | 1.0 | 800 | $1,350 | $1.69 | 5d | 1 | 0.72mi |
| 1 Matthes Ave Wilmington, DE | 1.0 | 1.0 | 600 | $1,295 | $2.16 | 1d | 1 | 0.74mi |
| 37 E Champlain Ave Wilmington, DE | 2.0 | 1.0 | 975 | $1,612 | $1.65 | 0d | 1 | 0.84mi |
| 13 Lowry Dr Wilmington, DE | 1.0 | 1.0 | 530 | $1,447 | $2.73 | 45d | 1 | 1.10mi |
| 13 Lowry Dr Wilmington, DE | 1.0 | 1.0 | 530 | $1,407 | $2.65 | 26d | 1 | 1.10mi |
| 13 Lowry Dr Wilmington, DE | 1.0 | 1.0 | 530 | $1,397 | $2.64 | 18d | 1 | 1.10mi |
| 13 Lowry Dr Wilmington, DE | 2.0 | 1.0 | 700 | $1,647 | $2.35 | 24d | 1 | 1.10mi |
| 13 Lowry Dr Wilmington, DE | 1.0 | 1.0 | 530 | $1,397 | $2.64 | 5d | 1 | 1.10mi |
| 1815 Maple St Wilmington, DE | 3.0 | 1.5 | 1100 | $1,995 | $1.81 | 0d | 1 | 1.24mi |
| 1600 Bonwood Rd Wilmington, DE | 2.0 | 2.0 | 970 | $1,614 | $1.66 | 17d | 1 | 1.25mi |
| 1600 Bonwood Rd Wilmington, DE | 2.0 | 1.0 | 970 | $1,570 | $1.62 | 1d | 1 | 1.25mi |
| 1600 Bonwood Rd Wilmington, DE | 1.0 | 1.0 | 702 | $1,290 | $1.84 | 5d | 1 | 1.25mi |
| 219 S Union St Unit B Wilmington, DE | 1.0 | 1.0 | 1075 | $1,150 | $1.07 | 26d | 1 | 1.26mi |
| 1401 Maryland Ave Wilmington, DE | 1.0 | 1.0 | 612 | $1,275 | $2.08 | 45d | 1 | 1.28mi |
| 3403 Lancaster Pike Wilmington, DE | 2.0–3.0 | 1.0 | 1022 | $1,439 | $1.41 | 1d | 3 | 1.30mi |
| 1507 Coleman St Wilmington, DE | 2.0 | 1.0 | 650 | $1,495 | $2.30 | 26d | 1 | 1.31mi |
| 11 Corbin Ct Unit 1 Wilmington, DE | 1.0 | 1.0 | 675 | $1,295 | $1.92 | 4d | 1 | 1.33mi |
| 545 Homestead Rd Wilmington, DE | 2.0 | 1.0 | 800 | $1,399 | $1.75 | 45d | 1 | 1.34mi |
| 70 Court Dr Wilmington, DE | 1.0–3.0 | 1.0 | 713 | $1,614 | $2.26 | 0d | 15 | 1.36mi |
| 207 S DuPont St Wilmington, DE | 1.0 | 1.5 | 1000 | $1,495 | $1.50 | 20d | 1 | 1.38mi |
| 231 5th Ave Wilmington, DE | 2.0 | 1.0 | 1050 | $1,350 | $1.29 | 45d | 1 | 1.48mi |
Listing history 3 events
-
2026-04-16status Pending
-
2026-04-14$187,500 Active
-
1984-04-01soldstatus $35,900
ⓘ Source: listings_history table (triggers on properties + properties_extension) + one-shot
backfill from property_details.listing_events for pre-trigger history.
Tax reassessment forecast DE · Partial reset (capped growth)
- Current annual tax
- $714 · $60/mo
- Projected year-2 tax
- $901 · $75/mo
- Expected delta
- +$187/yr (+$16/mo · 26.2%)
ⓘ Screening estimate from a state-policy table — verify with the county assessor before closing.
Climate risk First Street
- Flood 1/10 Low FEMA zone X (unshaded) · 0% chance over 30 yrs
- Wildfire 1/10 Low
- Heat 7/10 Severe 7 d/yr ≥103°F today · 15 d/yr by 30 yrs out
- Wind 6/10 Major 27% chance of damaging wind over 30 yrs
- Air quality 3/10 Moderate 3 unhealthy d/yr today · 4 by 30 yrs out
Nearby sold comps map
Loading sold comps map…
Walkable amenities ~0.75 mi
Loading nearby amenities…
Taxation est. · year 1
- Rental income
- $18,142
- − Mortgage interest
- −$10,503
- − Property taxes
- −$714
- − Insurance
- −$938
- − Repairs & maintenance
- −$1,451
- − Management
- −$1,451
- − Depreciation
- −$5,455
- Taxable loss
- −$2,370
- Est. tax savings @ 24.0%
- +$569
- After-tax cash flow
- $1,450/yr
For passive investors: Depreciation is non-cash, so a rental often shows a tax loss while cash-flowing — sheltering income. Rental losses are passive: they offset passive income freely, and up to $25,000/yr can offset ordinary (W-2) income if you actively participate and your MAGI is under $100k (phasing out to $0 by $150k); unused losses carry forward. On sale, claimed depreciation is recaptured at up to 25%, and gains may owe capital-gains tax (a 1031 exchange can defer both). Figures are a year-1 estimate at your 24.0% rate — not tax advice; consult a CPA.
Schools (NCES district)
- District
- Red Clay Consolidated School District
- NCES district ID
- 1001300
- Math proficiency
- 27% ▼ -11.00%
- Reading proficiency
- 42% ▼ -7.00%
- Median HH income
- $64,298
- Composite
- 31.25/100
- National rank
- #6027
- State rank
- #12 of 26 in DE
Livability — Elsmere
- Score
- 76/100
- State rank
- #5
- US rank
- #3599
Category grades
Schools grade is shown separately in the Schools card above.
Census & demographics
- Census place
- Elsmere, DE
- County
- New Castle County · 483,412 people
- Metro
- Philadelphia-Camden-Wilmington, PA-NJ-DE-MD
- Population (ZIP)
- 41,402
- Household income
- $60,221
- Rent vs Own
- Severe rent burden
- 1730.0
Population outlook (New Castle County) Hauer SSP2
- Today (2025)
- 594,686 people
- By 2030
- 609,164 · +2.4%
- By 2040
- 632,154 · +6.3%
- By 2050
- 649,068 · +9.1%
- By 2075
- 687,771 · +15.7%
- By 2100
- 694,961 · +16.9%
Race, ethnicity, and origin ACS 2023
- Neighborhood character
- Diverse neighborhood (Simpson 0.70)
- Race & ethnicity
- White 37% Black 32% Hispanic / Latino 25% Two or more races 10%
- Hispanic origin (detail)
- Mexican 10% Puerto Rican 10% Dominican 2%
- Common ancestry
- Romanian 4% Slovak 1% Italian 1%
- Foreign-born
- 9% · Canada
- Languages at home
- 79% English-only · Spanish 18% French/Haitian/Cajun 1% Arabic 1%
Political lean MEDSL · New Castle
- 2024 margin
- Solid D (+32.6) · D 65.5% · R 32.9% · Other 1.6%
- 2008→2024 swing
- -8.1pp toward R · 2008: 40.6pp · 2024: 32.6pp
- All cycles
- 2024: D+32.6 2020: D+37.1 2016: D+29.6 2012: D+34.1 2008: D+40.6
Not yet ingested
- Civics
- —
Market trends
- HPI YoY
- ▼ -291.16%
- Current HPI
- 259.1455
- Rent YoY
- ▲ 6.35%
- Metro
- Philadelphia-Camden-Wilmington, PA-NJ-DE-MD
- State GDP YoY
- —
- F500 in state
- 0
Price history
+422.3% since first listed3 events — show timeline
- 2026-04-16 Pending — BRIGHT MLS
- 2026-04-14 Listed $187,500 BRIGHT MLS
- 1984-04-01 Sold (Public Records) $35,900 Public Records
Property tax history
-0.4%/yrLatest (2024): $714 · +14.2% YoY. Source: county tax records.
Cash-flow waterfall
monthlySold comps — $/sqft
last 12 mo · ≤1 miLoading sold comps…