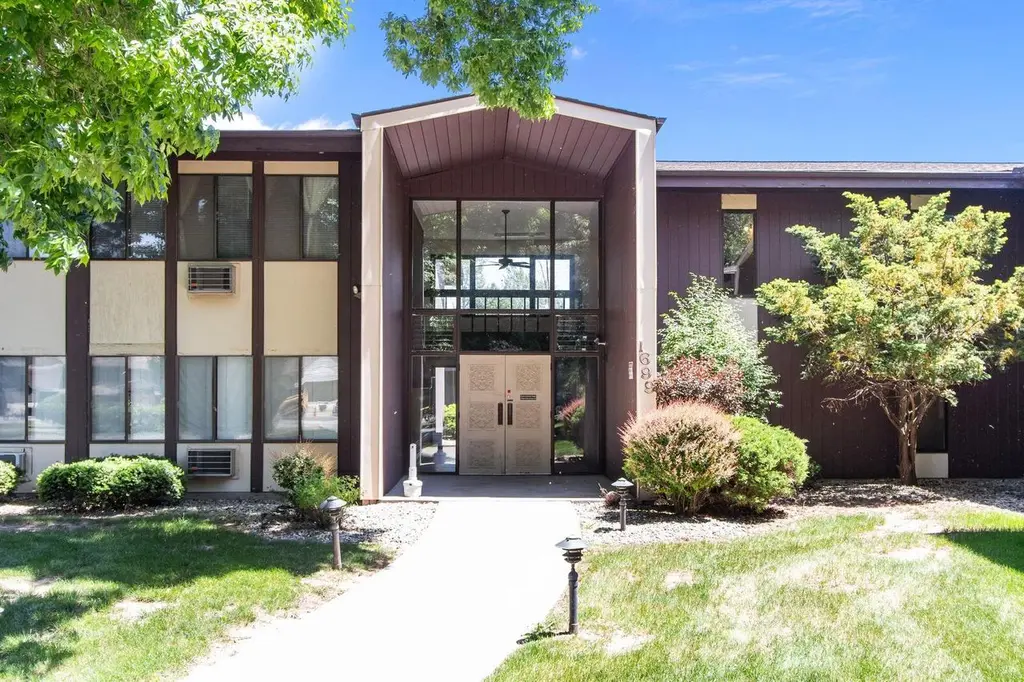
1699 Alcan Dr #210 · Menasha, WI
Flood risk No data
- FEMA flood zone
- —
- Chance of flooding over 30 yrs
- —
- Est. flood insurance / yr
- —
Fire risk No data
- Est. fire insurance / yr
- —
Heat risk No data
- Hot days now (above threshold)
- —
- Hot days in 30 yrs
- —
Wind risk No data
- Chance of severe wind over 30 yrs
- —
Air-quality risk No data
- Unhealthy air days now
- —
- Unhealthy air days in 30 yrs
- —
Risk factors via First Street. Map © Google.
Why this score? — see what drove the D grade
The composite is a weighted blend of 9 inputs, each scored 0–100. Each bar is that input's sub-score; the figure is the points it added to the 100-point composite (weight × sub-score).
- Appreciation +10.0/10.0
- ARV discount +7.5/15.0
- Cash flow +6.9/30.0
- Livability +4.0/5.0
- Rent growth +3.7/5.0
- 1% rule +3.4/10.0
- Condition / age +2.5/5.0
- Schools +2.3/10.0
- DSCR +1.1/10.0
$114,900
🖨 Deal sheet 📄 Offer letter ✓ Due diligence
Listing remarks
Why rent when you can own? This affordable 1 bedroom, 1 bath second-floor condo offers comfortable, low-maintenance living in a convenient location. Enjoy the ease of a shared laundry room on the second level and the added bonus of a one-stall garage. Close to shopping, dining, and easy access to Hwy 441, this condo is worth a look. Call today!
Key facts
- Shared laundry room
- One-stall garage
- Convenient location
Tags
Property features AI
Finance
- Other: Condo zoned; Building described as 750 sq. ft. or less
- HOA & community: Monthly condo fee of $218; Association does not allow pets; Laundry facilities in the building; 32 units in the building/association
Exterior
- Parking: Detached 1-car garage
- Utilities: Municipal water; Municipal sewer; Electric service
- Home design: Condo (flat, one level)
- Construction: No finished below-grade space; Approximately 700 finished above-grade square feet
- Exterior features: Stucco and cedar exterior
Interior
- Kitchen: Microwave; Range/Oven; Refrigerator; Kitchen on the main level, about 7 x 7
- Bedrooms: Master bedroom on the main level, about 12 x 13
- Bathrooms: 1 full bathroom
- Heating & cooling: Electric heating; Wall A/C
- Interior features: Storage locker included
- Laundry & utility: Shared laundry facilities in the association
Neighborhood map
What this means for you Summary
Snapshot
- This is a 1-bed/1.0-bath condo listed at $115k.
Deal economics
- At list price, monthly cash flow is $-175 ($-2k/yr) — negative.
- To cash-flow at today's rent, offer at most $84k (26.8% below list).
- To meet the 1% rule (rent ≥ 1% of price), the offer needs to be $97k (15.7% below list).
- Recommended offer: $84k (26.8% below list) — sets the bar for cash-flow.
- Cap rate 4.5% vs local median 2.5% in Menasha — top-decile yield for the area; either an underpriced asset or a hidden risk that comps aren't pricing in. Stress-test before assuming the spread holds.
Location & tenants
- Location reads 80/100 on livability (#59 in WI, #1,628 nationally) — a professional / high-income tenant draw. Strengths: commute A+, cost of living A+, housing A+; Watch: employment C-, schools D, amenities D.
- Menasha Joint School District (suburban): math 30% / reading 24% proficiency, ranked #300 of 342 in WI (top 88%) — low school quality limits family demand, transient renter base, plan for 1-2y turnover.
- Market conditions: Rents rising fast (+4.6%/yr); 69 active listings in the ZIP; 7 comparable units currently listed for rent nearby; rentals at typical pace (median 21d on market — plan ~3-4 weeks tenant-placement turnaround); 652 units permitted in Winnebago County in 2024 (333 in 5+ unit buildings).
- This rent is only 17% of the median local income ($69k/yr) — well below the 30% rent-burden line; pricing power to push rent on renewal without tenant pushback.
Forward outlook
- In year one you build about $12k of equity ($794 loan paydown + $11k appreciation (10.0% local appreciation)).
- Winnebago County population projected at +3% by 2050 — modest demand growth; plan on rents tracking national, not racing it.
- By year 3, paydown + projected appreciation supports a ~$31k cash-out refi (75% LTV) — recoverable capital for the next deal without selling this one.
Negotiation context
- Only 14 days on market — expect competitive offers; lowballing is unlikely to land.
- Current owner paid $35k; list at $115k implies a 228% gain — meaningful room to come down on a strong offer.
Risks & watch-outs
- Watch-outs: HOA is 23% of rent.
Questions for the listing agent
- What do current leases actually rent for vs. the listed asking? Can we see a recent rent roll and the last 12 months of T-12 income?
- Built in 1973 — when were the roof, HVAC, electrical panel, plumbing, and water heater last replaced?
- What does the HOA fee cover, when was the last increase, and are there any pending special assessments or reserve-fund shortfalls?
- Any open or pending special assessments — roof, HVAC, plumbing, elevator, façade? What's the per-unit balance and payoff schedule, and is the seller paying it off at close or rolling it to the buyer?
- Is there a deadline driving the sale (1031 exchange, divorce, estate, relocation)? That informs how much negotiation room exists.
- Schools are D-rated, which usually means shorter tenancies and higher turnover. Who's the typical renter profile here, and what's been the actual vacancy rate?
- The area grade is low — what's the realistic commute time and amenity access for the typical tenant pool here? Any planned neighborhood developments (good or bad) we should know about?
- What's the average days-on-market for RENTAL listings here right now (not sales)? A rising rental-DOM trend means longer vacancies and softer asking-rent achievability than the comps imply.
- What's the recent tenant-quality profile in this submarket — average credit score on applications, eviction rate, late-payment / NSF rate, and stable-employment percentage? A property-management company in the area should have these aggregated.
- How much new apartment / multifamily construction is in the pipeline within 1–3 miles? Heavy new supply (>2% of stock underway) typically softens rents 12–24 months out; light construction supports rent growth.
Investment metrics
- 1% rule
- 0.84% ✗
- Cap rate
- 4.47%
- Cash-on-cash
- -6.51%
- DSCR
- 0.71
- GRM
- 9.9
CMA / ARV
No comps found within radius.
Projected returns pro-forma
10.0% appreciation · 4.62% rent growth · sell at horizon
- IRR
- 20.2%
- Equity multiple
- 2.65×
- Total profit
- $53,168
- Equity at exit
- $103,511
- IRR
- 18.9%
- Equity multiple
- 6.25×
- Total profit
- $168,998
- Equity at exit
- $223,225
Cash invested: $32,172 (down + closing). Projections, not guarantees.
Landlord ↔ Tenant lean methodology
- Overall (STATE)
- 73 Landlord-Friendly
- State Wisconsin
- 73 Landlord-Friendly · R+2
- County
- — inherits STATE
- City
- — inherits STATE
ZIP-level market 54952
- Home prices YoY
- 7.2%
- Rents YoY
- 4.6%
- Active inventory
- 69
- Price-to-rent
- 9.9×
Monthly cashflow live
- Estimated rent
- $968 high interval (Pro) →
- Mortgage (P&I)
- −$603
- Tax from tax record
- −$71 /mo · $853/yr
- Insurance
- −$48
- HOA
- −$218
- Vacancy / Maint / Mgmt
- −$203
- Net cashflow
- $-175
Break-even live
UW: 25.0% down · 7.5% · 30yr · 1.5% tax · 5.0% vac · 8.0% maint · 8.0% mgmt
Financing live
Cash to close
- Down payment
- $28,725
- Closing costs
- $3,447
- Reserves months
- —
- Total cash needed
- —
Loan-product check · same deal, 3 products live
Conventional
25% down · 7.5% · 30yr
- Down + closing
- —
- Monthly P&I
- —
- Monthly cashflow
- —
- DSCR
- —
- Eligible?
- —
Personal DTI + credit; lowest rate.
DSCR
20% down · 8.5% · 30yr
- Down + closing
- —
- Monthly P&I
- —
- Monthly cashflow
- —
- DSCR
- —
- Eligible?
- —
No personal income docs; deal must DSCR.
Hard money
10% down · 12.0% · 12mo
- Down + closing
- —
- Monthly P&I
- —
- Monthly cashflow
- —
- DSCR
- —
- Eligible?
- —
Short-term bridge; refi at stabilization.
Rent comps 7 comps
| Address | Beds | Baths | Sqft | Rent | $/sqft | DOM | Units | Dist |
|---|---|---|---|---|---|---|---|---|
| 1284 Midway Rd Menasha, WI | 2.0–4.0 | 1.0–2.0 | 800 | $1,250 | $1.56 | 21d | 1 | 0.42mi |
| 2405 Honey Lou Ct Unit 2405 05 Appleton, WI | 1.0 | 1.0 | 750 | $899 | $1.20 | 13d | 1 | 0.46mi |
| 2010 Regency Ct Unit 2021-6 Appleton, WI | 1.0 | 1.0 | 625 | $999 | $1.60 | 13d | 1 | 0.68mi |
| 2010 Regency Ct Unit 2021-2 Appleton, WI | 1.0 | 1.0 | 625 | $899 | $1.44 | 21d | 1 | 0.68mi |
| 1000 Lucerne Dr Menasha, WI | 1.0–3.0 | 1.0 | 962 | $849 | $0.88 | 13d | 34 | 0.79mi |
| 1263 Manitowoc Rd #3 Menasha, WI | 2.0 | 1.0 | 750 | $825 | $1.10 | 21d | 1 | 1.36mi |
| 700 S Memorial Dr Apt 4 Appleton, WI | 1.0 | 1.0 | 650 | $899 | $1.38 | 21d | 1 | 1.46mi |
HOA detail condo
- Monthly dues
- $218 · $2,616/yr
- Assessments
- None detected in remarks — confirm with the listing agent.
Listing history 12 events
-
2026-06-19days on market $114,900 Active 14 DOM
-
2026-06-18days on market $114,900 Active 13 DOM
-
2026-06-17days on market $114,900 Active 12 DOM
-
2026-06-16days on market $114,900 Active 11 DOM
-
2026-06-15days on market $114,900 Active 10 DOM
-
2026-06-14days on market $114,900 Active 8 DOM
-
2026-06-13days on market $114,900 Active 7 DOM
-
2026-06-10days on market $114,900 Active 5 DOM
-
2026-06-09days on market $114,900 Active 4 DOM
-
2026-06-08days on market $114,900 Active 3 DOM
-
2026-06-07remarks 346-char remark
-
2026-06-07$114,900 Active 2 DOM
ⓘ Source: listings_history table (triggers on properties + properties_extension) + one-shot
backfill from property_details.listing_events for pre-trigger history.
Tax reassessment forecast WI · Partial reset (capped growth)
- Current annual tax
- $853 · $71/mo
- Projected year-2 tax
- $1,489 · $124/mo
- Expected delta
- +$636/yr (+$53/mo · 74.6%)
ⓘ Screening estimate from a state-policy table — verify with the county assessor before closing.
Nearby sold comps map
Loading sold comps map…
Walkable amenities ~0.75 mi
Loading nearby amenities…
Taxation est. · year 1
- Rental income
- $11,620
- − Mortgage interest
- −$6,436
- − Property taxes
- −$853
- − Insurance
- −$574
- − Repairs & maintenance
- −$930
- − Management
- −$930
- − HOA
- −$2,616
- − Depreciation
- −$3,343
- Taxable loss
- −$4,062
- Est. tax savings @ 24.0%
- +$975
- After-tax cash flow
- $-1,120/yr
For passive investors: Depreciation is non-cash, so a rental often shows a tax loss while cash-flowing — sheltering income. Rental losses are passive: they offset passive income freely, and up to $25,000/yr can offset ordinary (W-2) income if you actively participate and your MAGI is under $100k (phasing out to $0 by $150k); unused losses carry forward. On sale, claimed depreciation is recaptured at up to 25%, and gains may owe capital-gains tax (a 1031 exchange can defer both). Figures are a year-1 estimate at your 24.0% rate — not tax advice; consult a CPA.
Schools (NCES district)
- District
- Menasha Joint School District
- NCES district ID
- 5509030
- Math proficiency
- 30% ▼ -10.00%
- Reading proficiency
- 24% ▼ -7.00%
- Median HH income
- $44,188
- Composite
- 23.19/100
- National rank
- #7945
- State rank
- #300 of 342 in WI
Livability — Menasha
- Score
- 80/100
- State rank
- #59
- US rank
- #1628
Category grades
Schools grade is shown separately in the Schools card above.
Census & demographics
- Census place
- Menasha, WI
- County
- Winnebago County · 155,689 people
- Metro
- Oshkosh-Neenah, WI
- Population (ZIP)
- 27,312
- Household income
- $69,196
- Rent vs Own
- Severe rent burden
- 636.0
Population outlook (Winnebago County) Hauer SSP2
- Today (2025)
- 175,480 people
- By 2030
- 177,928 · +1.4%
- By 2040
- 180,873 · +3.1%
- By 2050
- 181,302 · +3.3%
- By 2075
- 184,071 · +4.9%
- By 2100
- 175,932 · +0.3%
Race, ethnicity, and origin ACS 2023
- Neighborhood character
- Predominantly White (81%)
- Race & ethnicity
- White 81% Hispanic / Latino 11% Two or more races 8% Asian 2%
- Hispanic origin (detail)
- Mexican 8% Puerto Rican 3%
- Common ancestry
- Romanian 6% Iranian 4% Portuguese 4%
- Foreign-born
- 5% · Canada, China
- Languages at home
- 91% English-only · Spanish 6% Other Asian/Pacific 1%
Political lean MEDSL · Winnebago
- 2024 margin
- Toss-up / Even · D 46.9% · R 51.7% · Other 1.4%
- 2008→2024 swing
- -16.4pp toward R · 2008: 11.7pp · 2024: -4.8pp
- All cycles
- 2024: R+4.8 2020: R+4.0 2016: R+7.4 2012: D+3.8 2008: D+11.7
Not yet ingested
- Civics
- —
Market trends
- HPI YoY
- ▲ 30.18%
- Current HPI
- 446.39
- Rent YoY
- ▲ 4.62%
- Metro
- Oshkosh-Neenah, WI
- State GDP YoY
- ▲ 2.10%
- F500 in state
- 20
Industry mix (Fortune 500 HQ in WI)
| Industry | F500 HQs | Revenue |
|---|---|---|
| Industrial Machinery | 4 | $23B |
|
||
| Industrial Technology | 2 | $36B |
|
||
| Insurance | 1 | $36B |
|
||
| Professional Services | 1 | $19B |
|
||
| Utilities | 1 | $9B |
|
||
| Consumer Goods | 1 | $3B |
|
||
Price history
+155.3% since first listed3 events — show timeline
- 2026-06-02 Listed $114,900 RANW
- 2013-12-03 Sold (Public Records) $35,000 Public Records
- 2004-06-01 Sold (Public Records) $45,000 Public Records
Property tax history
-2.2%/yrLatest (2021): $853 · +25.2% YoY. Source: county tax records.
Cash-flow waterfall
monthlySold comps — $/sqft
last 12 mo · ≤1 miLoading sold comps…