 🌊 Lakefront
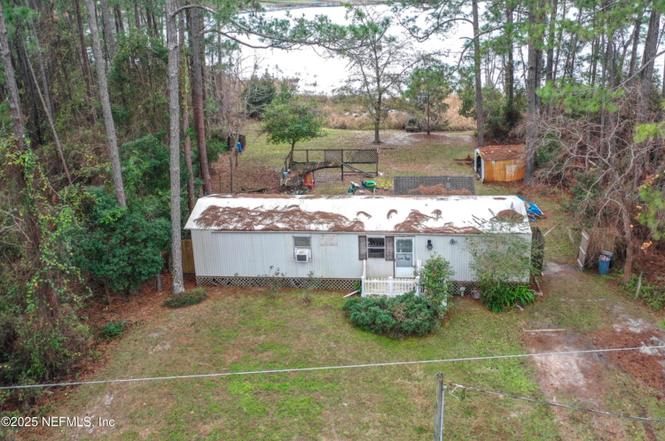
133 Mullis Ave · Interlachen, FL
Flood risk 1/10 · Minimal
- FEMA flood zone
- X (unshaded)
- Chance of flooding over 30 yrs
- 0.0%
- Est. flood insurance / yr
- $507 – $1,088
Fire risk 5/10 · Moderate
- Est. fire insurance / yr
- $947 – $1,759
Heat risk 8/10 · Major
- Hot days now (above 109°F)
- 6 days/yr
- Hot days in 30 yrs
- 18 days/yr
Wind risk 9/10 · Severe
- Chance of severe wind over 30 yrs
- 99.0%
Air-quality risk 2/10 · Minimal
- Unhealthy air days now
- 1 days/yr
- Unhealthy air days in 30 yrs
- 2 days/yr
Risk factors via First Street. Map © Google.
Why this score? — see what drove the B+ grade
The composite is a weighted blend of 9 inputs, each scored 0–100. Each bar is that input's sub-score; the figure is the points it added to the 100-point composite (weight × sub-score).
- Cash flow +30.0/30.0
- ARV discount +15.0/15.0
- 1% rule +10.0/10.0
- DSCR +10.0/10.0
- Livability +3.4/5.0
- Schools +3.0/10.0
- Rent growth +2.5/5.0
- Condition / age +2.5/5.0
- Appreciation +0.0/10.0
$79,000
🖨 Deal sheet (PDF) 📄 Offer letter ✓ Due diligence
Listing remarks MLS
LAKE VIRGINIA SINGLEWIDE MOBILE HOME ON A SMALL FISHING LAKE. ELECTRIC STOVE, REFRIGERATOR, AND ROLL AROUND DISHWASHER WILL STAY. THE MOBILE HAS CATHEDRAL CEILINGS, CENTRAL ELECTRIC HEAT AND WINDOW AIR. GREAT GETAWAY PLACE.
Key facts
- 0.57 acre lot
- Built 1989
- Listed 261 days
Property features AI
Finance
- Other: Located on a county (dirt) road
- HOA & community: Not a senior community
Exterior
- Parking: Off-street parking
- Utilities: Septic tank; Electricity connected; Water connected; Cable available
- Home design: Single wide mobile home; One story; North-facing; Lakefront property
- Construction: Manufactured/mobile home construction
- Exterior features: Dock; Fire pit; Deck; Shed(s); Wooded lot with many trees; Irregular lot shape; Split possible
Interior
- Kitchen: Electric cooktop; Electric oven; Electric range; Microwave; Refrigerator; Electric water heater
- Bedrooms: Two bedrooms (both on the main level)
- Bathrooms: One full bathroom
- Heating & cooling: Electric heating; Wall/window air conditioning units
- Interior features: Five total rooms; Partially furnished
- Laundry & utility: Washer/dryer details not provided
Neighborhood map
What this means for you Summary
Snapshot
- This is a 2-bed/1.0-bath manufactured listed at $79k.
Deal economics
- At list price, monthly cash flow is $408 ($5k/yr) — positive.
- The deal already cash-flows at list — no discount required.
- Meets the 1% rule at list price ($1k rent vs $79k).
- Recommended offer: $70k (12.0% below list) — sets the bar for market timing.
- Cap rate 12.5% vs local median 5.1% in Interlachen — top-decile yield for the area; either an underpriced asset or a hidden risk that comps aren't pricing in. Stress-test before assuming the spread holds.
Location & tenants
- Location reads 67/100 on livability (#540 in FL) — a middle-class / working-renter tenant base. Strengths: crime A+, cost of living A+, housing A+; Watch: amenities F, commute F, employment F.
- Putnam (town): math 34% / reading 39% proficiency, ranked #66 of 73 in FL (top 90%) — families likely to look elsewhere, expect single-tenant / working-renter base with shorter leases; 71% free/reduced lunch — lower-income household profile, screen leases tightly.
- Zoned schools: Robert H. Jenkins Jr Elementary School (math 34% / reading 32%, grade F, #1,773 of 2,144 statewide, top 83%, 904 students, 64% FRL); Putnam Academy of Arts And Sciences (math 42% / reading 52%, grade D+, #291 of 571 statewide, top 52%, 177 students, 75% FRL, charter); Interlachen Jr-Sr High School (math 16% / reading 32%, grade F, #529 of 667 statewide, top 80%, 1,097 students, 71% FRL) — zoned schools at 70% FRL track the district average.
- Market conditions: 760 active listings in the ZIP; 2 comparable units currently listed for rent nearby; 113 units permitted in Putnam County in 2024 (0 in 5+ unit buildings).
Forward outlook
- Local home prices are declining (-3.0%/yr); year-one equity from $546 of loan paydown is wiped out by about $2k of value loss. Plan a longer hold.
- Putnam County population projected at -31% by 2050 — secular population decline; favor cash flow + early exit over multi-decade hold.
- At projected returns (-3.0% appreciation + 3.0% rent growth), your $22k cash investment doubles in ~6 years — after that, you're playing with house money.
Negotiation context
- It's been on market 261 days — a 12% lower offer ($70k) is reasonable based on typical stale-listing flexibility.
- 6 sale attempts since 20y ago; this cycle's ask has dropped $81k (51%) from the opening price — seller is motivated, your offer sets the floor, not the list.
- Current owner paid $17k; list at $79k implies a 365% gain — meaningful room to come down on a strong offer.
Risks & watch-outs
- Climate carrying-cost: severe wind risk, 99% chance of damaging wind over 30y; moderate wildfire risk; extreme-heat days projected 6→18/yr by 2055 (HVAC capex compounding) — expect insurance premiums to compound above CPI over the hold.
Questions for the listing agent
- It's been on market 261 days. Have you received any prior offers? Is the seller open to a 12% concession, seller financing, or rate buy-down credit?
- Why hasn't it sold? Are there any deal-killer items the seller is aware of (foundation, flood, title, zoning, code violations)?
- Is there a deadline driving the sale (1031 exchange, divorce, estate, relocation)? That informs how much negotiation room exists.
- Schools are D-rated, which usually means shorter tenancies and higher turnover. Who's the typical renter profile here, and what's been the actual vacancy rate?
- This sits on a lake — are riparian / water-frontage rights deeded with the parcel? Any dock permits, shoreline easements, or HOA water-use restrictions?
- What's the documented flood / surge / shoreline-erosion history here (FEMA AND non-FEMA — e.g., storm surge, creek backup, septic-field saturation)?
- Any water-quality or seasonal algae-bloom issues that affect tenant satisfaction or short-term-rental demand?
- What's the average days-on-market for RENTAL listings here right now (not sales)? A rising rental-DOM trend means longer vacancies and softer asking-rent achievability than the comps imply.
- What's the recent tenant-quality profile in this submarket — average credit score on applications, eviction rate, late-payment / NSF rate, and stable-employment percentage? A property-management company in the area should have these aggregated.
- How much new for-sale + rental construction is in the pipeline within 1–3 miles? Heavy new supply typically softens prices + rents 12–24 months out; constrained supply supports both.
Investment metrics
- 1% rule
- 1.58% ✓
- Cap rate
- 12.50%
- Cash-on-cash
- 22.15%
- DSCR
- 1.99
- GRM
- 5.3
CMA / ARV
- ARV (on-the-fly)
- $141,523
- Comps found
- 8
Show comp detail 8 sales within ~0.75 mi
| Address | Dist | Beds/Ba | Sqft | Sold | Price | $/sf | Match |
|---|---|---|---|---|---|---|---|
| 112 Sawyer St | 1.25mi | 2/1.0 | 672 (0%) | 6mo | $100,000 | $149 | 60 |
| 114 Ash St | 1.48mi | 2/1.0 | 672 (0%) | 7mo | $105,000 | $156 | 59 |
| 602 Junior Lake Dr | 1.03mi | 2/1.5 | 660 (-2%) | 5mo | $38,050 | $58 | 56 |
| 104 Osborne St | 0.77mi | 2/1.0 | 680 (+1%) | 14mo | $26,500 | $39 | 51 |
| 309 Evans Ave | 1.33mi | 2/1.0 | 660 (-2%) | 15mo | $57,500 | $87 | 50 |
| 104 Allman St | 0.65mi | 2/1.0 | 720 (+7%) | 13mo | $130,000 | $181 | 47 |
| 122 Arden Ave | 1.21mi | 3/3.0 (+1) | 720 (+7%) | 6mo | $120,000 | $167 | 35 |
| 116 Guy Ave | 0.89mi | 2/1.5 | 728 (+8%) | 19mo | $126,500 | $174 | 34 |
Match score weights: distance 35% · size 25% · config 20% · recency 20%. Top-matched comps best support the ARV.
Projected returns pro-forma
-3.0% appreciation · 3.0% rent growth · sell at horizon
- IRR
- 14.9%
- Equity multiple
- 1.60×
- Total profit
- $13,246
- Equity at exit
- $11,779
- IRR
- 23.7%
- Equity multiple
- 3.04×
- Total profit
- $45,184
- Equity at exit
- $6,830
Cash invested: $22,120 (down + closing). Projections, not guarantees.
Landlord ↔ Tenant lean methodology
- Overall (STATE)
- 87 Strongly Landlord-Friendly
- State Florida
- 87 Strongly Landlord-Friendly · R+3
- County
- — inherits STATE
- City
- — inherits STATE
ZIP-level market 32148
- Home prices YoY
- -5.8%
- Active inventory
- 760
- Price-to-rent
- 5.3×
Monthly cashflow live
- Estimated rent
- $1,250 medium interval (Pro) →
- Mortgage (P&I)
- −$414
- Tax from tax record
- −$132 /mo · $1,583/yr
- Insurance
- −$33
- HOA
- −$0
- Vacancy / Maint / Mgmt
- −$262
- Net cashflow
- $408
Break-even live
Sensitivity live
| Price | -10% $453 | -5% $431 | +0% $408 | +5% $386 | +10% $364 |
|---|---|---|---|---|---|
| Rent | -10% $310 | -5% $359 | +0% $408 | +5% $458 | +10% $507 |
| Rate | -1.0pp $448 | -0.5pp $428 | base $408 | +0.5pp $388 | +1.0pp $367 |
UW: 25.0% down · 7.5% · 30yr · 1.5% tax · 5.0% vac · 8.0% maint · 8.0% mgmt
Financing live
Cash to close
- Down payment
- $19,750
- Closing costs
- $2,370
- Reserves months
- —
- Total cash needed
- —
Loan-product check · same deal, 3 products live
Conventional
25% down · 7.5% · 30yr
- Down + closing
- —
- Monthly P&I
- —
- Monthly cashflow
- —
- DSCR
- —
- Eligible?
- —
Personal DTI + credit; lowest rate.
DSCR
20% down · 8.5% · 30yr
- Down + closing
- —
- Monthly P&I
- —
- Monthly cashflow
- —
- DSCR
- —
- Eligible?
- —
No personal income docs; deal must DSCR.
Hard money
10% down · 12.0% · 12mo
- Down + closing
- —
- Monthly P&I
- —
- Monthly cashflow
- —
- DSCR
- —
- Eligible?
- —
Short-term bridge; refi at stabilization.
Rent comps 2 comps
| Address | Beds | Baths | Sqft | Rent | $/sqft | DOM | Units | Dist |
|---|---|---|---|---|---|---|---|---|
| 123 Hayman Dr Interlachen, FL | 2.0 | 1.0 | 598 | $1,250 | $2.09 | 25d | 1 | 1.38mi |
| 125 Hayman Dr Interlachen, FL | 2.0 | 1.0 | 642 | $1,250 | $1.95 | 25d | 1 | 1.39mi |
Listing history 22 events
-
2026-05-04status Pending
-
2026-04-08status Active
-
2026-02-19price $79,000
-
2026-01-20price $89,000
-
2026-01-20status Active
-
2025-09-28historical Active Under Contract
-
2025-09-12status Active
-
2025-08-28status Active
-
2025-07-15status Pending
-
2025-07-15historical
-
2025-07-15historical
-
2025-06-18price $99,000
-
2025-05-15price $109,900
-
2025-03-11price $119,900
-
2025-02-25price $124,900
-
2025-01-06price $139,900
-
2025-01-02price $149,000
-
2024-11-20$159,900 Active
-
2007-03-12historical 226-char remark
Show marketing remark (226 chars)
LAKE VIRGINIA SINGLEWIDE MOBILE HOME ON A SMALL FISHING LAKE. ELECTRIC STOVE, REFRIGERATOR, AND ROLL AROUND DISHWASHER WILL STAY. THE MOBILE HAS CATHEDRAL CEILINGS, CENTRAL ELECTRIC HEAT AND WINDOW AIR. GREAT GETAWAY PLACE.
-
2006-09-13$74,000 226-char remark
Show marketing remark (226 chars)
LAKE VIRGINIA SINGLEWIDE MOBILE HOME ON A SMALL FISHING LAKE. ELECTRIC STOVE, REFRIGERATOR, AND ROLL AROUND DISHWASHER WILL STAY. THE MOBILE HAS CATHEDRAL CEILINGS, CENTRAL ELECTRIC HEAT AND WINDOW AIR. GREAT GETAWAY PLACE.
-
1996-10-29soldstatus $17,000
-
1991-07-01soldstatus $18,000
ⓘ Source: listings_history table (triggers on properties + properties_extension) + one-shot
backfill from property_details.listing_events for pre-trigger history.
Tax reassessment forecast FL · Resets to sale price
- Current annual tax
- $1,583 · $132/mo
- Projected year-2 tax
- $1,583 · $132/mo
- Expected delta
- $0/yr ($0/mo · 0.0%)
ⓘ Screening estimate from a state-policy table — verify with the county assessor before closing.
Climate risk First Street
- Flood 1/10 Low FEMA zone X (unshaded) · 0% chance over 30 yrs
- Wildfire 5/10 Major
- Heat 8/10 Severe 6 d/yr ≥109°F today · 18 d/yr by 30 yrs out
- Wind 9/10 Extreme 99% chance of damaging wind over 30 yrs
- Air quality 2/10 Low 1 unhealthy d/yr today · 2 by 30 yrs out
Nearby sold comps map
Loading sold comps map…
Walkable amenities ~0.75 mi
Loading nearby amenities…
Taxation est. · year 1
- Rental income
- $15,000
- − Mortgage interest
- −$4,425
- − Property taxes
- −$1,583
- − Insurance
- −$395
- − Repairs & maintenance
- −$1,200
- − Management
- −$1,200
- − Depreciation
- −$2,298
- Taxable income
- $3,898
- Est. tax owed @ 24.0%
- −$936
- After-tax cash flow
- $3,965/yr
For passive investors: Depreciation is non-cash, so a rental often shows a tax loss while cash-flowing — sheltering income. Rental losses are passive: they offset passive income freely, and up to $25,000/yr can offset ordinary (W-2) income if you actively participate and your MAGI is under $100k (phasing out to $0 by $150k); unused losses carry forward. On sale, claimed depreciation is recaptured at up to 25%, and gains may owe capital-gains tax (a 1031 exchange can defer both). Figures are a year-1 estimate at your 24.0% rate — not tax advice; consult a CPA.
Schools (NCES district)
- District
- Putnam
- NCES district ID
- 1201620
- Math proficiency
- 34% ▼ -10.00%
- Reading proficiency
- 39% ▼ -4.00%
- Median HH income
- $33,350
- Composite
- 29.99/100
- National rank
- #6361
- State rank
- #66 of 73 in FL
Livability — Interlachen
- Score
- 67/100
- State rank
- #540
- US rank
- #10162
Category grades
Schools grade is shown separately in the Schools card above.
Census & demographics
- City population
- 11,580
- Population (ZIP)
- 11,580
Population outlook (Putnam County) Hauer SSP2
- Today (2025)
- 65,299 people
- By 2030
- 61,255 · -6.2%
- By 2040
- 52,930 · -18.9%
- By 2050
- 45,051 · -31.0%
- By 2075
- 28,720 · -56.0%
- By 2100
- 15,852 · -75.7%
Race, ethnicity, and origin ACS 2023
- Neighborhood character
- Predominantly White (84%)
- Race & ethnicity
- White 84% Hispanic / Latino 9% Two or more races 8% Black 3%
- Hispanic origin (detail)
- Mexican 2% Puerto Rican 7%
- Common ancestry
- Slovak 4% Lithuanian 3% Romanian 1%
- Foreign-born
- 2% · Canada
- Languages at home
- 94% English-only · Spanish 4%
Political lean MEDSL · Putnam
- 2024 margin
- Solid R (+47.8) · D 25.8% · R 73.6%
- 2008→2024 swing
- -28.5pp toward R · 2008: -19.3pp · 2024: -47.8pp
- All cycles
- 2024: R+47.8 2020: R+41.2 2016: R+36.6 2012: R+24.5 2008: R+19.3
Not yet ingested
- Civics
- —
Market trends
- HPI YoY
- ▼ -16.98%
- Current HPI
- 277.2763
- Rent YoY
- —
- Metro
- —
- State GDP YoY
- ▲ 3.28%
- F500 in state
- 36
Industry mix (Fortune 500 HQ in FL)
| Industry | F500 HQs | Revenue |
|---|---|---|
| Industrial Technology | 2 | $29B |
|
||
| Insurance | 2 | $17B |
|
||
| Retail | 1 | $60B |
|
||
| Technology Distribution | 1 | $58B |
|
||
| Homebuilding | 1 | $35B |
|
||
| Technology Manufacturing | 1 | $35B |
|
||
Price history
+338.9% since first listed22 events — show timeline
- 2026-05-04 Pending — realMLS
- 2026-04-08 Relisted — realMLS
- 2026-02-19 Price Changed $79,000 realMLS
- 2026-01-20 Price Changed $89,000 realMLS
- 2026-01-20 Relisted — realMLS
- 2025-09-28 Contingent — realMLS
- 2025-09-12 Relisted — realMLS
- 2025-08-28 Relisted — realMLS
- 2025-07-15 Pending — realMLS
- 2025-07-15 Listing Removed — realMLS
- 2025-07-15 Listing Removed — realMLS
- 2025-06-18 Price Changed $99,000 realMLS
- 2025-05-15 Price Changed $109,900 realMLS
- 2025-03-11 Price Changed $119,900 realMLS
- 2025-02-25 Price Changed $124,900 realMLS
- 2025-01-06 Price Changed $139,900 realMLS
- 2025-01-02 Price Changed $149,000 realMLS
- 2024-11-20 Listed $159,900 realMLS
- 2007-03-12 Listing Removed — realMLS
- 2006-09-13 Listed $74,000 realMLS
- 1996-10-29 Sold (Public Records) $17,000 Public Records
- 1991-07-01 Sold (Public Records) $18,000 Public Records
Property tax history
+12.8%/yrLatest (2025): $1,583 · +2.8% YoY. Source: county tax records.
Cash-flow waterfall
monthlySold comps — $/sqft
last 12 mo · ≤1 miLoading sold comps…