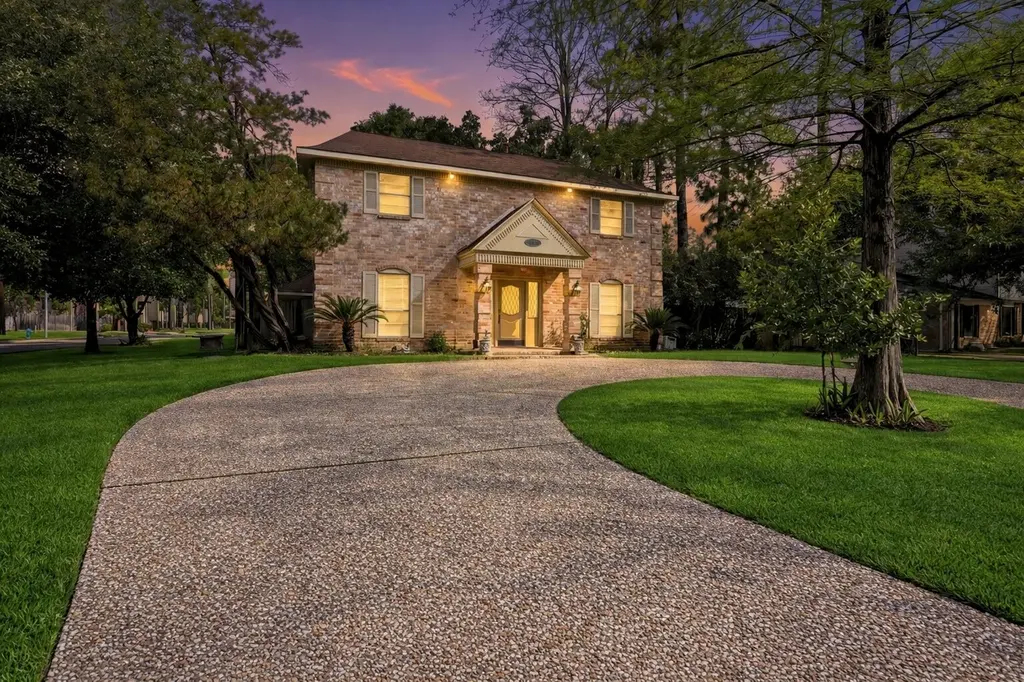
5214 Lawn Arbor Dr · Houston, TX
Flood risk 3/10 · Minor
- FEMA flood zone
- X (unshaded)
- Chance of flooding over 30 yrs
- 0.2%
- Est. flood insurance / yr
- $507 – $1,088
Fire risk 1/10 · Minimal
- Est. fire insurance / yr
- $1,222 – $2,270
Heat risk 9/10 · Severe
- Hot days now (above 110°F)
- 7 days/yr
- Hot days in 30 yrs
- 22 days/yr
Wind risk 8/10 · Major
- Chance of severe wind over 30 yrs
- 99.0%
Air-quality risk 3/10 · Minor
- Unhealthy air days now
- 3 days/yr
- Unhealthy air days in 30 yrs
- 3 days/yr
Risk factors via First Street. Map © Google.
Why this score? — see what drove the D grade
The composite is a weighted blend of 9 inputs, each scored 0–100. Each bar is that input's sub-score; the figure is the points it added to the 100-point composite (weight × sub-score).
- ARV discount +12.3/15.0
- Cash flow +7.7/30.0
- Appreciation +4.5/10.0
- Schools +4.1/10.0
- Livability +3.7/5.0
- 1% rule +3.2/10.0
- Condition / age +2.5/5.0
- DSCR +1.8/10.0
- Rent growth +1.3/5.0
$255,000
🖨 Deal sheet (PDF) 📄 Offer letter ✓ Due diligence
Listing remarks MLS
REDUCED/EXCELLENT VALUE. QUARTERS (NOT COUNTED IN SQUARE FOOTAGE) IN CONVERTED 3 CAR GARAGE SPACE,KITCHEN,BEDROOM,BATH, LIVING AREA/1 CAR GARAGE SPACE NOT PART OF QUARTERS/AREA COULD BE CONVERTED BACK TO 3 CAR GARAGE. CORNER LOT/HOUSE HAS BEEN UPGRADED/IS IN BEAUTIFUL CONDITION. CLEAN, READY TO MOVE INTO. NEIGHBORHOOD HAS 12 YEARS OF KLEIN SCHOOLS IN SUBDIVISION/CLOSE WALKING DISTANCE TO BANKS,RESTAURANTS,GROCERY STORE,GYM,ALL KINDS OF SHOPPING.
Key facts
- 9,361 sq ft lot
- Garage
- Community pool
Property features AI
Finance
- HOA & community: Part of Greenwood Forest association; Community amenities include clubhouse, pool, and tennis courts; Association fee $695 annually (covers common areas); Community features include pool, curbs, and gutters
Exterior
- Parking: Detached garage; Additional parking; Driveway
- Security: Owned security system; Smoke detectors
- Utilities: Public water; Public sewer
- Home design: Residential property; Faces south
- Construction: Brick construction; Composition roof; Slab foundation; Built in 1973
- Exterior features: Deck; Patio; Porch; Fenced backyard; Private yard; Paved driveway; Garage apartment; Corner lot with side yard; Cleared lot
Interior
- Kitchen: Double oven; Dishwasher; Electric cooktop; Electric oven; Garbage disposal; Microwave; Refrigerator
- Bedrooms: Primary bedroom (Second floor) — 13 x 16; Bedroom (Second floor) — 14 x 13; Bedroom (Second floor) — 12 x 12; Bedroom (Second floor) — 11 x 13; Office (First floor) — 13 x 13; Living room (First floor) — 18 x 17; Dining room (First floor) — 13 x 11
- Flooring: Vinyl
- Bathrooms: 2 full bathrooms; 1 half bathroom
- Heating & cooling: Central heating (gas); Central electric air conditioning
- Interior features: Gas fireplace; Intercom; Laminate counters; Pantry; Tub with shower; Ceiling fans
- Laundry & utility: Washer hookup; Electric dryer hookup; Gas dryer hookup
Neighborhood map
What this means for you Summary
Snapshot
- This is a 4-bed/2.5-bath single-family listed at $255k.
Deal economics
- At list price, monthly cash flow is $-290 ($-3k/yr) — negative.
- To cash-flow at today's rent, offer at most $204k (20.1% below list).
- To meet the 1% rule (rent ≥ 1% of price), the offer needs to be $209k (18.0% below list).
- Recommended offer: $204k (20.1% below list) — sets the bar for cash-flow.
- Cap rate 4.9% vs local median 3.2% in Houston — top-decile yield for the area; either an underpriced asset or a hidden risk that comps aren't pricing in. Stress-test before assuming the spread holds.
Location & tenants
- Location reads 74/100 on livability (#184 in TX, #4,771 nationally) — a middle-class / working-renter tenant base. Strengths: amenities A+, cost of living A+, housing A+; Watch: crime F.
- Klein ISD (suburban): math 41% / reading 48% proficiency, ranked #213 of 826 in TX (top 26%) — families likely to look elsewhere, expect single-tenant / working-renter base with shorter leases.
- Zoned schools: Greenwood Forest El (math 30% / reading 34%, grade F, #2,268 of 4,322 statewide, top 55%, 672 students, 75% FRL); Wunderlich Int (math 24% / reading 34%, grade F, #1,103 of 1,662 statewide, top 67%, 1,316 students, 77% FRL); Klein Forest H S (math 20% / reading 28%, grade F, #1,333 of 1,632 statewide, top 82%, 3,481 students, 79% FRL) — zoned schools average 77% FRL vs 37% district-wide (40 pts higher); higher-poverty schools than district average — tighter screening recommended.
- Zoned-school proficiency averages 28% at this address vs 44% district-wide (-16 pts) — the specific schools serving this property underperform the Klein ISD average; the district grade overstates school quality for this exact location.
- Market conditions: Rents falling (-4.7%/yr); 164 active listings in the ZIP; 5 comparable units currently listed for rent nearby; rentals lingering (median 45d on market — plan ~5-8 weeks vacancy on turnover, expect pricing pressure); 60% of comp listings sitting > 30 days — soft ceiling on asking rent; solid renter incomes; 29,883 units permitted in Harris County in 2024 (8,621 in 5+ unit buildings).
Forward outlook
- Local home prices are declining (-1.0%/yr); year-one equity from $2k of loan paydown is wiped out by about $3k of value loss. Plan a longer hold.
- Harris County population projected at +47% by 2050 — long-run rental-demand tailwind backs the buy-and-hold thesis.
Negotiation context
- It's been on market 50 days — a 3% lower offer ($247k) is reasonable based on typical stale-listing flexibility.
- 8 sale attempts since 19y ago; this cycle's ask has dropped $15k (6%) from the opening price — seller is motivated, your offer sets the floor, not the list.
Risks & watch-outs
- Climate carrying-cost: severe wind risk, 99% chance of damaging wind over 30y; extreme-heat days projected 7→22/yr by 2055 (HVAC capex compounding) — expect insurance premiums to compound above CPI over the hold.
Questions for the listing agent
- What do current leases actually rent for vs. the listed asking? Can we see a recent rent roll and the last 12 months of T-12 income?
- It's been on market 50 days. Have you received any prior offers? Is the seller open to a 20% concession, seller financing, or rate buy-down credit?
- Built in 1973 — when were the roof, HVAC, electrical panel, plumbing, and water heater last replaced?
- What does the HOA fee cover, when was the last increase, and are there any pending special assessments or reserve-fund shortfalls?
- Is there a deadline driving the sale (1031 exchange, divorce, estate, relocation)? That informs how much negotiation room exists.
- Schools are D-rated, which usually means shorter tenancies and higher turnover. Who's the typical renter profile here, and what's been the actual vacancy rate?
- Crime grade is F in this area — have there been break-ins, vandalism, or insurance claims at this property in the last 3 years? What carrier currently insures it and at what premium?
- The area grade is low — what's the realistic commute time and amenity access for the typical tenant pool here? Any planned neighborhood developments (good or bad) we should know about?
- What's the average days-on-market for RENTAL listings here right now (not sales)? A rising rental-DOM trend means longer vacancies and softer asking-rent achievability than the comps imply.
- What's the recent tenant-quality profile in this submarket — average credit score on applications, eviction rate, late-payment / NSF rate, and stable-employment percentage? A property-management company in the area should have these aggregated.
- How much new for-sale + rental construction is in the pipeline within 1–3 miles? Heavy new supply typically softens prices + rents 12–24 months out; constrained supply supports both.
Investment metrics
- 1% rule
- 0.82% ✗
- Cap rate
- 4.93%
- Cash-on-cash
- -4.88%
- DSCR
- 0.78
- GRM
- 10.2
CMA / ARV
- ARV (median comp)
- $285,785
- List price
- $255,000
- Delta
- -10.77%
- Verdict
- UNDERPRICED
- Comps
- 20 within 1.0 mi
Show comp detail 12 sales within ~0.75 mi
| Address | Dist | Beds/Ba | Sqft | Sold | Price | $/sf | Match |
|---|---|---|---|---|---|---|---|
| 5339 Dana Leigh Dr | 0.20mi | 4/2.5 | 2,604 (+7%) | 2mo | $374,900 | $144 | 78 |
| 105 Old Bridge Lk | 0.47mi | 3/2.5 (-1) | 2,622 (+7%) | 1mo | $269,900 | $103 | 60 |
| 14041 Cashel Forest Dr | 0.41mi | 3/2.5 (-1) | 2,222 (-9%) | 3mo | $225,000 | $101 | 59 |
| 4714 Cashel Castle Dr | 0.66mi | 3/2.5 (-1) | 2,362 (-3%) | 1mo | $249,900 | $106 | 58 |
| 4731 N Cashel Cir | 0.49mi | 3/2.5 (-1) | 2,222 (-9%) | 1mo | $249,000 | $112 | 57 |
| 14205 Cashel Forest Dr | 0.51mi | 3/3.0 (-1) | 2,268 (-7%) | 2mo | $299,900 | $132 | 55 |
| 4726 Cashel Castle Dr | 0.65mi | 4/3.0 | 2,250 (-8%) | 1mo | $135,200 | $60 | 54 |
| 5111 Olympia Fields Ln | 0.45mi | 4/3.0 | 2,801 (+15%) | 2mo | $373,500 | $133 | 51 |
| 4903 Charade Dr | 0.44mi | 4/2.0 | 2,075 (-15%) | 2mo | $287,000 | $138 | 51 |
| 5323 Olympia Fields Ln | 0.55mi | 4/2.5 | 2,806 (+15%) | 0mo | $399,999 | $143 | 49 |
| 5614 Spanish Oak Dr | 0.71mi | 4/2.5 | 2,731 (+12%) | 1mo | $335,000 | $123 | 46 |
| 202 Old Bridge Lk | 0.73mi | 3/2.5 (-1) | 2,619 (+7%) | 3mo | $299,990 | $115 | 46 |
Match score weights: distance 35% · size 25% · config 20% · recency 20%. Top-matched comps best support the ARV.
Projected returns pro-forma
-1.02% appreciation · 0.0% rent growth · sell at horizon
- IRR
- -14.7%
- Equity multiple
- 0.38×
- Total profit
- $-43,917
- Equity at exit
- $61,294
- IRR
- -11.1%
- Equity multiple
- 0.09×
- Total profit
- $-64,629
- Equity at exit
- $64,143
Cash invested: $71,400 (down + closing). Projections, not guarantees.
Landlord ↔ Tenant lean methodology
- Overall (STATE)
- 87 Strongly Landlord-Friendly
- State Texas
- 87 Strongly Landlord-Friendly · R+5
- County
- — inherits STATE
- City
- — inherits STATE
ZIP-level market 77066
- Home prices YoY
- -0.4%
- Rents YoY
- -4.7%
- Active inventory
- 164
- Price-to-rent
- 10.2×
Monthly cashflow live
- Estimated rent
- $2,090 medium interval (Pro) →
- Mortgage (P&I)
- −$1,337
- Tax from tax record
- −$440 /mo · $5,282/yr
- Insurance
- −$106
- HOA
- −$58
- Vacancy / Maint / Mgmt
- −$439
- Net cashflow
- $-290
Break-even live
Sensitivity live
| Price | -10% $-146 | -5% $-218 | +0% $-290 | +5% $-362 | +10% $-435 |
|---|---|---|---|---|---|
| Rent | -10% $-455 | -5% $-373 | +0% $-290 | +5% $-208 | +10% $-125 |
| Rate | -1.0pp $-162 | -0.5pp $-225 | base $-290 | +0.5pp $-356 | +1.0pp $-424 |
UW: 25.0% down · 7.5% · 30yr · 1.5% tax · 5.0% vac · 8.0% maint · 8.0% mgmt
Financing live
Cash to close
- Down payment
- $63,750
- Closing costs
- $7,650
- Reserves months
- —
- Total cash needed
- —
Loan-product check · same deal, 3 products live
Conventional
25% down · 7.5% · 30yr
- Down + closing
- —
- Monthly P&I
- —
- Monthly cashflow
- —
- DSCR
- —
- Eligible?
- —
Personal DTI + credit; lowest rate.
DSCR
20% down · 8.5% · 30yr
- Down + closing
- —
- Monthly P&I
- —
- Monthly cashflow
- —
- DSCR
- —
- Eligible?
- —
No personal income docs; deal must DSCR.
Hard money
10% down · 12.0% · 12mo
- Down + closing
- —
- Monthly P&I
- —
- Monthly cashflow
- —
- DSCR
- —
- Eligible?
- —
Short-term bridge; refi at stabilization.
Rent comps 5 comps
| Address | Beds | Baths | Sqft | Rent | $/sqft | DOM | Units | Dist |
|---|---|---|---|---|---|---|---|---|
| 4703 Cashel Cir Unit A Houston, TX | 3.0 | 2.5 | 1722 | $1,950 | $1.13 | 20d | 1 | 0.48mi |
| 4622 Falling Sun Dr Houston, TX | 4.0 | 3.0 | 2485 | $2,500 | $1.01 | 45d | 1 | 0.97mi |
| 4202 Brandemere Way St Houston, TX | 3.0 | 2.0 | 1586 | $1,695 | $1.07 | 45d | 1 | 1.12mi |
| 4807 Wellington Way Houston, TX | 3.0 | 2.5 | 2876 | $2,500 | $0.87 | 45d | 1 | 1.15mi |
| 5135 Westerham Pl Unit 1262307P Houston, TX | 5.0 | 3.5 | 3358 | $17,582 | $5.24 | 23d | 1 | 1.16mi |
HOA detail
- Monthly dues
- $58 · $696/yr
- Likely covers
- gym
Listing history 28 events
-
2026-06-17status $255,000 Pending 50 DOM
-
2026-06-16days on market $255,000 Active 50 DOM
-
2026-06-15days on market $255,000 Active 49 DOM
-
2026-06-13days on market $255,000 Active 47 DOM
-
2026-06-09days on market $255,000 Active 43 DOM
-
2026-06-08days on market $255,000 Active 42 DOM
-
2026-06-07pricedays on market $255,000 Active 41 DOM
-
2026-06-04statusdays on market $270,000 Active 38 DOM
-
2026-06-01days on market $270,000 Pending 37 DOM
-
2026-05-31days on market $270,000 Pending 36 DOM
-
2026-04-25$270,000 Active 858-char remark
-
2025-12-14historical
-
2025-08-20status Active
-
2025-08-14status Pending
-
2025-08-04status Active
-
2025-08-03historical Active Under Contract
-
2025-07-29status Pending
-
2025-06-02$275,000 Active
-
2010-03-04soldstatus
-
2010-02-02soldstatus
Show marketing remark (449 chars)
REDUCED/EXCELLENT VALUE. QUARTERS (NOT COUNTED IN SQUARE FOOTAGE) IN CONVERTED 3 CAR GARAGE SPACE,KITCHEN,BEDROOM,BATH, LIVING AREA/1 CAR GARAGE SPACE NOT PART OF QUARTERS/AREA COULD BE CONVERTED BACK TO 3 CAR GARAGE. CORNER LOT/HOUSE HAS BEEN UPGRADED/IS IN BEAUTIFUL CONDITION. CLEAN, READY TO MOVE INTO. NEIGHBORHOOD HAS 12 YEARS OF KLEIN SCHOOLS IN SUBDIVISION/CLOSE WALKING DISTANCE TO BANKS,RESTAURANTS,GROCERY STORE,GYM,ALL KINDS OF SHOPPING.
-
2010-02-01historical
Show marketing remark (449 chars)
REDUCED/EXCELLENT VALUE. QUARTERS (NOT COUNTED IN SQUARE FOOTAGE) IN CONVERTED 3 CAR GARAGE SPACE,KITCHEN,BEDROOM,BATH, LIVING AREA/1 CAR GARAGE SPACE NOT PART OF QUARTERS/AREA COULD BE CONVERTED BACK TO 3 CAR GARAGE. CORNER LOT/HOUSE HAS BEEN UPGRADED/IS IN BEAUTIFUL CONDITION. CLEAN, READY TO MOVE INTO. NEIGHBORHOOD HAS 12 YEARS OF KLEIN SCHOOLS IN SUBDIVISION/CLOSE WALKING DISTANCE TO BANKS,RESTAURANTS,GROCERY STORE,GYM,ALL KINDS OF SHOPPING.
-
2009-11-04$125,500
Show marketing remark (449 chars)
REDUCED/EXCELLENT VALUE. QUARTERS (NOT COUNTED IN SQUARE FOOTAGE) IN CONVERTED 3 CAR GARAGE SPACE,KITCHEN,BEDROOM,BATH, LIVING AREA/1 CAR GARAGE SPACE NOT PART OF QUARTERS/AREA COULD BE CONVERTED BACK TO 3 CAR GARAGE. CORNER LOT/HOUSE HAS BEEN UPGRADED/IS IN BEAUTIFUL CONDITION. CLEAN, READY TO MOVE INTO. NEIGHBORHOOD HAS 12 YEARS OF KLEIN SCHOOLS IN SUBDIVISION/CLOSE WALKING DISTANCE TO BANKS,RESTAURANTS,GROCERY STORE,GYM,ALL KINDS OF SHOPPING.
-
2009-11-03historical
-
2009-09-23$147,500
-
2007-12-19historical
-
2007-08-14$149,900
-
2001-05-22soldstatus
-
1999-07-21soldstatus
ⓘ Source: listings_history table (triggers on properties + properties_extension) + one-shot
backfill from property_details.listing_events for pre-trigger history.
Tax reassessment forecast TX · Resets to sale price
- Current annual tax
- $5,282 · $440/mo
- Projected year-2 tax
- $5,282 · $440/mo
- Expected delta
- $0/yr ($0/mo · 0.0%)
ⓘ Screening estimate from a state-policy table — verify with the county assessor before closing.
Climate risk First Street
- Flood 3/10 Moderate FEMA zone X (unshaded) · 20% chance over 30 yrs
- Wildfire 1/10 Low
- Heat 9/10 Extreme 7 d/yr ≥110°F today · 22 d/yr by 30 yrs out
- Wind 8/10 Severe 99% chance of damaging wind over 30 yrs
- Air quality 3/10 Moderate 3 unhealthy d/yr today · 3 by 30 yrs out
Nearby sold comps map
Loading sold comps map…
Walkable amenities ~0.75 mi
Loading nearby amenities…
Taxation est. · year 1
- Rental income
- $25,084
- − Mortgage interest
- −$14,284
- − Property taxes
- −$5,282
- − Insurance
- −$1,275
- − Repairs & maintenance
- −$2,007
- − Management
- −$2,007
- − HOA
- −$696
- − Depreciation
- −$7,418
- Taxable loss
- −$7,884
- Est. tax savings @ 24.0%
- +$1,892
- After-tax cash flow
- $-1,591/yr
For passive investors: Depreciation is non-cash, so a rental often shows a tax loss while cash-flowing — sheltering income. Rental losses are passive: they offset passive income freely, and up to $25,000/yr can offset ordinary (W-2) income if you actively participate and your MAGI is under $100k (phasing out to $0 by $150k); unused losses carry forward. On sale, claimed depreciation is recaptured at up to 25%, and gains may owe capital-gains tax (a 1031 exchange can defer both). Figures are a year-1 estimate at your 24.0% rate — not tax advice; consult a CPA.
Schools (NCES district)
- District
- Klein ISD
- NCES district ID
- 4825740
- Math proficiency
- 41% ▼ -12.00%
- Reading proficiency
- 48% ▼ -3.00%
- Median HH income
- $78,288
- Composite
- 40.91/100
- National rank
- #3615
- State rank
- #213 of 826 in TX
Livability — Houston
- Score
- 74/100
- State rank
- #184
- US rank
- #4771
Category grades
Schools grade is shown separately in the Schools card above.
Census & demographics
- County
- Harris County · 4,702,590 people
- City population
- 3,226,434
- Metro
- Houston-The Woodlands-Sugar Land, TX
- Population (ZIP)
- 39,311
- Household income
- $87,138
- Rent vs Own
- Severe rent burden
- 815.0
Population outlook (Harris County) Hauer SSP2
- Today (2025)
- 5,571,493 people
- By 2030
- 6,089,821 · +9.3%
- By 2040
- 7,142,806 · +28.2%
- By 2050
- 8,185,864 · +46.9%
- By 2075
- 10,574,329 · +89.8%
- By 2100
- 12,109,958 · +117.4%
Race, ethnicity, and origin ACS 2023
- Neighborhood character
- Diverse neighborhood (Simpson 0.69)
- Race & ethnicity
- Hispanic / Latino 47% Black 23% Two or more races 21% Asian 15% White 13%
- Hispanic origin (detail)
- Mexican 32%
- Common ancestry
- Romanian 1%
- Foreign-born
- 31% · Canada, Vietnam, Jamaica
- Languages at home
- 49% English-only · Spanish 36% Vietnamese 8% Other Asian/Pacific 2%
Political lean MEDSL · Harris
- 2024 margin
- Lean D (+5.5) · D 52.0% · R 46.4% · Other 1.6%
- 2008→2024 swing
- +3.9pp toward D · 2008: 1.6pp · 2024: 5.5pp
- All cycles
- 2024: D+5.5 2020: D+13.3 2016: D+12.4 2012: D+0.1 2008: D+1.6
Not yet ingested
- Civics
- —
Market trends
- HPI YoY
- ▼ -1.02%
- Current HPI
- 261.1086
- Rent YoY
- ▼ -4.69%
- Metro
- Houston-The Woodlands-Sugar Land, TX
- State GDP YoY
- ▲ 3.95%
- F500 in state
- 110
Industry mix (Fortune 500 HQ in TX)
| Industry | F500 HQs | Revenue |
|---|---|---|
| Energy | 16 | $1,198B |
|
||
| Technology | 5 | $198B |
|
||
| Engineering / Construction | 4 | $72B |
|
||
| Energy Services | 3 | $60B |
|
||
| Utilities | 3 | $41B |
|
||
| Healthcare | 2 | $330B |
|
||
Price history
+70.1% since first listed23 events — show timeline
- 2026-06-16 Pending — HARMLS
- 2026-06-04 Price Changed $255,000 HARMLS
- 2026-06-03 Relisted — HARMLS
- 2026-06-02 Pending — HARMLS
- 2026-05-28 Pending — HARMLS
- 2026-04-25 Listed $270,000 HARMLS
- 2025-12-14 Listing Removed — HARMLS
- 2025-08-20 Relisted — HARMLS
- 2025-08-14 Pending — HARMLS
- 2025-08-04 Relisted — HARMLS
- 2025-08-03 Contingent — HARMLS
- 2025-07-29 Pending — HARMLS
- 2025-06-02 Listed $275,000 HARMLS
- 2010-03-04 Sold (Public Records) — Public Records
- 2010-02-02 Sold (MLS) — HARMLS
- 2010-02-01 Listing Removed — HARMLS
- 2009-11-04 Listed $125,500 HARMLS
- 2009-11-03 Listing Removed — HARMLS
- 2009-09-23 Listed $147,500 HARMLS
- 2007-12-19 Listing Removed — HARMLS
- 2007-08-14 Listed $149,900 HARMLS
- 2001-05-22 Sold (Public Records) — Public Records
- 1999-07-21 Sold (Public Records) — Public Records
Property tax history
+3.8%/yrLatest (2025): $5,282 · +0.1% YoY. Source: county tax records.
Cash-flow waterfall
monthlySold comps — $/sqft
last 12 mo · ≤1 miLoading sold comps…