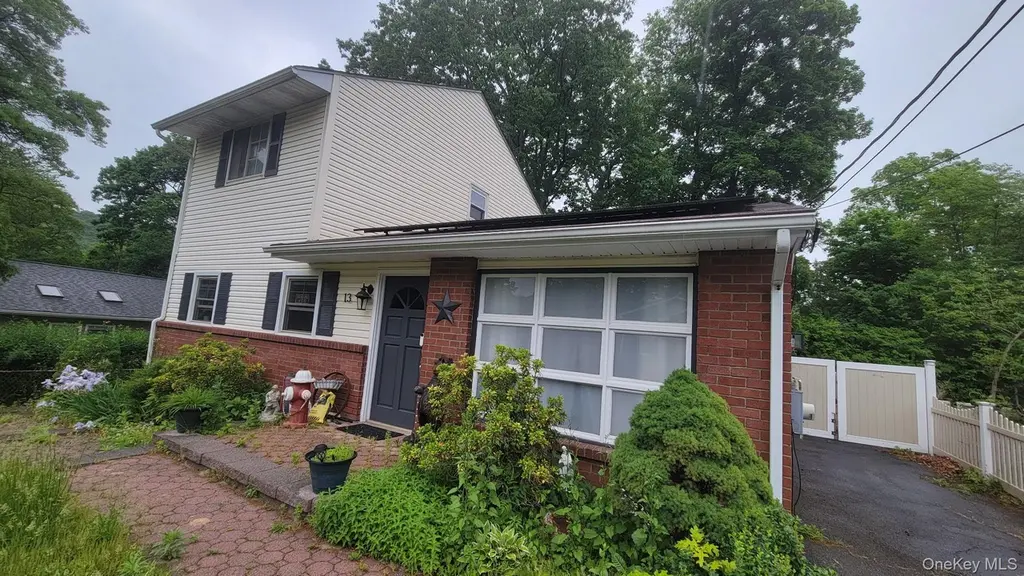
13 Murphy Rd · Fort Montgomery, NY
Flood risk 1/10 · Minimal
- FEMA flood zone
- X (unshaded)
- Chance of flooding over 30 yrs
- 0.0%
- Est. flood insurance / yr
- $473 – $860
Fire risk 5/10 · Moderate
- Est. fire insurance / yr
- $691 – $1,283
Heat risk 5/10 · Moderate
- Hot days now (above 100°F)
- 7 days/yr
- Hot days in 30 yrs
- 17 days/yr
Wind risk 4/10 · Minor
- Chance of severe wind over 30 yrs
- 16.0%
Air-quality risk 3/10 · Minor
- Unhealthy air days now
- 2 days/yr
- Unhealthy air days in 30 yrs
- 3 days/yr
Risk factors via First Street. Map © Google.
Why this score? — see what drove the D+ grade
The composite is a weighted blend of 9 inputs, each scored 0–100. Each bar is that input's sub-score; the figure is the points it added to the 100-point composite (weight × sub-score).
- ARV discount +11.9/15.0
- Cash flow +9.7/30.0
- Schools +4.6/10.0
- Appreciation +4.5/10.0
- 1% rule +3.6/10.0
- Livability +3.4/5.0
- DSCR +2.8/10.0
- Rent growth +2.5/5.0
- Condition / age +2.5/5.0
$429,000
🖨 Deal sheet 📄 Offer letter ✓ Due diligence
Listing remarks
Nestled on a quiet cul-de-sac in the desirable community of Fort Montgomery, this charming Colonial offers the perfect blend of comfort, convenience, and outdoor recreation. Featuring 4 bedrooms and 2 full bathrooms, this single-family home provides a spacious and functional layout for everyday living. The home includes a partially finished basement, offering additional living space ideal for a family room, home office, gym, or recreation area. Enjoy the tranquility of a lake-area setting while remaining just minutes from major commuting routes, including Route 9W and the Palisades Interstate Parkway. Outdoor enthusiasts will appreciate the property's proximity to some of the Hudson Valley'
Key facts
- Cul-de-sac
- Lake-area setting
- 5,413 sq ft lot
Tags
Property features AI
Exterior
- Parking: Driveway with space for 3 vehicles; No carport
- Utilities: Public sewer; Electricity connected
- Home design: Single family residence; Two levels
- Construction: Brick construction (year built not provided)
- Exterior features: Brick construction; Not waterfront
Interior
- Kitchen: Dishwasher; Gas range; Refrigerator
- Bedrooms: Two-level home (bedroom level information not specified)
- Flooring: Carpet; Wood
- Bathrooms: 2 full bathrooms
- Heating & cooling: Propane heating; Central air conditioning
- Interior features: First-floor full bathroom; Wood window frames; Partial basement; Library/den
- Laundry & utility: Washer hookup; Electric dryer hookup; Laundry in basement
Neighborhood map
What this means for you Summary
Snapshot
- This is a 3-bed/1.0-bath single-family listed at $429k.
Deal economics
- At list price, monthly cash flow is $-279 ($-3k/yr) — negative.
- To cash-flow at today's rent, offer at most $380k (11.5% below list).
- To meet the 1% rule (rent ≥ 1% of price), the offer needs to be $368k (14.3% below list).
- Recommended offer: $368k (14.3% below list) — sets the bar for 1% rule.
Location & tenants
- Location reads 68/100 on livability (#531 in NY) — a middle-class / working-renter tenant base. Strengths: crime A+, employment A+, housing A+; Watch: cost of living D, amenities F, commute F.
- Highland Falls Central School District (rural): math 53% / reading 47% proficiency, ranked #328 of 590 in NY (top 56%) — acceptable for families but not a draw, mixed tenant base, ~2y average lease.
- Zoned schools: Fort Montgomery Elementary School (201 students, 52% FRL); Highland Falls Intermediate School (math 32% / reading 47%, grade F, #418 of 729 statewide, top 59%, 324 students, 56% FRL); James I O'Neill High School (math 87% / reading 70%, grade A-, #568 of 1,100 statewide, top 52%, 424 students, 30% FRL).
- Market conditions: 9 active listings in the ZIP; 4 comparable units currently listed for rent nearby; rentals leasing fast (median 14d on market — plan ~1-2 weeks tenant-placement turnaround); 1,746 units permitted in Orange County in 2024 (1,265 in 5+ unit buildings).
Forward outlook
- Local home prices are declining (-1.1%/yr); year-one equity from $3k of loan paydown is wiped out by about $5k of value loss. Plan a longer hold.
Negotiation context
- Only 6 days on market — expect competitive offers; lowballing is unlikely to land.
- Current owner paid $147k; list at $429k implies a 192% gain — meaningful room to come down on a strong offer.
Risks & watch-outs
- Climate carrying-cost: moderate wildfire risk; extreme-heat days projected 7→17/yr by 2055 (HVAC capex compounding) — expect insurance premiums to compound above CPI over the hold.
Questions for the listing agent
- What do current leases actually rent for vs. the listed asking? Can we see a recent rent roll and the last 12 months of T-12 income?
- Built in 1966 — when were the roof, HVAC, electrical panel, plumbing, and water heater last replaced?
- Is there a deadline driving the sale (1031 exchange, divorce, estate, relocation)? That informs how much negotiation room exists.
- Schools are A-rated — typically a magnet for longer-tenancy family renters. What's the average tenant stay here, and is there a school-zone premium baked into asking?
- The area grade is low — what's the realistic commute time and amenity access for the typical tenant pool here? Any planned neighborhood developments (good or bad) we should know about?
- What's the average days-on-market for RENTAL listings here right now (not sales)? A rising rental-DOM trend means longer vacancies and softer asking-rent achievability than the comps imply.
- What's the recent tenant-quality profile in this submarket — average credit score on applications, eviction rate, late-payment / NSF rate, and stable-employment percentage? A property-management company in the area should have these aggregated.
- How much new for-sale + rental construction is in the pipeline within 1–3 miles? Heavy new supply typically softens prices + rents 12–24 months out; constrained supply supports both.
Investment metrics
- 1% rule
- 0.86% ✗
- Cap rate
- 5.51%
- Cash-on-cash
- -2.79%
- DSCR
- 0.88
- GRM
- 9.7
CMA / ARV
- ARV (on-the-fly)
- $475,524
- Comps found
- 3
Show comp detail 3 sales within ~0.75 mi
| Address | Dist | Beds/Ba | Sqft | Sold | Price | $/sf | Match |
|---|---|---|---|---|---|---|---|
| 4 Grove Pl | 0.13mi | 3/1.0 | 1,343 (-14%) | 9mo | $400,000 | $298 | 64 |
| 11 Drew Rd | 0.14mi | 4/2.0 (+1) | 1,519 (-2%) | 23mo | $465,000 | $306 | 62 |
| 30 Hudson River Ln | 0.49mi | 2/2.0 (-1) | 1,476 (-5%) | 20mo | $899,000 | $609 | 44 |
Match score weights: distance 35% · size 25% · config 20% · recency 20%. Top-matched comps best support the ARV.
Projected returns pro-forma
-1.08% appreciation · 3.0% rent growth · sell at horizon
- IRR
- -10.0%
- Equity multiple
- 0.57×
- Total profit
- $-51,384
- Equity at exit
- $101,978
- IRR
- -3.1%
- Equity multiple
- 0.72×
- Total profit
- $-33,458
- Equity at exit
- $105,745
Cash invested: $120,120 (down + closing). Projections, not guarantees.
Landlord ↔ Tenant lean methodology
- Overall (STATE)
- 15 Strongly Tenant-Friendly
- State New York
- 15 Strongly Tenant-Friendly · D+10
- County
- — inherits STATE
- City
- — inherits STATE
ZIP-level market 10922
- Home prices YoY
- -0.4%
- Active inventory
- 9
- Price-to-rent
- 9.7×
Monthly cashflow live
- Estimated rent
- $3,677 medium interval (Pro) →
- Mortgage (P&I)
- −$2,250
- Tax from tax record
- −$756 /mo · $9,071/yr
- Insurance
- −$179
- HOA
- −$0
- Vacancy / Maint / Mgmt
- −$772
- Net cashflow
- $-279
Break-even live
UW: 25.0% down · 7.5% · 30yr · 1.5% tax · 5.0% vac · 8.0% maint · 8.0% mgmt
Financing live
Cash to close
- Down payment
- $107,250
- Closing costs
- $12,870
- Reserves months
- —
- Total cash needed
- —
Loan-product check · same deal, 3 products live
Conventional
25% down · 7.5% · 30yr
- Down + closing
- —
- Monthly P&I
- —
- Monthly cashflow
- —
- DSCR
- —
- Eligible?
- —
Personal DTI + credit; lowest rate.
DSCR
20% down · 8.5% · 30yr
- Down + closing
- —
- Monthly P&I
- —
- Monthly cashflow
- —
- DSCR
- —
- Eligible?
- —
No personal income docs; deal must DSCR.
Hard money
10% down · 12.0% · 12mo
- Down + closing
- —
- Monthly P&I
- —
- Monthly cashflow
- —
- DSCR
- —
- Eligible?
- —
Short-term bridge; refi at stabilization.
Rent comps 4 comps
| Address | Beds | Baths | Sqft | Rent | $/sqft | DOM | Units | Dist |
|---|---|---|---|---|---|---|---|---|
| 4 Montgomery Rd Unit 1 Highland Falls, NY | 2.0 | 1.0 | 1100 | $2,300 | $2.09 | 4d | 1 | 0.24mi |
| 4 St Marks Pl Fort Montgomery, NY | 3.0 | 2.5 | 1532 | $2,950 | $1.93 | 44d | 1 | 0.43mi |
| 12 Hudson River Ln Garrison, NY | 3.0 | 2.5 | 1881 | $7,500 | $3.99 | 13d | 1 | 0.51mi |
| 137 Canterbury Rd Fort Montgomery, NY | 2.0 | 2.0 | 1400 | $3,250 | $2.32 | 13d | 1 | 0.78mi |
Listing history 6 events
-
2026-06-18days on market $429,000 Active 6 DOM
-
2026-06-17days on market $429,000 Active 5 DOM
-
2026-06-16days on market $429,000 Active 4 DOM
-
2026-06-15days on market $429,000 Active 3 DOM
-
2026-06-14remarks 699-char remark
-
2026-06-14$429,000 Active 1 DOM
ⓘ Source: listings_history table (triggers on properties + properties_extension) + one-shot
backfill from property_details.listing_events for pre-trigger history.
Tax reassessment forecast NY · Partial reset (capped growth)
- Current annual tax
- $9,071 · $756/mo
- Projected year-2 tax
- $9,071 · $756/mo
- Expected delta
- $0/yr ($0/mo · 0.0%)
ⓘ Screening estimate from a state-policy table — verify with the county assessor before closing.
Climate risk First Street
- Flood 1/10 Low FEMA zone X (unshaded) · 0% chance over 30 yrs
- Wildfire 5/10 Major
- Heat 5/10 Major 7 d/yr ≥100°F today · 17 d/yr by 30 yrs out
- Wind 4/10 Moderate 16% chance of damaging wind over 30 yrs
- Air quality 3/10 Moderate 2 unhealthy d/yr today · 3 by 30 yrs out
Nearby sold comps map
Loading sold comps map…
Walkable amenities ~0.75 mi
Loading nearby amenities…
Taxation est. · year 1
- Rental income
- $44,128
- − Mortgage interest
- −$24,031
- − Property taxes
- −$9,071
- − Insurance
- −$2,145
- − Repairs & maintenance
- −$3,530
- − Management
- −$3,530
- − Depreciation
- −$12,480
- Taxable loss
- −$10,659
- Est. tax savings @ 24.0%
- +$2,558
- After-tax cash flow
- $-794/yr
For passive investors: Depreciation is non-cash, so a rental often shows a tax loss while cash-flowing — sheltering income. Rental losses are passive: they offset passive income freely, and up to $25,000/yr can offset ordinary (W-2) income if you actively participate and your MAGI is under $100k (phasing out to $0 by $150k); unused losses carry forward. On sale, claimed depreciation is recaptured at up to 25%, and gains may owe capital-gains tax (a 1031 exchange can defer both). Figures are a year-1 estimate at your 24.0% rate — not tax advice; consult a CPA.
Schools (NCES district)
- District
- Highland Falls Central School District
- NCES district ID
- 3614430
- Math proficiency
- 53% ▼ -2.00%
- Reading proficiency
- 47% ▼ -6.00%
- Median HH income
- $79,944
- Composite
- 45.68/100
- National rank
- #2577
- State rank
- #328 of 590 in NY
Livability — Fort Montgomery
- Score
- 68/100
- State rank
- #531
- US rank
- #9569
Category grades
Schools grade is shown separately in the Schools card above.
Census & demographics
- Census place
- Fort Montgomery, NY
- Population (ZIP)
- 1,072
Population outlook (Orange County) Hauer SSP2
- Today (2025)
- 379,830 people
- By 2030
- 378,955 · -0.2%
- By 2040
- 375,444 · -1.2%
- By 2050
- 369,311 · -2.8%
- By 2075
- 354,233 · -6.7%
- By 2100
- 318,150 · -16.2%
Race, ethnicity, and origin ACS 2023
- Neighborhood character
- Predominantly White (74%)
- Race & ethnicity
- White 74% Hispanic / Latino 11% Black 11% Two or more races 6% Native American 4% Asian 3%
- Hispanic origin (detail)
- Mexican 3% Puerto Rican 4%
- Common ancestry
- Iranian 3% Romanian 2% Scotch-Irish 1%
- Foreign-born
- 12% · Canada
- Languages at home
- 92% English-only · Spanish 6% Russian/Polish/Slavic 1% Other Asian/Pacific 1%
Political lean MEDSL · Orange
- 2024 margin
- Lean R (+8.4) · D 45.8% · R 54.2%
- 2008→2024 swing
- -12.5pp toward R · 2008: 4.1pp · 2024: -8.4pp
- All cycles
- 2024: R+8.4 2020: R+0.2 2016: R+6.5 2012: D+5.2 2008: D+4.1
Not yet ingested
- Civics
- —
Market trends
- HPI YoY
- ▼ -1.08%
- Current HPI
- 289.0685
- Rent YoY
- —
- Metro
- —
- State GDP YoY
- ▲ 2.60%
- F500 in state
- 92
Industry mix (Fortune 500 HQ in NY)
| Industry | F500 HQs | Revenue |
|---|---|---|
| Financial Services | 10 | $950B |
|
||
| Consumer Goods | 9 | $162B |
|
||
| Insurance | 4 | $225B |
|
||
| Telecommunications | 2 | $144B |
|
||
| Pharmaceuticals | 2 | $112B |
|
||
| Media / Entertainment | 2 | $69B |
|
||
Price history
+240.5% since first listed4 events — show timeline
- 2026-06-12 Listed $429,000 OneKey® MLS as Distributed by MLS Grid
- 2000-05-02 Sold (Public Records) $147,000 Public Records
- 1994-05-20 Sold (Public Records) $126,000 Public Records
- 1988-12-16 Sold (Public Records) $126,000 Public Records
Property tax history
+2.7%/yrLatest (2025): $9,071 · +0.7% YoY. Source: county tax records.
Cash-flow waterfall
monthlySold comps — $/sqft
last 12 mo · ≤1 miLoading sold comps…