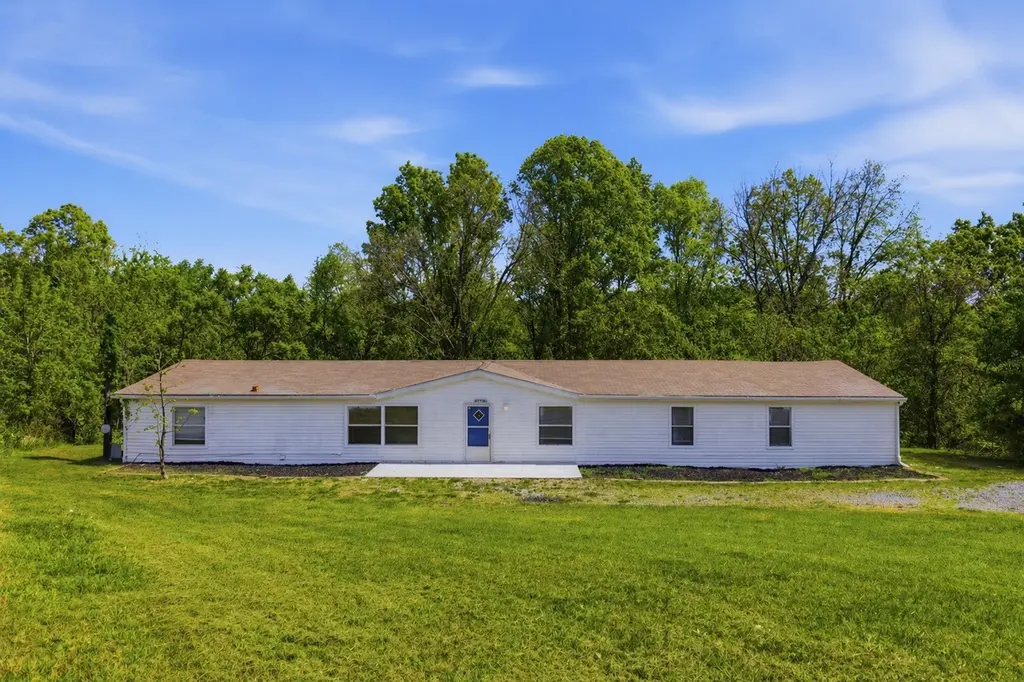
11274 Allen Dr · Bon Aqua Junction, TN
Flood risk 1/10 · Minimal
- FEMA flood zone
- X (unshaded)
- Chance of flooding over 30 yrs
- 0.0%
- Est. flood insurance / yr
- $507 – $1,088
Fire risk 5/10 · Moderate
- Est. fire insurance / yr
- $949 – $1,763
Heat risk 5/10 · Moderate
- Hot days now (above 108°F)
- 7 days/yr
- Hot days in 30 yrs
- 19 days/yr
Wind risk 4/10 · Minor
- Chance of severe wind over 30 yrs
- 12.0%
Air-quality risk 2/10 · Minimal
- Unhealthy air days now
- 1 days/yr
- Unhealthy air days in 30 yrs
- 1 days/yr
Risk factors via First Street. Map © Google.
Why this score? — see what drove the B grade
The composite is a weighted blend of 9 inputs, each scored 0–100. Each bar is that input's sub-score; the figure is the points it added to the 100-point composite (weight × sub-score).
- Cash flow +29.6/30.0
- DSCR +10.0/10.0
- Appreciation +10.0/10.0
- ARV discount +7.5/15.0
- 1% rule +7.2/10.0
- Livability +3.2/5.0
- Rent growth +2.5/5.0
- Condition / age +2.5/5.0
- Schools +1.8/10.0
$172,900
🖨 Deal sheet (PDF) 📄 Offer letter ✓ Due diligence
Listing remarks
Spacious 4 bedroom home on 2.3 acres featuring a tranquil creek along the rear boundary. Home has potential for 5 bedrooms. HVAC and water heater were replaced in 2022. Kitchen features an island and large walk-in pantry. Refrigerator, dishwasher and stove/oven remain. Large master bath with separate shower and tub. Covered back deck. Xfinity high speed internet is available. Convenient location for commuters to Interstate 40 and 840. Property sold AS-IS. Needs TLC. CASH OR CONVENTIONAL FINANCING ONLY
Key facts
- Covered back deck
- Large walk-in pantry
- 2.3 acre lot
Tags
Property features AI
Finance
- Financial info: $716 annual tax (reported)
Exterior
- Parking: No covered parking reported; No parking total reported
- Utilities: Public water available; Septic tank; Water available
- Home design: Residential mobile home; One level
- Construction: Vinyl siding
- Exterior features: Deck; Covered porch; Creek on the property
Interior
- Kitchen: Pantry; Oven; Range; Dishwasher; Refrigerator
- Bedrooms: 4 bedrooms (all on the main level); Bedroom sizes: 16x13, 14x13, 14x13, 13x12; Master bathroom
- Flooring: Carpet; Vinyl
- Bathrooms: 2 full bathrooms
- Heating & cooling: Central heating; Central air conditioning
- Interior features: Pantry; Walk-in closet(s)
Neighborhood map
What this means for you Summary
Snapshot
- This is a 4-bed/2.0-bath other listed at $173k.
Deal economics
- At list price, monthly cash flow is $624 ($7k/yr) — positive.
- The deal already cash-flows at list — no discount required.
- Meets the 1% rule at list price ($2k rent vs $173k).
- Recommended offer: $163k (6.0% below list) — sets the bar for market timing.
- Cap rate 10.6% vs local median 3.0% in Bon Aqua Junction — top-decile yield for the area; either an underpriced asset or a hidden risk that comps aren't pricing in. Stress-test before assuming the spread holds.
Location & tenants
- Location reads 64/100 on livability (#162 in TN) — a middle-class / working-renter tenant base. Strengths: cost of living A+, housing A+, crime B; Watch: health & safety C-, amenities F, commute F.
- Hickman County (rural): math 20% / reading 23% proficiency, ranked #107 of 139 in TN (top 77%) — low school quality limits family demand, transient renter base, plan for 1-2y turnover.
- Zoned schools: East Hickman Elementary (446 students, 0% FRL); East Hickman Middle School (math 7% / reading 16%, grade F, #247 of 333 statewide, top 75%, 385 students, 0% FRL); East Hickman High School (math 2% / reading 22%, grade F, #259 of 332 statewide, top 79%, 468 students, 0% FRL) — zoned schools average 0% FRL vs 54% district-wide (54 pts lower); this property's tenant base skews higher-income than the district average.
- Market conditions: 34 active listings in the ZIP; 121 units permitted in Hickman County in 2024 (0 in 5+ unit buildings).
Forward outlook
- In year one you build about $18k of equity ($1k loan paydown + $17k appreciation (10.0% local appreciation)).
- Hickman County population projected at -14% by 2050 — secular population decline; favor cash flow + early exit over multi-decade hold.
- At projected returns (10.0% appreciation + 3.0% rent growth), your $48k cash investment doubles in ~2 years — after that, you're playing with house money.
- By year 3, paydown + projected appreciation supports a ~$47k cash-out refi (75% LTV) — recoverable capital for the next deal without selling this one.
Negotiation context
- It's been on market 62 days — a 6% lower offer ($163k) is reasonable based on typical stale-listing flexibility.
- 4 sale attempts since 3y ago; this cycle's ask has dropped $37k (18%) from the opening price — seller is motivated, your offer sets the floor, not the list.
- Current owner paid $70k; list at $173k implies a 147% gain — meaningful room to come down on a strong offer.
Risks & watch-outs
- Climate carrying-cost: moderate wildfire risk; extreme-heat days projected 7→19/yr by 2055 (HVAC capex compounding) — expect insurance premiums to compound above CPI over the hold.
Questions for the listing agent
- It's been on market 62 days. Have you received any prior offers? Is the seller open to a 6% concession, seller financing, or rate buy-down credit?
- Why hasn't it sold? Are there any deal-killer items the seller is aware of (foundation, flood, title, zoning, code violations)?
- Is there a deadline driving the sale (1031 exchange, divorce, estate, relocation)? That informs how much negotiation room exists.
- Schools are D-rated, which usually means shorter tenancies and higher turnover. Who's the typical renter profile here, and what's been the actual vacancy rate?
- What's the average days-on-market for RENTAL listings here right now (not sales)? A rising rental-DOM trend means longer vacancies and softer asking-rent achievability than the comps imply.
- What's the recent tenant-quality profile in this submarket — average credit score on applications, eviction rate, late-payment / NSF rate, and stable-employment percentage? A property-management company in the area should have these aggregated.
- How much new for-sale + rental construction is in the pipeline within 1–3 miles? Heavy new supply typically softens prices + rents 12–24 months out; constrained supply supports both.
Investment metrics
- 1% rule
- 1.22% ✓
- Cap rate
- 10.62%
- Cash-on-cash
- 15.46%
- DSCR
- 1.69
- GRM
- 6.8
CMA / ARV
No comps found within radius.
Projected returns pro-forma
10.0% appreciation · 3.0% rent growth · sell at horizon
- IRR
- 35.7%
- Equity multiple
- 3.76×
- Total profit
- $133,818
- Equity at exit
- $155,762
- IRR
- 30.7%
- Equity multiple
- 8.49×
- Total profit
- $362,711
- Equity at exit
- $335,907
Cash invested: $48,412 (down + closing). Projections, not guarantees.
Landlord ↔ Tenant lean methodology
- Overall (STATE)
- 87 Strongly Landlord-Friendly
- State Tennessee
- 87 Strongly Landlord-Friendly · R+13
- County
- — inherits STATE
- City
- — inherits STATE
ZIP-level market 37098
- Home prices YoY
- 11.0%
- Active inventory
- 34
- Price-to-rent
- 6.8×
Monthly cashflow live
- Estimated rent
- $2,104 medium interval (Pro) →
- Mortgage (P&I)
- −$907
- Tax from tax record
- −$60 /mo · $716/yr
- Insurance
- −$72
- HOA
- −$0
- Vacancy / Maint / Mgmt
- −$442
- Net cashflow
- $624
Break-even live
Sensitivity live
| Price | -10% $721 | -5% $673 | +0% $624 | +5% $575 | +10% $526 |
|---|---|---|---|---|---|
| Rent | -10% $457 | -5% $540 | +0% $624 | +5% $707 | +10% $790 |
| Rate | -1.0pp $711 | -0.5pp $668 | base $624 | +0.5pp $579 | +1.0pp $533 |
UW: 25.0% down · 7.5% · 30yr · 1.5% tax · 5.0% vac · 8.0% maint · 8.0% mgmt
Financing live
Cash to close
- Down payment
- $43,225
- Closing costs
- $5,187
- Reserves months
- —
- Total cash needed
- —
Loan-product check · same deal, 3 products live
Conventional
25% down · 7.5% · 30yr
- Down + closing
- —
- Monthly P&I
- —
- Monthly cashflow
- —
- DSCR
- —
- Eligible?
- —
Personal DTI + credit; lowest rate.
DSCR
20% down · 8.5% · 30yr
- Down + closing
- —
- Monthly P&I
- —
- Monthly cashflow
- —
- DSCR
- —
- Eligible?
- —
No personal income docs; deal must DSCR.
Hard money
10% down · 12.0% · 12mo
- Down + closing
- —
- Monthly P&I
- —
- Monthly cashflow
- —
- DSCR
- —
- Eligible?
- —
Short-term bridge; refi at stabilization.
Listing history 26 events
-
2026-06-21days on market $172,900 Active 62 DOM
-
2026-06-18days on market $172,900 Active 59 DOM
-
2026-06-17days on market $172,900 Active 58 DOM
-
2026-06-16days on market $172,900 Active 57 DOM
-
2026-06-15days on market $172,900 Active 56 DOM
-
2026-06-13pricedays on market $172,900 Active 54 DOM
-
2026-06-09days on market $174,900 Active 50 DOM
-
2026-06-08days on market $174,900 Active 49 DOM
-
2026-06-07remarks 506-char remark
-
2026-06-07statusdays on market $174,900 Active 48 DOM
-
2026-06-05days on market $174,900 Active Under Contract 45 DOM
-
2026-06-03days on market $174,900 Active Under Contract 44 DOM
-
2026-06-02days on market $174,900 Active Under Contract 43 DOM
-
2026-06-01days on market $174,900 Active Under Contract 42 DOM
-
2026-05-31days on market $174,900 Active Under Contract 41 DOM
-
2026-05-14historical Active Under Contract 469-char remark
-
2026-05-12price $174,900 469-char remark
-
2026-05-03price $179,900 469-char remark
-
2026-05-01price $199,900 469-char remark
-
2026-04-20$209,900 Active 469-char remark
-
2024-02-20historical $1,700
-
2024-02-18$1,700
-
2024-02-09historical $1,700
-
2024-01-04price $1,700
-
2023-12-30$1,750
-
2007-11-07soldstatus $70,000
ⓘ Source: listings_history table (triggers on properties + properties_extension) + one-shot
backfill from property_details.listing_events for pre-trigger history.
Tax reassessment forecast TN · Resets to sale price
- Current annual tax
- $716 · $60/mo
- Projected year-2 tax
- $1,228 · $102/mo
- Expected delta
- +$512/yr (+$43/mo · 71.5%)
ⓘ Screening estimate from a state-policy table — verify with the county assessor before closing.
Climate risk First Street
- Flood 1/10 Low FEMA zone X (unshaded) · 0% chance over 30 yrs
- Wildfire 5/10 Major
- Heat 5/10 Major 7 d/yr ≥108°F today · 19 d/yr by 30 yrs out
- Wind 4/10 Moderate 12% chance of damaging wind over 30 yrs
- Air quality 2/10 Low 1 unhealthy d/yr today · 1 by 30 yrs out
Nearby sold comps map
Loading sold comps map…
Walkable amenities ~0.75 mi
Loading nearby amenities…
Taxation est. · year 1
- Rental income
- $25,246
- − Mortgage interest
- −$9,685
- − Property taxes
- −$716
- − Insurance
- −$864
- − Repairs & maintenance
- −$2,020
- − Management
- −$2,020
- − Depreciation
- −$5,030
- Taxable income
- $4,911
- Est. tax owed @ 24.0%
- −$1,179
- After-tax cash flow
- $6,304/yr
For passive investors: Depreciation is non-cash, so a rental often shows a tax loss while cash-flowing — sheltering income. Rental losses are passive: they offset passive income freely, and up to $25,000/yr can offset ordinary (W-2) income if you actively participate and your MAGI is under $100k (phasing out to $0 by $150k); unused losses carry forward. On sale, claimed depreciation is recaptured at up to 25%, and gains may owe capital-gains tax (a 1031 exchange can defer both). Figures are a year-1 estimate at your 24.0% rate — not tax advice; consult a CPA.
Schools (NCES district)
- District
- Hickman County
- NCES district ID
- 4701860
- Math proficiency
- 20% ▼ -9.00%
- Reading proficiency
- 23% ▼ -6.00%
- Median HH income
- $39,457
- Composite
- 18.14/100
- National rank
- #8966
- State rank
- #107 of 139 in TN
Livability — Bon Aqua Junction
- Score
- 64/100
- State rank
- #162
- US rank
- #14050
Category grades
Schools grade is shown separately in the Schools card above.
Census & demographics
- Census place
- Bon Aqua Junction, TN
- Population (ZIP)
- 5,933
Population outlook (Hickman County) Hauer SSP2
- Today (2025)
- 23,337 people
- By 2030
- 22,650 · -2.9%
- By 2040
- 21,310 · -8.7%
- By 2050
- 19,972 · -14.4%
- By 2075
- 17,073 · -26.8%
- By 2100
- 14,630 · -37.3%
Race, ethnicity, and origin ACS 2023
- Neighborhood character
- Predominantly White (87%)
- Race & ethnicity
- White 87% Two or more races 8% Hispanic / Latino 5% Black 2%
- Hispanic origin (detail)
- Mexican 3% Cuban 1%
- Common ancestry
- Estonian 1% Danish 1% Slovak 1%
- Foreign-born
- 2% · Canada
- Languages at home
- 97% English-only · Spanish 3%
Political lean MEDSL · Hickman
- 2024 margin
- Solid R (+61.1) · D 19.1% · R 80.2%
- 2008→2024 swing
- -46.7pp toward R · 2008: -14.4pp · 2024: -61.1pp
- All cycles
- 2024: R+61.1 2020: R+55.4 2016: R+49.8 2012: R+27.2 2008: R+14.4
Not yet ingested
- Civics
- —
Market trends
- HPI YoY
- ▲ 36.09%
- Current HPI
- 364.5408
- Rent YoY
- —
- Metro
- —
- State GDP YoY
- ▲ 2.78%
- F500 in state
- 22
Industry mix (Fortune 500 HQ in TN)
| Industry | F500 HQs | Revenue |
|---|---|---|
| Healthcare | 3 | $91B |
|
||
| Retail | 3 | $72B |
|
||
| Transportation / Logistics | 1 | $88B |
|
||
| Paper / Packaging | 1 | $19B |
|
||
| Insurance | 1 | $13B |
|
||
| Energy | 1 | $12B |
|
||
Price history
+147.0% since first listed13 events — show timeline
- 2026-06-12 Price Changed $172,900 REALTRACS as Distributed by MLS Grid
- 2026-06-05 Relisted — REALTRACS as Distributed by MLS Grid
- 2026-05-14 Contingent — REALTRACS as Distributed by MLS Grid
- 2026-05-12 Price Changed $174,900 REALTRACS as Distributed by MLS Grid
- 2026-05-03 Price Changed $179,900 REALTRACS as Distributed by MLS Grid
- 2026-05-01 Price Changed $199,900 REALTRACS as Distributed by MLS Grid
- 2026-04-20 Listed $209,900 REALTRACS as Distributed by MLS Grid
- 2024-02-20 Rental Removed $1,700 Avail
- 2024-02-18 Listed for Rent $1,700 Avail
- 2024-02-09 Rental Removed $1,700 Avail
- 2024-01-04 Price Changed $1,700 Avail
- 2023-12-30 Listed for Rent $1,750 Avail
- 2007-11-07 Sold (Public Records) $70,000 Public Records
Property tax history
+4.3%/yrLatest (2025): $716 · +3.6% YoY. Source: county tax records.
Cash-flow waterfall
monthlySold comps — $/sqft
last 12 mo · ≤1 miLoading sold comps…