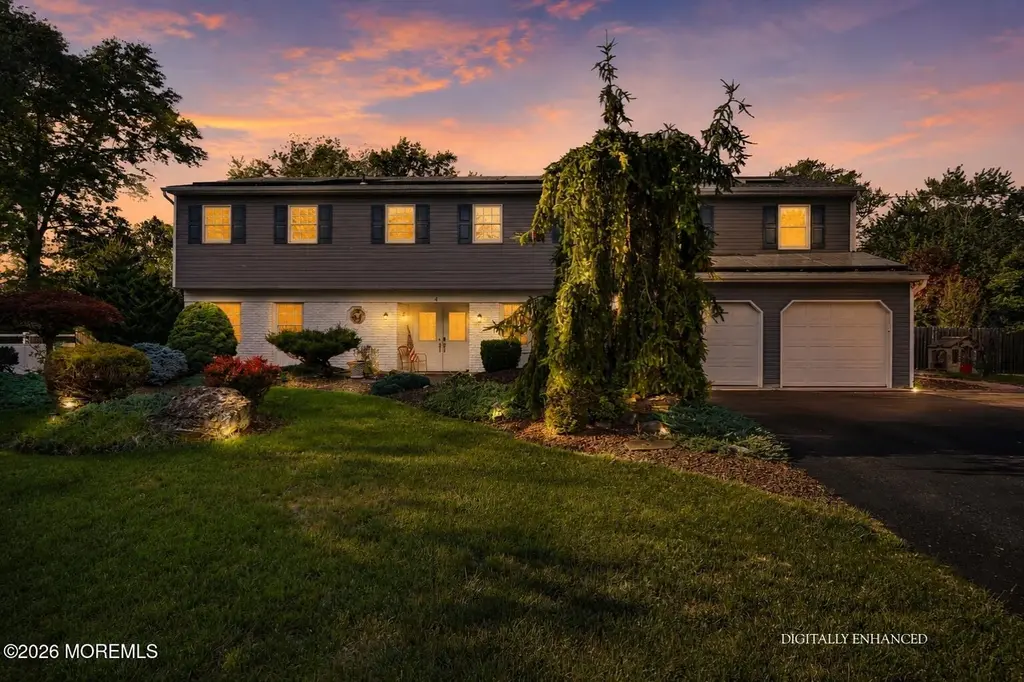
4 Canadian Woods Rd · Robertsville, NJ
Flood risk 1/10 · Minimal
- FEMA flood zone
- X (unshaded)
- Chance of flooding over 30 yrs
- 0.0%
- Est. flood insurance / yr
- $473 – $860
Fire risk 1/10 · Minimal
- Est. fire insurance / yr
- $526 – $976
Heat risk 6/10 · Moderate
- Hot days now (above 99°F)
- 7 days/yr
- Hot days in 30 yrs
- 15 days/yr
Wind risk 6/10 · Moderate
- Chance of severe wind over 30 yrs
- 27.0%
Air-quality risk 3/10 · Minor
- Unhealthy air days now
- 3 days/yr
- Unhealthy air days in 30 yrs
- 5 days/yr
Risk factors via First Street. Map © Google.
Why this score? — see what drove the D grade
The composite is a weighted blend of 9 inputs, each scored 0–100. Each bar is that input's sub-score; the figure is the points it added to the 100-point composite (weight × sub-score).
- Cash flow +12.6/30.0
- ARV discount +9.8/15.0
- Schools +5.9/10.0
- DSCR +3.8/10.0
- Livability +3.5/5.0
- 1% rule +3.3/10.0
- Rent growth +2.5/5.0
- Condition / age +2.5/5.0
- Appreciation +0.0/10.0
$989,000
🖨 Deal sheet (PDF) 📄 Offer letter ✓ Due diligence
Listing remarks
Stunning expanded Sandburg model offering over 3,150 square feet of beautifully updated living space in the heart of Marlboro Township. This exceptional home showcases an abundance of designer upgrades, including luxury wide-plank vinyl flooring throughout much of the home and a gourmet chef's kitchen featuring custom white cabinetry, quartz countertops, stainless steel appliances, and a spacious dining area. The dramatic living room is highlighted by soaring vaulted ceilings, oversized windows, and skylights that fill the home with natural light. An oversized family room with recessed lighting provides the perfect gathering space for family and friends. Five spacious bedrooms offer flexibi
Key facts
- Walk-in closet
- 2 garage spots
- Pool
Tags
Property features AI
Finance
- HOA & community: Subdivision: Whittier Oaks
Exterior
- Parking: Attached 2-car garage
- Utilities: Public sewer
- Home design: Fee simple ownership; Model: Exp Sandburg
- Construction: Finished partial basement
- Exterior features: Shingle roof; Level topography
Interior
- Kitchen: Dishwasher; Microwave; Stove / Range; Stove hood; Refrigerator; Gas cooking
- Bedrooms: 5 bedrooms
- Flooring: Ceramic tile; Wood
- Bathrooms: 2 full bathrooms and 1 half bathroom (total 3 bathrooms)
- Heating & cooling: Forced air heating with 2-zone heat; Central air conditioning with 2-zone AC
- Interior features: Outdoor lighting; Window treatments and blinds/shades; Ceiling fans; Light fixtures; Attic fan
- Laundry & utility: Washer; Dryer
Neighborhood map
What this means for you Summary
Snapshot
- This is a 5-bed/2.5-bath single-family listed at $989k.
Deal economics
- At list price, monthly cash flow is $-125 ($-2k/yr) — negative.
- To cash-flow at today's rent, offer at most $967k (2.2% below list).
- To meet the 1% rule (rent ≥ 1% of price), the offer needs to be $820k (17.1% below list).
- Recommended offer: $820k (17.1% below list) — sets the bar for 1% rule.
- Cap rate 6.1% vs local median 2.9% in Robertsville — top-decile yield for the area; either an underpriced asset or a hidden risk that comps aren't pricing in. Stress-test before assuming the spread holds.
Location & tenants
- Location reads 70/100 on livability (#258 in NJ) — a middle-class / working-renter tenant base. Strengths: crime A+, employment A+, housing A+; Watch: amenities F, commute F, cost of living F.
- Marlboro Township School District (suburban): math 51% / reading 68% proficiency, ranked #42 of 472 in NJ (top 9%) — acceptable for families but not a draw, mixed tenant base, ~2y average lease; only 3% free/reduced lunch — higher-income household profile.
- Zoned schools: Frank J. Dugan Elementary School (math 51% / reading 66%, grade B-, #135 of 1,303 statewide, top 11%, 649 students, 1% FRL); Marlboro Middle School (math 46% / reading 66%, grade B-, #58 of 431 statewide, top 14%, 1,004 students, 2% FRL) — zoned schools at 2% FRL track the district average.
- Market conditions: 110 active listings in the ZIP; 1 comparable units currently listed for rent nearby; 2,840 units permitted in Monmouth County in 2024 (484 in 5+ unit buildings).
Forward outlook
- Local home prices are declining (-3.0%/yr); year-one equity from $7k of loan paydown is wiped out by about $30k of value loss. Plan a longer hold.
- Monmouth County population projected at -11% by 2050 — secular population decline; favor cash flow + early exit over multi-decade hold.
Negotiation context
- It's been on market 16 days — a 2% lower offer ($974k) is reasonable based on typical stale-listing flexibility.
- 6 sale attempts since 17y ago with the ask held roughly flat each time — persistent listings suggest the price (not the market) is what's stuck; bring a comps-based counter.
- Current owner paid $635k; list at $989k implies a 56% gain — meaningful room to come down on a strong offer.
Risks & watch-outs
- Climate carrying-cost: major wind risk, 27% chance of damaging wind over 30y; extreme-heat days projected 7→15/yr by 2055 (HVAC capex compounding) — expect insurance premiums to compound above CPI over the hold.
Questions for the listing agent
- What do current leases actually rent for vs. the listed asking? Can we see a recent rent roll and the last 12 months of T-12 income?
- Is there a deadline driving the sale (1031 exchange, divorce, estate, relocation)? That informs how much negotiation room exists.
- Schools are A-rated — typically a magnet for longer-tenancy family renters. What's the average tenant stay here, and is there a school-zone premium baked into asking?
- The area grade is low — what's the realistic commute time and amenity access for the typical tenant pool here? Any planned neighborhood developments (good or bad) we should know about?
- What's the average days-on-market for RENTAL listings here right now (not sales)? A rising rental-DOM trend means longer vacancies and softer asking-rent achievability than the comps imply.
- What's the recent tenant-quality profile in this submarket — average credit score on applications, eviction rate, late-payment / NSF rate, and stable-employment percentage? A property-management company in the area should have these aggregated.
- How much new for-sale + rental construction is in the pipeline within 1–3 miles? Heavy new supply typically softens prices + rents 12–24 months out; constrained supply supports both.
Investment metrics
- 1% rule
- 0.83% ✗
- Cap rate
- 6.14%
- Cash-on-cash
- -0.54%
- DSCR
- 0.98
- GRM
- 10.1
CMA / ARV
- ARV (on-the-fly)
- $1,043,040
- Comps found
- 12
Show comp detail 12 sales within ~0.75 mi
| Address | Dist | Beds/Ba | Sqft | Sold | Price | $/sf | Match |
|---|---|---|---|---|---|---|---|
| 46 S Foxcroft Dr | 0.45mi | 5/2.5 | 3,089 (-3%) | 7mo | $814,900 | $264 | 69 |
| 126 Wyncrest Rd | 0.38mi | 5/3.0 | 3,015 (-5%) | 4mo | $960,000 | $318 | 68 |
| 25 Canadian Woods Rd | 0.21mi | 5/3.0 | 3,455 (+9%) | 9mo | $870,000 | $252 | 66 |
| 8 Eileen Ln | 0.50mi | 5/3.5 | 3,229 (+2%) | 10mo | $1,060,000 | $328 | 62 |
| 39 Vista Dr | 0.60mi | 5/3.0 | 3,124 (-2%) | 10mo | $1,100,000 | $352 | 59 |
| 3 Alberta Dr | 0.74mi | 5/3.5 | 3,140 (-1%) | 2mo | $1,091,000 | $347 | 58 |
| 52 Homestead Cir | 0.74mi | 4/3.5 (-1) | 3,144 (-1%) | 1mo | $1,050,000 | $334 | 54 |
| 21 Alberta Dr | 0.55mi | 4/2.5 (-1) | 3,377 (+6%) | 6mo | $959,000 | $284 | 54 |
| 41 Longstreet Rd | 0.75mi | 5/3.0 | 3,032 (-5%) | 3mo | $999,999 | $330 | 52 |
| 11 Woodview Dr | 0.57mi | 5/3.0 | 3,494 (+10%) | 4mo | $815,000 | $233 | 52 |
| 39 Homestead Cir | 0.67mi | 4/3.0 (-1) | 3,030 (-5%) | 5mo | $835,000 | $276 | 50 |
| 19 Dartmoor Dr | 0.69mi | 5/3.5 | 3,004 (-6%) | 10mo | $1,120,000 | $373 | 46 |
Match score weights: distance 35% · size 25% · config 20% · recency 20%. Top-matched comps best support the ARV.
Projected returns pro-forma
-3.0% appreciation · 3.0% rent growth · sell at horizon
- IRR
- -17.2%
- Equity multiple
- 0.39×
- Total profit
- $-168,260
- Equity at exit
- $147,463
- IRR
- -9.2%
- Equity multiple
- 0.43×
- Total profit
- $-156,869
- Equity at exit
- $85,511
Cash invested: $276,920 (down + closing). Projections, not guarantees.
Landlord ↔ Tenant lean methodology
- Overall (STATE)
- 21 Tenant-Leaning
- State New Jersey
- 21 Tenant-Leaning · D+6
- County
- — inherits STATE
- City
- — inherits STATE
ZIP-level market 07746
- Active inventory
- 110
- Price-to-rent
- 10.1×
Monthly cashflow live
- Estimated rent
- $8,200 medium interval (Pro) →
- Mortgage (P&I)
- −$5,186
- Tax from tax record
- −$1,005 /mo · $12,058/yr
- Insurance
- −$412
- HOA
- −$0
- Vacancy / Maint / Mgmt
- −$1,722
- Net cashflow
- $-125
Break-even live
Sensitivity live
| Price | -10% $435 | -5% $155 | +0% $-125 | +5% $-405 | +10% $-685 |
|---|---|---|---|---|---|
| Rent | -10% $-773 | -5% $-449 | +0% $-125 | +5% $199 | +10% $522 |
| Rate | -1.0pp $373 | -0.5pp $126 | base $-125 | +0.5pp $-382 | +1.0pp $-642 |
UW: 25.0% down · 7.5% · 30yr · 1.5% tax · 5.0% vac · 8.0% maint · 8.0% mgmt
Financing live
Cash to close
- Down payment
- $247,250
- Closing costs
- $29,670
- Reserves months
- —
- Total cash needed
- —
Loan-product check · same deal, 3 products live
Conventional
25% down · 7.5% · 30yr
- Down + closing
- —
- Monthly P&I
- —
- Monthly cashflow
- —
- DSCR
- —
- Eligible?
- —
Personal DTI + credit; lowest rate.
DSCR
20% down · 8.5% · 30yr
- Down + closing
- —
- Monthly P&I
- —
- Monthly cashflow
- —
- DSCR
- —
- Eligible?
- —
No personal income docs; deal must DSCR.
Hard money
10% down · 12.0% · 12mo
- Down + closing
- —
- Monthly P&I
- —
- Monthly cashflow
- —
- DSCR
- —
- Eligible?
- —
Short-term bridge; refi at stabilization.
Rent comps 1 comps
| Address | Beds | Baths | Sqft | Rent | $/sqft | DOM | Units | Dist |
|---|---|---|---|---|---|---|---|---|
| 8 Bennett Ct Marlboro, NJ | 5.0 | 3.5 | 4020 | $8,200 | $2.04 | 22d | 1 | 0.55mi |
Listing history 11 events
-
2026-06-21days on market $989,000 Active 16 DOM
-
2026-06-18days on market $989,000 Active 13 DOM
-
2026-06-17days on market $989,000 Active 12 DOM
-
2026-06-16days on market $989,000 Active 11 DOM
-
2026-06-15days on market $989,000 Active 10 DOM
-
2026-06-13days on market $989,000 Active 8 DOM
-
2026-06-13days on market $989,000 Active 7 DOM
-
2026-06-09days on market $989,000 Active 4 DOM
-
2026-06-08days on market $989,000 Active 3 DOM
-
2026-06-07remarks 699-char remark
-
2026-06-07$989,000 Active 2 DOM
ⓘ Source: listings_history table (triggers on properties + properties_extension) + one-shot
backfill from property_details.listing_events for pre-trigger history.
Tax reassessment forecast NJ · Partial reset (capped growth)
- Current annual tax
- $12,058 · $1,005/mo
- Projected year-2 tax
- $18,342 · $1,528/mo
- Expected delta
- +$6,284/yr (+$524/mo · 52.1%)
ⓘ Screening estimate from a state-policy table — verify with the county assessor before closing.
Climate risk First Street
- Flood 1/10 Low FEMA zone X (unshaded) · 0% chance over 30 yrs
- Wildfire 1/10 Low
- Heat 6/10 Major 7 d/yr ≥99°F today · 15 d/yr by 30 yrs out
- Wind 6/10 Major 27% chance of damaging wind over 30 yrs
- Air quality 3/10 Moderate 3 unhealthy d/yr today · 5 by 30 yrs out
Nearby sold comps map
Loading sold comps map…
Walkable amenities ~0.75 mi
Loading nearby amenities…
Taxation est. · year 1
- Rental income
- $98,400
- − Mortgage interest
- −$55,399
- − Property taxes
- −$12,058
- − Insurance
- −$4,945
- − Repairs & maintenance
- −$7,872
- − Management
- −$7,872
- − Depreciation
- −$28,771
- Taxable loss
- −$18,517
- Est. tax savings @ 24.0%
- +$4,444
- After-tax cash flow
- $2,940/yr
For passive investors: Depreciation is non-cash, so a rental often shows a tax loss while cash-flowing — sheltering income. Rental losses are passive: they offset passive income freely, and up to $25,000/yr can offset ordinary (W-2) income if you actively participate and your MAGI is under $100k (phasing out to $0 by $150k); unused losses carry forward. On sale, claimed depreciation is recaptured at up to 25%, and gains may owe capital-gains tax (a 1031 exchange can defer both). Figures are a year-1 estimate at your 24.0% rate — not tax advice; consult a CPA.
Schools (NCES district)
- District
- Marlboro Township School District
- NCES district ID
- 3409720
- Math proficiency
- 51% ▼ -19.00%
- Reading proficiency
- 68% ▼ -8.00%
- Median HH income
- $134,870
- Composite
- 58.71/100
- National rank
- #978
- State rank
- #42 of 472 in NJ
Livability — Robertsville
- Score
- 70/100
- State rank
- #258
- US rank
- #7369
Category grades
Schools grade is shown separately in the Schools card above.
Census & demographics
- Census place
- Robertsville, NJ
- Population (ZIP)
- 18,137
Population outlook (Monmouth County) Hauer SSP2
- Today (2025)
- 620,308 people
- By 2030
- 612,309 · -1.3%
- By 2040
- 587,297 · -5.3%
- By 2050
- 551,342 · -11.1%
- By 2075
- 472,934 · -23.8%
- By 2100
- 381,534 · -38.5%
Race, ethnicity, and origin ACS 2023
- Neighborhood character
- Predominantly White (74%)
- Race & ethnicity
- White 74% Asian 19% Hispanic / Latino 5% Two or more races 3% Black 1%
- Common ancestry
- Romanian 7% Scotch-Irish 7% Italian 2%
- Foreign-born
- 21% · China, Canada, South Korea
- Languages at home
- 74% English-only · Other Indo-European 8% Chinese 5% Russian/Polish/Slavic 4%
Political lean MEDSL · Monmouth
- 2024 margin
- R (+11.4) · D 43.4% · R 54.8% · Other 1.8%
- 2008→2024 swing
- -7.7pp toward R · 2008: -3.7pp · 2024: -11.4pp
- All cycles
- 2024: R+11.4 2020: R+2.8 2016: R+9.5 2012: R+5.5 2008: R+3.7
Not yet ingested
- Civics
- —
Market trends
- HPI YoY
- ▼ -470.82%
- Current HPI
- 277.775
- Rent YoY
- —
- Metro
- —
- State GDP YoY
- ▲ 2.05%
- F500 in state
- 34
Industry mix (Fortune 500 HQ in NJ)
| Industry | F500 HQs | Revenue |
|---|---|---|
| Consumer Goods | 3 | $31B |
|
||
| Pharmaceuticals | 2 | $153B |
|
||
| Technology | 2 | $21B |
|
||
| Insurance | 2 | $20B |
|
||
| Healthcare | 2 | $19B |
|
||
| Financial Services | 1 | $70B |
|
||
Price history
+79.8% since first listed18 events — show timeline
- 2026-06-05 Listed $989,000 MOMLS
- 2026-04-10 Price Changed $989,000 CJMLS
- 2026-04-10 Relisted — MOMLS
- 2026-04-10 Price Changed $989,000 MOMLS
- 2026-01-20 Price Changed $1,099,999 CJMLS
- 2026-01-20 Relisted — MOMLS
- 2026-01-20 Price Changed $1,099,999 MOMLS
- 2025-11-18 Price Changed $949,999 CJMLS
- 2025-11-18 Price Changed $949,999 MOMLS
- 2025-11-05 Listed $979,999 MOMLS
- 2021-04-07 Sold (Public Records) $635,000 Public Records
- 2021-03-11 Sold (MLS) $635,000 MOMLS
- 2020-11-30 Pending — MOMLS
- 2020-10-29 Listed $649,000 MOMLS
- 2010-03-26 Sold (Public Records) $520,000 Public Records
- 2009-08-28 Sold (Public Records) $520,000 Public Records
- 2009-08-07 Sold (MLS) $520,000 MOMLS
- 2009-05-11 Listed $550,000 MOMLS
Property tax history
+1.9%/yrLatest (2025): $12,058 · +4.7% YoY. Source: county tax records.
Cash-flow waterfall
monthlySold comps — $/sqft
last 12 mo · ≤1 miLoading sold comps…