109 Colleen Dr · Sierra View, PA
Flood risk 1/10 · Minimal
- FEMA flood zone
- X (unshaded)
- Chance of flooding over 30 yrs
- 0.0%
- Est. flood insurance / yr
- $507 – $1,088
Fire risk 3/10 · Minor
- Est. fire insurance / yr
- $511 – $949
Heat risk 2/10 · Minimal
- Hot days now (above 92°F)
- 7 days/yr
- Hot days in 30 yrs
- 15 days/yr
Wind risk 4/10 · Minor
- Chance of severe wind over 30 yrs
- 10.0%
Air-quality risk 3/10 · Minor
- Unhealthy air days now
- 1 days/yr
- Unhealthy air days in 30 yrs
- 4 days/yr
Risk factors via First Street. Map © Google.
Why this score? — see what drove the D- grade
The composite is a weighted blend of 9 inputs, each scored 0–100. Each bar is that input's sub-score; the figure is the points it added to the 100-point composite (weight × sub-score).
- Cash flow +9.3/30.0
- Appreciation +5.2/10.0
- ARV discount +4.9/15.0
- Schools +4.0/10.0
- Livability +3.1/5.0
- 1% rule +2.6/10.0
- DSCR +2.6/10.0
- Rent growth +2.5/5.0
- Condition / age +2.5/5.0
$339,900
🖨 Deal sheet 📄 Offer letter ✓ Due diligence
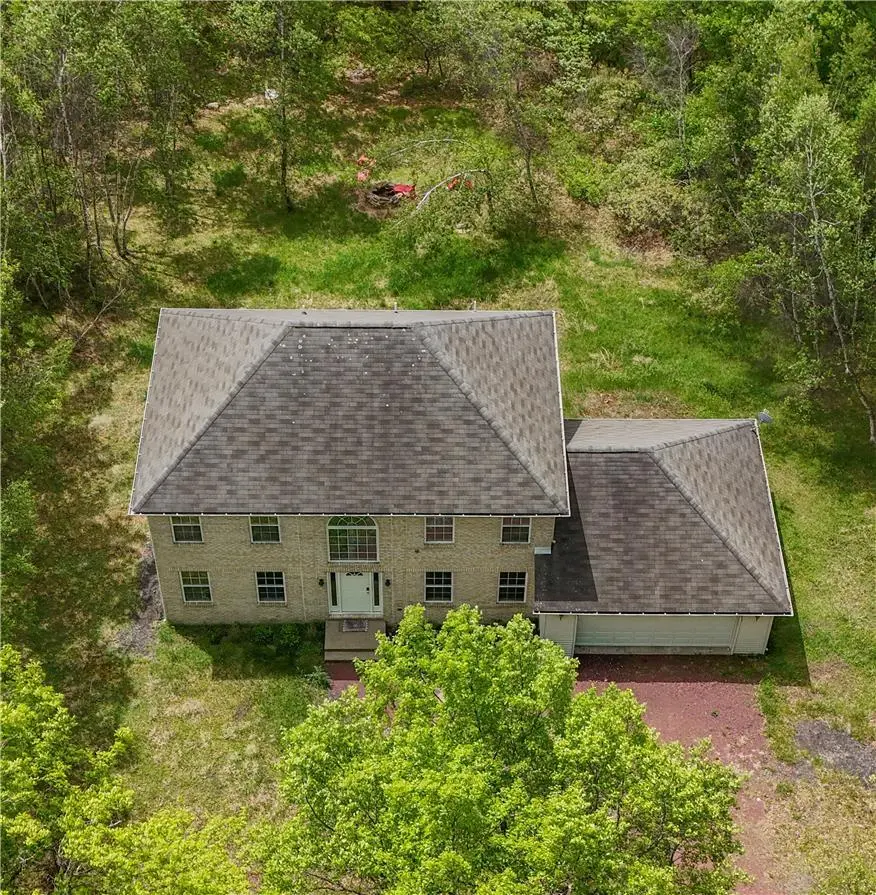
Listing remarks
Colonial with no HOA featuring 3-bedrooms and 2.5-bathrooms, beautifully seated on 1.65 acres just moments from Route 115. This brick-front home offers strong curb appeal with a nice 2-car garage and around back you will find a nice sized deck ready for its new summer BBQs, all while enjoying beautiful mountain views, such an ideal setting for relaxation or entertaining! Walk inside to find a very functional layout offering generous living space, including a formal living room, spacious family room, eat-in kitchen, and dedicated dining area. The second level offers a primary suite with private bathroom, along with two nicely sized bedrooms and a full bathroom. Property is being sold as is.
Key facts
- 1.65 acre lot
- Garage
- Built 1998
Property features AI
Exterior
- Parking: Attached garage
- Utilities: Well water; Septic tank
- Home design: Two-story home; Above-grade finished area reported
- Construction: Brick and vinyl siding exterior; Asphalt/fiberglass roof; Year built details unknown
- Exterior features: Lot approximately 1.65 acres; Zoned R1
Interior
- Kitchen: Dishwasher; Electric oven; Electric range; Refrigerator; Eat-in kitchen with breakfast nook
- Bedrooms: Bedrooms located on the second floor (multiple bedrooms)
- Bathrooms: Two full bathrooms; One half bathroom (on the first floor)
- Heating & cooling: Electric heating
- Interior features: Breakfast area; Dining area; Separate/formal dining room; Eat-in kitchen
- Laundry & utility: Laundry room (first floor)
Neighborhood map
What this means for you Summary
Snapshot
- This is a 4-bed/2.5-bath single-family listed at $340k.
Deal economics
- At list price, monthly cash flow is $-247 ($-3k/yr) — negative.
- To cash-flow at today's rent, offer at most $296k (12.8% below list).
- To meet the 1% rule (rent ≥ 1% of price), the offer needs to be $259k (23.7% below list).
- Recommended offer: $259k (23.7% below list) — sets the bar for 1% rule.
- Cap rate 5.4% vs local median 3.5% in Sierra View — top-decile yield for the area; either an underpriced asset or a hidden risk that comps aren't pricing in. Stress-test before assuming the spread holds.
Location & tenants
- Location reads 62/100 on livability (#1,371 in PA) — a middle-class / working-renter tenant base. Strengths: cost of living A+, housing A+, crime B+; Watch: health & safety D, schools F, amenities F.
- Pocono Mountain SD (rural): math 37% / reading 55% proficiency, ranked #245 of 539 in PA (top 46%) — families likely to look elsewhere, expect single-tenant / working-renter base with shorter leases.
- Market conditions: 90 active listings in the ZIP; 4 comparable units currently listed for rent nearby; rentals at typical pace (median 24d on market — plan ~3-4 weeks tenant-placement turnaround); 278 units permitted in Monroe County in 2024 (52 in 5+ unit buildings).
Forward outlook
- In year one you build about $4k of equity ($2k loan paydown + $2k appreciation (0.5% local appreciation)).
- Monroe County population projected at -11% by 2050 — secular population decline; favor cash flow + early exit over multi-decade hold.
- By year 8, paydown + projected appreciation supports a ~$34k cash-out refi (75% LTV) — recoverable capital for the next deal without selling this one.
Negotiation context
- Only 8 days on market — expect competitive offers; lowballing is unlikely to land.
- 9 sale attempts since 25y ago with the ask held roughly flat each time — persistent listings suggest the price (not the market) is what's stuck; bring a comps-based counter.
- Current owner paid $275k; 24% above their basis — modest negotiation headroom, anchor on the comps not their cost.
Questions for the listing agent
- What do current leases actually rent for vs. the listed asking? Can we see a recent rent roll and the last 12 months of T-12 income?
- Is there a deadline driving the sale (1031 exchange, divorce, estate, relocation)? That informs how much negotiation room exists.
- Schools are F-rated, which usually means shorter tenancies and higher turnover. Who's the typical renter profile here, and what's been the actual vacancy rate?
- The area grade is low — what's the realistic commute time and amenity access for the typical tenant pool here? Any planned neighborhood developments (good or bad) we should know about?
- What's the average days-on-market for RENTAL listings here right now (not sales)? A rising rental-DOM trend means longer vacancies and softer asking-rent achievability than the comps imply.
- What's the recent tenant-quality profile in this submarket — average credit score on applications, eviction rate, late-payment / NSF rate, and stable-employment percentage? A property-management company in the area should have these aggregated.
- How much new for-sale + rental construction is in the pipeline within 1–3 miles? Heavy new supply typically softens prices + rents 12–24 months out; constrained supply supports both.
Investment metrics
- 1% rule
- 0.76% ✗
- Cap rate
- 5.42%
- Cash-on-cash
- -3.11%
- DSCR
- 0.86
- GRM
- 10.9
CMA / ARV
- ARV (on-the-fly)
- $321,088
- Comps found
- 11
Show comp detail 11 sales within ~0.75 mi
| Address | Dist | Beds/Ba | Sqft | Sold | Price | $/sf | Match |
|---|---|---|---|---|---|---|---|
| 1232 Quiet Hills Ln | 0.37mi | 3/2.0 (-1) | 1,788 (-4%) | 8mo | $385,000 | $215 | 63 |
| 319 Russell Ct | 0.28mi | 4/2.5 | 1,924 (+4%) | 22mo | $318,000 | $165 | 63 |
| 1518 Anne Ln Ln Unit Anne Ln 81 | 0.35mi | 3/3.0 (-1) | 2,104 (+13%) | 1mo | $345,000 | $164 | 53 |
| 122 Colleen Dr | 0.08mi | 3/2.5 (-1) | 2,067 (+11%) | 24mo | $345,000 | $167 | 52 |
| 2205 Marquette Dr | 0.46mi | 3/2.0 (-1) | 1,678 (-10%) | 7mo | $290,000 | $173 | 50 |
| 593 Scenic Dr | 0.73mi | 3/2.0 (-1) | 1,800 (-3%) | 6mo | $330,000 | $183 | 48 |
| 2337 Cheyenne Dr | 0.71mi | 4/2.5 | 2,024 (+9%) | 8mo | $414,900 | $205 | 45 |
| 2449 Tacoma Dr | 0.45mi | 3/1.5 (-1) | 1,664 (-10%) | 12mo | $280,000 | $168 | 43 |
| 2034 Candlewood Dr | 0.54mi | 3/2.0 (-1) | 1,728 (-7%) | 20mo | $273,000 | $158 | 40 |
| 1227 Mathews Dr | 0.51mi | 3/2.0 (-1) | 1,653 (-11%) | 14mo | $330,900 | $200 | 39 |
| 512 Skyline Dr | 0.44mi | 3/2.0 (-1) | 1,681 (-9%) | 22mo | $300,000 | $178 | 38 |
Match score weights: distance 35% · size 25% · config 20% · recency 20%. Top-matched comps best support the ARV.
Projected returns pro-forma
0.47% appreciation · 3.0% rent growth · sell at horizon
- IRR
- -3.9%
- Equity multiple
- 0.81×
- Total profit
- $-18,115
- Equity at exit
- $106,725
- IRR
- 1.6%
- Equity multiple
- 1.18×
- Total profit
- $17,292
- Equity at exit
- $134,884
Cash invested: $95,172 (down + closing). Projections, not guarantees.
Landlord ↔ Tenant lean methodology
- Overall (STATE)
- 62 Landlord-Friendly
- State Pennsylvania
- 62 Landlord-Friendly · EVEN
- County
- — inherits STATE
- City
- — inherits STATE
ZIP-level market 18610
- Home prices YoY
- 0.3%
- Active inventory
- 90
- Price-to-rent
- 10.9×
Monthly cashflow live
- Estimated rent
- $2,592 medium interval (Pro) →
- Mortgage (P&I)
- −$1,782
- Tax from tax record
- −$371 /mo · $4,447/yr
- Insurance
- −$142
- HOA
- −$0
- Vacancy / Maint / Mgmt
- −$544
- Net cashflow
- $-247
Break-even live
UW: 25.0% down · 7.5% · 30yr · 1.5% tax · 5.0% vac · 8.0% maint · 8.0% mgmt
Financing live
Cash to close
- Down payment
- $84,975
- Closing costs
- $10,197
- Reserves months
- —
- Total cash needed
- —
Loan-product check · same deal, 3 products live
Conventional
25% down · 7.5% · 30yr
- Down + closing
- —
- Monthly P&I
- —
- Monthly cashflow
- —
- DSCR
- —
- Eligible?
- —
Personal DTI + credit; lowest rate.
DSCR
20% down · 8.5% · 30yr
- Down + closing
- —
- Monthly P&I
- —
- Monthly cashflow
- —
- DSCR
- —
- Eligible?
- —
No personal income docs; deal must DSCR.
Hard money
10% down · 12.0% · 12mo
- Down + closing
- —
- Monthly P&I
- —
- Monthly cashflow
- —
- DSCR
- —
- Eligible?
- —
Short-term bridge; refi at stabilization.
Rent comps 4 comps
| Address | Beds | Baths | Sqft | Rent | $/sqft | DOM | Units | Dist |
|---|---|---|---|---|---|---|---|---|
| 2662 Tacoma Dr Blakeslee, PA | 4.0 | 3.5 | 2412 | $3,000 | $1.24 | 21d | 1 | 0.64mi |
| 108 Reynolds Rd Albrightsville, PA | 3.0 | 2.5 | 1841 | $2,500 | $1.36 | 23d | 1 | 1.32mi |
| 347 Skyline Dr Blakeslee, PA | 3.0 | 1.5 | 1896 | $2,200 | $1.16 | 23d | 1 | 1.33mi |
| 177 Dogwood Ter Albrightsville, PA | 3.0 | 2.0 | 1885 | $2,400 | $1.27 | 23d | 1 | 1.41mi |
Listing history 8 events
-
2026-06-19days on market $339,900 Active 8 DOM
-
2026-06-18days on market $339,900 Active 7 DOM
-
2026-06-17days on market $339,900 Active 6 DOM
-
2026-06-16days on market $339,900 Active 5 DOM
-
2026-06-15days on market $339,900 Active 4 DOM
-
2026-06-14days on market $339,900 Active 2 DOM
-
2026-06-13remarks 699-char remark
-
2026-06-13$339,900 Active 1 DOM
ⓘ Source: listings_history table (triggers on properties + properties_extension) + one-shot
backfill from property_details.listing_events for pre-trigger history.
Tax reassessment forecast PA · Partial reset (capped growth)
- Current annual tax
- $4,447 · $371/mo
- Projected year-2 tax
- $4,909 · $409/mo
- Expected delta
- +$462/yr (+$38/mo · 10.4%)
ⓘ Screening estimate from a state-policy table — verify with the county assessor before closing.
Climate risk First Street
- Flood 1/10 Low FEMA zone X (unshaded) · 0% chance over 30 yrs
- Wildfire 3/10 Moderate
- Heat 2/10 Low 7 d/yr ≥92°F today · 15 d/yr by 30 yrs out
- Wind 4/10 Moderate 10% chance of damaging wind over 30 yrs
- Air quality 3/10 Moderate 1 unhealthy d/yr today · 4 by 30 yrs out
Nearby sold comps map
Loading sold comps map…
Walkable amenities ~0.75 mi
Loading nearby amenities…
Taxation est. · year 1
- Rental income
- $31,105
- − Mortgage interest
- −$19,040
- − Property taxes
- −$4,447
- − Insurance
- −$1,700
- − Repairs & maintenance
- −$2,488
- − Management
- −$2,488
- − Depreciation
- −$9,888
- Taxable loss
- −$8,945
- Est. tax savings @ 24.0%
- +$2,147
- After-tax cash flow
- $-816/yr
For passive investors: Depreciation is non-cash, so a rental often shows a tax loss while cash-flowing — sheltering income. Rental losses are passive: they offset passive income freely, and up to $25,000/yr can offset ordinary (W-2) income if you actively participate and your MAGI is under $100k (phasing out to $0 by $150k); unused losses carry forward. On sale, claimed depreciation is recaptured at up to 25%, and gains may owe capital-gains tax (a 1031 exchange can defer both). Figures are a year-1 estimate at your 24.0% rate — not tax advice; consult a CPA.
Schools (NCES district)
- District
- Pocono Mountain SD
- NCES district ID
- 4219500
- Math proficiency
- 37% ▼ -5.00%
- Reading proficiency
- 55% ▲ 1.00%
- Median HH income
- $55,317
- Composite
- 39.91/100
- National rank
- #3856
- State rank
- #245 of 539 in PA
Livability — Sierra View
- Score
- 62/100
- State rank
- #1371
- US rank
- #17228
Category grades
Schools grade is shown separately in the Schools card above.
Census & demographics
- Census place
- Sierra View, PA
- Population (ZIP)
- 4,373
Population outlook (Monroe County) Hauer SSP2
- Today (2025)
- 164,099 people
- By 2030
- 161,412 · -1.6%
- By 2040
- 154,616 · -5.8%
- By 2050
- 146,710 · -10.6%
- By 2075
- 140,830 · -14.2%
- By 2100
- 138,472 · -15.6%
Race, ethnicity, and origin ACS 2023
- Neighborhood character
- Highly diverse neighborhood (Simpson 0.73)
- Race & ethnicity
- White 46% Hispanic / Latino 17% Black 15% Two or more races 10% Asian 7%
- Hispanic origin (detail)
- Puerto Rican 13%
- Common ancestry
- Romanian 6% Subsaharan African 2% Iranian 1%
- Foreign-born
- 9% · Canada
- Languages at home
- 85% English-only · Spanish 9% Tagalog/Filipino 3% Russian/Polish/Slavic 2%
Political lean MEDSL · Monroe
- 2024 margin
- Toss-up / Even · D 49.1% · R 49.9%
- 2008→2024 swing
- -17.1pp toward R · 2008: 16.3pp · 2024: -0.8pp
- All cycles
- 2024: R+0.8 2020: D+6.4 2016: D+0.3 2012: D+14.0 2008: D+16.3
Not yet ingested
- Civics
- —
Market trends
- HPI YoY
- ▲ 0.47%
- Current HPI
- 181.9087
- Rent YoY
- —
- Metro
- —
- State GDP YoY
- ▲ 1.68%
- F500 in state
- 34
Industry mix (Fortune 500 HQ in PA)
| Industry | F500 HQs | Revenue |
|---|---|---|
| Healthcare | 2 | $309B |
|
||
| Insurance | 2 | $27B |
|
||
| Telecommunications / Media | 1 | $124B |
|
||
| Industrial Distribution | 1 | $22B |
|
||
| Financial Services | 1 | $20B |
|
||
| Chemicals / Materials | 1 | $18B |
|
||
Price history
+163.5% since first listed14 events — show timeline
- 2026-06-11 Listed $339,900 GLVRMLS
- 2024-11-21 Price Changed $474,000 PMAR
- 2024-07-31 Listed $499,000 PMAR
- 2023-08-24 Listed $499,000 PMAR
- 2022-06-04 Listed $479,900 PMAR
- 2021-09-20 Sold (Public Records) $275,000 Public Records
- 2021-08-13 Sold (MLS) $275,000 PMAR
- 2021-04-06 Listed $299,900 PMAR
- 2008-08-28 Listed $199,850 PMAR
- 2005-08-10 Listed $230,000 PMAR
- 2001-03-30 Sold (MLS) $132,500 GLVRMLS
- 2001-03-30 Sold (MLS) $132,500 PMAR
- 2001-02-14 Listed $129,000 GLVRMLS
- 2001-02-14 Listed $129,000 PMAR
Property tax history
-1.7%/yrLatest (2026): $4,447 · +3.4% YoY. Source: county tax records.
Cash-flow waterfall
monthlySold comps — $/sqft
last 12 mo · ≤1 miLoading sold comps…