 6-Plex
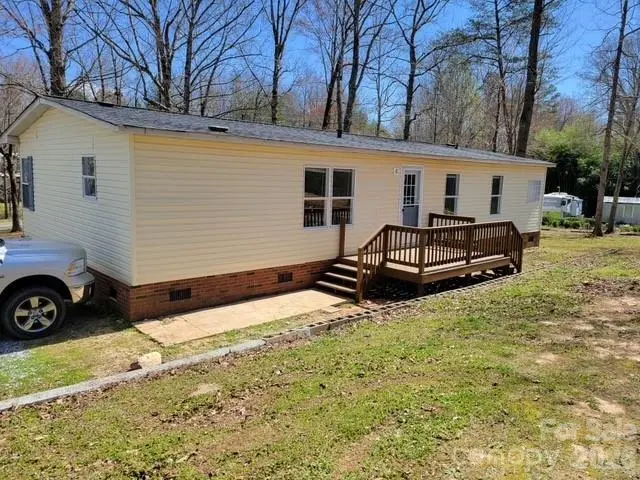
4467 Patti Clymer Dr #1 · Morganton, NC
Flood risk 1/10 · Minimal
- FEMA flood zone
- X (unshaded)
- Chance of flooding over 30 yrs
- 0.0%
- Est. flood insurance / yr
- $507 – $1,088
Fire risk 5/10 · Moderate
- Est. fire insurance / yr
- $906 – $1,684
Heat risk 5/10 · Moderate
- Hot days now (above 103°F)
- 7 days/yr
- Hot days in 30 yrs
- 18 days/yr
Wind risk 2/10 · Minimal
- Chance of severe wind over 30 yrs
- 0.0%
Air-quality risk 2/10 · Minimal
- Unhealthy air days now
- 2 days/yr
- Unhealthy air days in 30 yrs
- 2 days/yr
Risk factors via First Street. Map © Google.
Why this score? — see what drove the C+ grade
The composite is a weighted blend of 9 inputs, each scored 0–100. Each bar is that input's sub-score; the figure is the points it added to the 100-point composite (weight × sub-score).
- Cash flow +25.1/30.0
- DSCR +8.2/10.0
- ARV discount +7.5/15.0
- 1% rule +6.6/10.0
- Schools +3.8/10.0
- Condition / age +3.8/5.0
- Livability +3.5/5.0
- Rent growth +2.5/5.0
- Appreciation +0.0/10.0
$699,900
🖨 Deal sheet 📄 Offer letter ✓ Due diligence
Multi-family units
County records classify this as Multi-Family (5+ Unit). Listing-text estimate: 6 units. confirmed
5+ unit building — per-unit beds/baths from public records are typically unavailable; the breakdown below (if shown) is an estimate from the listing text.
Listing remarks
Calling all investors. Looking for a income producing property? There are 6 income-producing homes that are all on their own deeded lot, 8 total lots ac 4.5. Tax record is for all lots and the 6 units. Seller will not sell individual homes. Homes have been updated and well-kept. Good-paying tenants. Do not drive on the property or approach any of the tenants. The owner is an NC real estate broker. Some appliances belong to the tenants. Each unit is individually deeded, but the Seller will not sell them individually
Key facts
- 4.52 acre lot
- Built 1998
- Listed 87 days
Property features AI
Finance
- Other: Multi-family property with 6 existing units (6 total); Projected total units noted as 8; Restrictions: see remarks
- Financial info: Owner pays water for the property; Tenants pay all other utilities except water
- HOA & community: No HOA; Community features: None; Pets allowed with conditions
Exterior
- Parking: Each unit parks at its own unit; Other parking (see remarks)
- Utilities: City water and shared well; Septic system installed
- Home design: Residential income property; R-3 zoning; Has additional parcels
- Construction: Manufactured construction; Vinyl exterior
- Exterior features: Private maintained road access; Road surfaces include dirt and gravel
Interior
- Kitchen: Electric range
- Bedrooms: Total of 18 bedrooms across the property; Primary bedroom(s) present
- Flooring: Vinyl
- Bathrooms: 9 full bathrooms
- Heating & cooling: Central heating; Central air
- Interior features: Electric range; Other kitchen appliances included; Vinyl flooring; Central heating; Central air
- Laundry & utility: In-unit laundry
Neighborhood map
What this means for you Summary
Snapshot
- This is a 6 × 3-bed/1.5-bath units multifamily listed at $700k. Condition is rated good.
Deal economics
- At list price, monthly cash flow is $2k ($19k/yr) — positive. Per door: $258/mo.
- The deal already cash-flows at list — no discount required.
- Meets the 1% rule at list price ($8k rent vs $700k).
- Recommended offer: $658k (6.0% below list) — sets the bar for market timing.
- Cap rate 8.9% vs local median 3.7% in Morganton — top-decile yield for the area; either an underpriced asset or a hidden risk that comps aren't pricing in. Stress-test before assuming the spread holds.
Location & tenants
- Location reads 69/100 on livability (#149 in NC) — a middle-class / working-renter tenant base. Strengths: cost of living A+, health & safety A+, housing A; Watch: amenities D, schools F, crime D-.
- Burke County Schools (rural): math 43% / reading 47% proficiency, ranked #89 of 178 in NC (top 50%) — families likely to look elsewhere, expect single-tenant / working-renter base with shorter leases.
- Market conditions: 431 active listings in the ZIP; 422 units permitted in Burke County in 2024 (94 in 5+ unit buildings).
- At $8,084/mo this rent would consume 168% of the median local household income ($58k/yr) (locally 1145% of renters already pay >50% of income on rent) — very limited rent-growth headroom before tenants either downsize or default.
Forward outlook
- Local home prices are declining (-3.0%/yr); year-one equity from $5k of loan paydown is wiped out by about $21k of value loss. Plan a longer hold.
- Burke County population projected at -18% by 2050 — secular population decline; favor cash flow + early exit over multi-decade hold.
Negotiation context
- It's been on market 88 days — a 6% lower offer ($658k) is reasonable based on typical stale-listing flexibility.
- 2 sale attempts; this cycle's ask has dropped $75k (10%) from the opening price — seller is motivated, your offer sets the floor, not the list.
Risks & watch-outs
- Climate carrying-cost: moderate wildfire risk; extreme-heat days projected 7→18/yr by 2055 (HVAC capex compounding) — expect insurance premiums to compound above CPI over the hold.
Questions for the listing agent
- It's been on market 88 days. Have you received any prior offers? Is the seller open to a 6% concession, seller financing, or rate buy-down credit?
- Can we see the unit-by-unit rent roll, current vacancy, and any below-market leases? What's the average tenancy length?
- What capital expenditures (roof, boiler, parking lot, exteriors) have been made in the last 5 years, and what's planned in the next 2?
- Why hasn't it sold? Are there any deal-killer items the seller is aware of (foundation, flood, title, zoning, code violations)?
- Is there a deadline driving the sale (1031 exchange, divorce, estate, relocation)? That informs how much negotiation room exists.
- Schools are F-rated, which usually means shorter tenancies and higher turnover. Who's the typical renter profile here, and what's been the actual vacancy rate?
- Crime grade is D in this area — have there been break-ins, vandalism, or insurance claims at this property in the last 3 years? What carrier currently insures it and at what premium?
- What's the average days-on-market for RENTAL listings here right now (not sales)? A rising rental-DOM trend means longer vacancies and softer asking-rent achievability than the comps imply.
- What's the recent tenant-quality profile in this submarket — average credit score on applications, eviction rate, late-payment / NSF rate, and stable-employment percentage? A property-management company in the area should have these aggregated.
- How much new apartment / multifamily construction is in the pipeline within 1–3 miles? Heavy new supply (>2% of stock underway) typically softens rents 12–24 months out; light construction supports rent growth.
Investment metrics
- 1% rule
- 1.16% ✓
- Cap rate
- 8.95%
- Cash-on-cash
- 9.49%
- DSCR
- 1.42
- GRM
- 7.2
CMA / ARV
No comps found within radius.
Projected returns pro-forma
-3.0% appreciation · 3.0% rent growth · sell at horizon
- IRR
- -2.0%
- Equity multiple
- 0.93×
- Total profit
- $-14,603
- Equity at exit
- $104,357
- IRR
- 7.7%
- Equity multiple
- 1.59×
- Total profit
- $114,858
- Equity at exit
- $60,515
Cash invested: $195,972 (down + closing). Projections, not guarantees.
Landlord ↔ Tenant lean methodology
- Overall (STATE)
- 85 Strongly Landlord-Friendly
- State North Carolina
- 85 Strongly Landlord-Friendly · R+3
- County
- — inherits STATE
- City
- — inherits STATE
ZIP-level market 28655
- Home prices YoY
- -13.2%
- Active inventory
- 431
- Price-to-rent
- 43.3×
Monthly cashflow live
- Estimated rent
- $8,084 medium interval (Pro) →
- Mortgage (P&I)
- −$3,670
- Tax est. 1.5%
- −$875 /mo · $10,498/yr
- Insurance
- −$292
- HOA
- −$0
- Vacancy / Maint / Mgmt
- −$1,698
- Net cashflow
- $1,550
Break-even live
6-unit breakdown (identical units grouped — click to expand)
| Units | Beds | Baths | Est. rent |
|---|---|---|---|
| 6× units | 3 | 1.5 | $8,082 |
| #1 | 3 | 1.5 | $1,347 |
| #2 | 3 | 1.5 | $1,347 |
| #3 | 3 | 1.5 | $1,347 |
| #4 | 3 | 1.5 | $1,347 |
| #5 | 3 | 1.5 | $1,347 |
| #6 | 3 | 1.5 | $1,347 |
| Total (6 units) | $8,084 | ||
UW: 25.0% down · 7.5% · 30yr · 1.5% tax · 5.0% vac · 8.0% maint · 8.0% mgmt
Financing live
Cash to close
- Down payment
- $174,975
- Closing costs
- $20,997
- Reserves months
- —
- Total cash needed
- —
Loan-product check · same deal, 3 products live
Conventional
25% down · 7.5% · 30yr
- Down + closing
- —
- Monthly P&I
- —
- Monthly cashflow
- —
- DSCR
- —
- Eligible?
- —
Personal DTI + credit; lowest rate.
DSCR
20% down · 8.5% · 30yr
- Down + closing
- —
- Monthly P&I
- —
- Monthly cashflow
- —
- DSCR
- —
- Eligible?
- —
No personal income docs; deal must DSCR.
Hard money
10% down · 12.0% · 12mo
- Down + closing
- —
- Monthly P&I
- —
- Monthly cashflow
- —
- DSCR
- —
- Eligible?
- —
Short-term bridge; refi at stabilization.
Listing history 20 events
-
2026-06-19days on market $699,900 Active 88 DOM
-
2026-06-18days on market $699,900 Active 87 DOM
-
2026-06-17days on market $699,900 Active 86 DOM
-
2026-06-16days on market $699,900 Active 85 DOM
-
2026-06-15days on market $699,900 Active 84 DOM
-
2026-06-14days on market $699,900 Active 82 DOM
-
2026-06-13days on market $699,900 Active 81 DOM
-
2026-06-10days on market $699,900 Active 79 DOM
-
2026-06-09days on market $699,900 Active 78 DOM
-
2026-06-08days on market $699,900 Active 77 DOM
-
2026-06-07days on market $699,900 Active 76 DOM
-
2026-06-05days on market $699,900 Active 73 DOM
-
2026-06-02days on market $699,900 Active 71 DOM
-
2026-06-01days on market $699,900 Active 70 DOM
-
2026-05-31days on market $699,900 Active 69 DOM
-
2026-05-30days on market $699,900 Active 68 DOM
-
2026-04-11price $699,900
-
2026-03-23$775,000 Active
-
2025-07-09price $875,000
-
2025-03-15$925,000 Active
ⓘ Source: listings_history table (triggers on properties + properties_extension) + one-shot
backfill from property_details.listing_events for pre-trigger history.
Climate risk First Street
- Flood 1/10 Low FEMA zone X (unshaded) · 0% chance over 30 yrs
- Wildfire 5/10 Major
- Heat 5/10 Major 7 d/yr ≥103°F today · 18 d/yr by 30 yrs out
- Wind 2/10 Low 0% chance of damaging wind over 30 yrs
- Air quality 2/10 Low 2 unhealthy d/yr today · 2 by 30 yrs out
Nearby sold comps map
Loading sold comps map…
Walkable amenities ~0.75 mi
Loading nearby amenities…
Taxation est. · year 1
- Rental income
- $97,008
- − Mortgage interest
- −$39,205
- − Property taxes
- −$10,498
- − Insurance
- −$3,500
- − Repairs & maintenance
- −$7,761
- − Management
- −$7,761
- − Depreciation
- −$20,361
- Taxable income
- $7,923
- Est. tax owed @ 24.0%
- −$1,901
- After-tax cash flow
- $16,693/yr
For passive investors: Depreciation is non-cash, so a rental often shows a tax loss while cash-flowing — sheltering income. Rental losses are passive: they offset passive income freely, and up to $25,000/yr can offset ordinary (W-2) income if you actively participate and your MAGI is under $100k (phasing out to $0 by $150k); unused losses carry forward. On sale, claimed depreciation is recaptured at up to 25%, and gains may owe capital-gains tax (a 1031 exchange can defer both). Figures are a year-1 estimate at your 24.0% rate — not tax advice; consult a CPA.
Condition & rehab AI · 13 photos
This multi-family property is in good condition with minimal repairs needed. It offers a good investment opportunity with potential for value increase through minor updates.
Value-add opportunities
- Both Paint touch-ups — Fresh paint enhances the curb appeal and interior aesthetics, improving both resale and rental value.
- Both Landscaping improvements — Aesthetic enhancements to the landscaping can increase the property's curb appeal and attract more tenants or buyers.
Renovation cost estimate screening
Value-add ROI direction
- Both Paint touch-ups — Fresh paint enhances the curb appeal and interior aesthetics, improving both resale and rental value. ↑
- Both Landscaping improvements — Aesthetic enhancements to the landscaping can increase the property's curb appeal and attract more tenants or buyers. ↑
ⓘ Cost ranges are severity-bucket heuristics (US national rule-of-thumb). Get contractor quotes + a written scope before underwriting a rehab budget.
Schools (NCES district)
- District
- Burke County Schools
- NCES district ID
- 3700480
- Math proficiency
- 43% ▼ -2.00%
- Reading proficiency
- 47% ▬ 0.00%
- Median HH income
- $38,342
- Composite
- 37.51/100
- National rank
- #4400
- State rank
- #89 of 178 in NC
Livability — Morganton
- Score
- 69/100
- State rank
- #149
- US rank
- #8307
Category grades
Schools grade is shown separately in the Schools card above.
Census & demographics
- County
- Burke County · 55,100 people
- City population
- 55,100
- Metro
- Hickory-Lenoir-Morganton, NC
- Population (ZIP)
- 55,100
- Household income
- $57,713
- Rent vs Own
- Severe rent burden
- 1145.0
Population outlook (Burke County) Hauer SSP2
- Today (2025)
- 86,552 people
- By 2030
- 84,123 · -2.8%
- By 2040
- 78,165 · -9.7%
- By 2050
- 71,099 · -17.9%
- By 2075
- 56,264 · -35.0%
- By 2100
- 44,742 · -48.3%
Race, ethnicity, and origin ACS 2023
- Neighborhood character
- Predominantly White (75%)
- Race & ethnicity
- White 75% Hispanic / Latino 11% Black 8% Two or more races 5% Asian 3% Native American 2%
- Hispanic origin (detail)
- Mexican 3%
- Common ancestry
- Slovak 2% Italian 2% Serbian 2%
- Foreign-born
- 7% · Canada, China
- Languages at home
- 87% English-only · Spanish 8% Other Asian/Pacific 1% Arabic 1%
Political lean MEDSL · Burke
- 2024 margin
- Solid R (+41.2) · D 29.0% · R 70.3%
- 2008→2024 swing
- -22.0pp toward R · 2008: -19.2pp · 2024: -41.2pp
- All cycles
- 2024: R+41.2 2020: R+40.1 2016: R+39.4 2012: R+23.6 2008: R+19.2
Not yet ingested
- Civics
- —
Market trends
- HPI YoY
- ▼ -55.07%
- Current HPI
- 362.0732
- Rent YoY
- —
- Metro
- Hickory-Lenoir-Morganton, NC
- State GDP YoY
- ▲ 3.28%
- F500 in state
- 26
Industry mix (Fortune 500 HQ in NC)
| Industry | F500 HQs | Revenue |
|---|---|---|
| Financial Services | 2 | $213B |
|
||
| Retail | 2 | $95B |
|
||
| Industrial Conglomerate | 1 | $38B |
|
||
| Metals / Steel | 1 | $35B |
|
||
| Utilities | 1 | $30B |
|
||
| Industrial Machinery | 1 | $19B |
|
||
Price history
-24.3% since first listed4 events — show timeline
- 2026-04-11 Price Changed $699,900 CANOPYMLS as Distributed by MLS Grid
- 2026-03-23 Listed $775,000 CANOPYMLS as Distributed by MLS Grid
- 2025-07-09 Price Changed $875,000 CANOPYMLS as Distributed by MLS Grid
- 2025-03-15 Listed $925,000 CANOPYMLS as Distributed by MLS Grid
Cash-flow waterfall
monthlySold comps — $/sqft
last 12 mo · ≤1 miLoading sold comps…