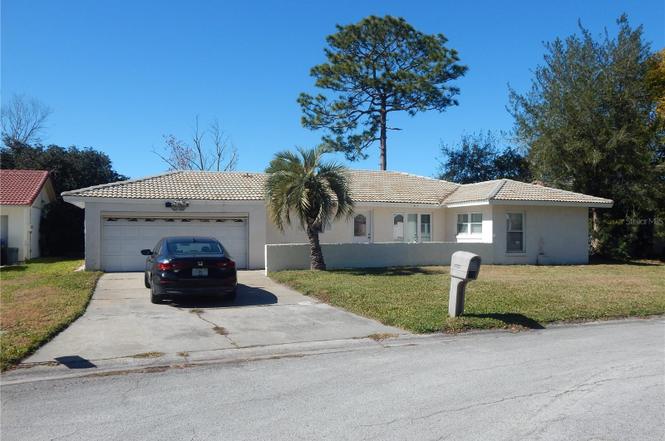
10640 Deergrass Ln · Williamsburg, FL
Flood risk 1/10 · Minimal
- FEMA flood zone
- X (unshaded)
- Chance of flooding over 30 yrs
- 0.0%
- Est. flood insurance / yr
- $507 – $1,088
Fire risk 4/10 · Minor
- Est. fire insurance / yr
- $947 – $1,759
Heat risk 9/10 · Severe
- Hot days now (above 108°F)
- 7 days/yr
- Hot days in 30 yrs
- 23 days/yr
Wind risk 9/10 · Severe
- Chance of severe wind over 30 yrs
- 99.0%
Air-quality risk 1/10 · Minimal
- Unhealthy air days now
- 0 days/yr
- Unhealthy air days in 30 yrs
- 0 days/yr
Risk factors via First Street. Map © Google.
Why this score? — see what drove the C- grade
The composite is a weighted blend of 9 inputs, each scored 0–100. Each bar is that input's sub-score; the figure is the points it added to the 100-point composite (weight × sub-score).
- ARV discount +15.0/15.0
- Cash flow +11.3/30.0
- Appreciation +5.1/10.0
- Livability +4.2/5.0
- Schools +4.1/10.0
- DSCR +3.3/10.0
- 1% rule +2.6/10.0
- Condition / age +2.5/5.0
- Rent growth +1.7/5.0
$299,900
🖨 Deal sheet (PDF) 📄 Offer letter ✓ Due diligence
Listing remarks
Here is your opportunity to get into a Williamsburg home at a great price. This is one of the few 2 bed 2 bath home with a 2 car garage. This is one of the original Miller homes that started the village. Home will need some updating but has great potential to be a wonderful starter or retirement home. Rear porch has been updated with windows and tile floor with newer windows in the front of the home and a large open front paved porch. This is also a possible flip for you flippers looking to do a complete rehab.
Key facts
- Updated windows
- Rear porch
- 7,000 sq ft lot
Tags
Property features AI
Finance
- Other: Pets allowed; Directions available
- Financial info: Lease restrictions apply
- HOA & community: Has HOA; monthly fee of $107; HOA includes pool and recreational facilities; Community clubhouse, tennis courts, deed restrictions, vehicle restrictions, no truck/RV/motorcycle parking; Association requires membership; association contact listed as office manager
Exterior
- Parking: Attached 2-car garage with garage door opener
- Utilities: Public water; Public sewer; Cable available; Electricity connected; Natural gas connected; Underground utilities
- Home design: Single-family residence; One story; Entry faces east; Planned unit development
- Construction: Block and stucco construction; Tile roof; Slab foundation; Built with living area reported (public records)
- Exterior features: Front porch; Sliding doors; Mature landscaping; Located on a cul-de-sac; Level lot; Paved, public-maintained road
Interior
- Kitchen: Dishwasher; Disposal; Range; Refrigerator; Gas water heater
- Bedrooms: 2 bedrooms
- Flooring: Carpet; Ceramic tile
- Bathrooms: 2 full bathrooms
- Heating & cooling: Natural gas heating; Central air conditioning
- Interior features: Ceiling fans; Living room/dining room combo; Walk-in closet(s); Window treatments; Aluminum window frames
- Laundry & utility: Washer; Dryer; Laundry area in garage
Neighborhood map
What this means for you Summary
Snapshot
- This is a 2-bed/2.0-bath single-family listed at $300k.
Deal economics
- At list price, monthly cash flow is $-107 ($-1k/yr) — negative.
- To cash-flow at today's rent, offer at most $281k (6.3% below list).
- To meet the 1% rule (rent ≥ 1% of price), the offer needs to be $229k (23.8% below list).
- Recommended offer: $229k (23.8% below list) — sets the bar for 1% rule.
- Cap rate 5.9% vs local median 3.5% in Williamsburg — top-decile yield for the area; either an underpriced asset or a hidden risk that comps aren't pricing in. Stress-test before assuming the spread holds.
Location & tenants
- Location reads 85/100 on livability (#29 in FL, #608 nationally) — a professional / high-income tenant draw. Strengths: housing A+, health & safety A+, crime A; Watch: amenities D.
- Orange (suburban): math 46% / reading 51% proficiency, ranked #43 of 73 in FL (top 59%) — families likely to look elsewhere, expect single-tenant / working-renter base with shorter leases.
- Zoned schools: Sunshine Elementary (math 41% / reading 43%, grade F, #1,403 of 2,144 statewide, top 67%, 949 students, 41% FRL); Freedom Middle (math 43% / reading 43%, grade D-, #331 of 571 statewide, top 59%, 1,159 students, 44% FRL); Lake Buena Vista High School (1,714 students, 49% FRL).
- Market conditions: Rents falling (-3.2%/yr); 281 active listings in the ZIP; 21 comparable units currently listed for rent nearby; rentals at typical pace (median 16d on market — plan ~3-4 weeks tenant-placement turnaround); 8,053 units permitted in Orange County in 2024 (3,133 in 5+ unit buildings).
- This rent runs 40% of the median local income ($69k/yr) — at the standard rent-burdened threshold; future hikes will face affordability resistance.
Forward outlook
- In year one you build about $3k of equity ($2k loan paydown + $890 appreciation (0.3% local appreciation)).
- Orange County population projected at +52% by 2050 — long-run rental-demand tailwind backs the buy-and-hold thesis.
- By year 9, paydown + projected appreciation supports a ~$32k cash-out refi (75% LTV) — recoverable capital for the next deal without selling this one.
Negotiation context
- It's been on market 139 days — a 12% lower offer ($264k) is reasonable based on typical stale-listing flexibility.
- Current owner paid $37k; list at $300k implies a 713% gain — meaningful room to come down on a strong offer.
Risks & watch-outs
- Climate carrying-cost: severe wind risk, 99% chance of damaging wind over 30y; extreme-heat days projected 7→23/yr by 2055 (HVAC capex compounding) — expect insurance premiums to compound above CPI over the hold.
Questions for the listing agent
- What do current leases actually rent for vs. the listed asking? Can we see a recent rent roll and the last 12 months of T-12 income?
- It's been on market 139 days. Have you received any prior offers? Is the seller open to a 24% concession, seller financing, or rate buy-down credit?
- Built in 1978 — when were the roof, HVAC, electrical panel, plumbing, and water heater last replaced?
- What does the HOA fee cover, when was the last increase, and are there any pending special assessments or reserve-fund shortfalls?
- Why hasn't it sold? Are there any deal-killer items the seller is aware of (foundation, flood, title, zoning, code violations)?
- Is there a deadline driving the sale (1031 exchange, divorce, estate, relocation)? That informs how much negotiation room exists.
- Schools are F-rated, which usually means shorter tenancies and higher turnover. Who's the typical renter profile here, and what's been the actual vacancy rate?
- What's the average days-on-market for RENTAL listings here right now (not sales)? A rising rental-DOM trend means longer vacancies and softer asking-rent achievability than the comps imply.
- What's the recent tenant-quality profile in this submarket — average credit score on applications, eviction rate, late-payment / NSF rate, and stable-employment percentage? A property-management company in the area should have these aggregated.
- How much new for-sale + rental construction is in the pipeline within 1–3 miles? Heavy new supply typically softens prices + rents 12–24 months out; constrained supply supports both.
Investment metrics
- 1% rule
- 0.76% ✗
- Cap rate
- 5.86%
- Cash-on-cash
- -1.53%
- DSCR
- 0.93
- GRM
- 10.9
CMA / ARV
- ARV (on-the-fly)
- $372,006
- Comps found
- 12
Show comp detail 12 sales within ~0.75 mi
| Address | Dist | Beds/Ba | Sqft | Sold | Price | $/sf | Match |
|---|---|---|---|---|---|---|---|
| 5772 Arnold Zlotoff Dr | 0.38mi | 3/2.0 (+1) | 1,645 (+10%) | 8mo | $363,000 | $221 | 54 |
| 4901 Lindsay Ct | 0.51mi | 3/2.0 (+1) | 1,576 (+6%) | 11mo | $415,000 | $263 | 53 |
| 5760 Arnold Zlotoff Dr | 0.41mi | 3/2.0 (+1) | 1,607 (+8%) | 12mo | $400,000 | $249 | 53 |
| 4807 Loretta Ln | 0.58mi | 3/2.0 (+1) | 1,515 (+1%) | 16mo | $390,000 | $257 | 52 |
| 11231 Scenic View Ln | 0.64mi | 3/2.0 (+1) | 1,414 (-5%) | 5mo | $390,000 | $276 | 52 |
| 10131 Allenby Ct | 0.56mi | 2/2.0 | 1,312 (-12%) | 10mo | $325,000 | $248 | 46 |
| 5507 Memorial Dr | 0.59mi | 3/2.0 (+1) | 1,554 (+4%) | 20mo | $361,800 | $233 | 45 |
| 10301 LA Guardia Ct | 0.59mi | 3/2.0 (+1) | 1,540 (+3%) | 22mo | $383,500 | $249 | 44 |
| 5648 Parkview Lake Dr | 0.44mi | 2/2.0 | 1,314 (-12%) | 20mo | $370,000 | $282 | 43 |
| 10108 Matchlock Dr | 0.60mi | 2/2.0 | 1,680 (+12%) | 12mo | $345,000 | $205 | 41 |
| 5837 Plumtree Ct | 0.73mi | 2/2.0 | 1,615 (+8%) | 24mo | $395,000 | $245 | 32 |
| 5715 Parkview Lake Dr | 0.55mi | 3/2.0 (+1) | 1,685 (+13%) | 20mo | $412,500 | $245 | 32 |
Match score weights: distance 35% · size 25% · config 20% · recency 20%. Top-matched comps best support the ARV.
Projected returns pro-forma
0.3% appreciation · 0.0% rent growth · sell at horizon
- IRR
- -4.6%
- Equity multiple
- 0.78×
- Total profit
- $-18,154
- Equity at exit
- $91,559
- IRR
- -0.7%
- Equity multiple
- 0.92×
- Total profit
- $-6,589
- Equity at exit
- $113,697
Cash invested: $83,972 (down + closing). Projections, not guarantees.
Landlord ↔ Tenant lean methodology
- Overall (STATE)
- 87 Strongly Landlord-Friendly
- State Florida
- 87 Strongly Landlord-Friendly · R+3
- County
- — inherits STATE
- City
- — inherits STATE
ZIP-level market 32821
- Home prices YoY
- 0.1%
- Rents YoY
- -3.2%
- Active inventory
- 281
- Price-to-rent
- 10.9×
Monthly cashflow live
- Estimated rent
- $2,286 high interval (Pro) →
- Mortgage (P&I)
- −$1,573
- Tax from tax record
- −$109 /mo · $1,303/yr
- Insurance
- −$125
- HOA
- −$107
- Vacancy / Maint / Mgmt
- −$480
- Net cashflow
- $-107
Break-even live
Sensitivity live
| Price | -10% $63 | -5% $-22 | +0% $-107 | +5% $-192 | +10% $-277 |
|---|---|---|---|---|---|
| Rent | -10% $-288 | -5% $-197 | +0% $-107 | +5% $-17 | +10% $73 |
| Rate | -1.0pp $44 | -0.5pp $-31 | base $-107 | +0.5pp $-185 | +1.0pp $-264 |
UW: 25.0% down · 7.5% · 30yr · 1.5% tax · 5.0% vac · 8.0% maint · 8.0% mgmt
Financing live
Cash to close
- Down payment
- $74,975
- Closing costs
- $8,997
- Reserves months
- —
- Total cash needed
- —
Loan-product check · same deal, 3 products live
Conventional
25% down · 7.5% · 30yr
- Down + closing
- —
- Monthly P&I
- —
- Monthly cashflow
- —
- DSCR
- —
- Eligible?
- —
Personal DTI + credit; lowest rate.
DSCR
20% down · 8.5% · 30yr
- Down + closing
- —
- Monthly P&I
- —
- Monthly cashflow
- —
- DSCR
- —
- Eligible?
- —
No personal income docs; deal must DSCR.
Hard money
10% down · 12.0% · 12mo
- Down + closing
- —
- Monthly P&I
- —
- Monthly cashflow
- —
- DSCR
- —
- Eligible?
- —
Short-term bridge; refi at stabilization.
Rent comps 21 comps
| Address | Beds | Baths | Sqft | Rent | $/sqft | DOM | Units | Dist |
|---|---|---|---|---|---|---|---|---|
| 10606 Whitman Cir Orlando, FL | 2.0 | 2.0 | 1254 | $2,500 | $1.99 | 4d | 1 | 0.24mi |
| 5523 Westbrook Dr Orlando, FL | 3.0 | 2.0 | 1589 | $2,150 | $1.35 | 26d | 1 | 0.27mi |
| 10508 Montpelier Cir Orlando, FL | 2.0 | 2.0 | 1268 | $2,600 | $2.05 | 20d | 1 | 0.33mi |
| 5033 Loyola Ln Orlando, FL | 3.0 | 2.0 | 1873 | $2,350 | $1.25 | 24d | 1 | 0.35mi |
| 5673 Parkview Lake Dr Orlando, FL | 3.0 | 2.0 | 1708 | $2,850 | $1.67 | 9d | 1 | 0.48mi |
| 4825 Loretta Ln Orlando, FL | 2.0 | 2.0 | 1070 | $2,500 | $2.34 | 16d | 1 | 0.57mi |
| 5556 Memorial Dr Orlando, FL | 2.0 | 2.0 | 1070 | $1,275 | $1.19 | 15d | 1 | 0.59mi |
| 10010 Gannon Ln Orlando, FL | 2.0 | 2.0 | 1312 | $2,600 | $1.98 | 20d | 1 | 0.63mi |
| 4905 Goucher Ln Orlando, FL | 3.0 | 2.0 | 1576 | $2,600 | $1.65 | 24d | 1 | 0.72mi |
| 11805 Scarecrow Ln Orlando, FL | 2.0 | 2.0 | 1302 | $2,200 | $1.69 | 26d | 1 | 0.98mi |
| 4126 Breakview Dr #30401 Orlando, FL | 3.0 | 2.0 | 1447 | $2,600 | $1.80 | 26d | 1 | 1.03mi |
| 6000 Paradiso Grande Blvd Orlando, FL | 1.0–3.0 | 1.0–2.0 | 1305 | $2,836 | $2.17 | 9d | 21 | 1.09mi |
| 4410 Bar Harbor Dr Orlando, FL | 2.0 | 2.0 | 957 | $2,250 | $2.35 | 26d | 1 | 1.19mi |
| 4801 Tidecrest Ave Orlando, FL | 3.0 | 3.5 | 1600 | $2,050 | $1.28 | 5d | 1 | 1.25mi |
| 8000 Cool Breeze Dr #105 Orlando, FL | 3.0 | 3.5 | 1746 | $2,399 | $1.37 | 26d | 1 | 1.34mi |
| 5716 Delano Ln Orlando, FL | 3.0 | 2.0 | 1215 | $2,580 | $2.12 | 9d | 1 | 1.36mi |
| 10107 Ancora Cir Orlando, FL | 1.0–3.0 | 1.0–2.0 | 1013 | $2,074 | $2.05 | 0d | 27 | 1.37mi |
| 9707 Mia Cir Orlando, FL | 1.0–3.0 | 1.0–2.0 | 1014 | $2,244 | $2.21 | 0d | 35 | 1.43mi |
| 9703 Avellino Ave Orlando, FL | 3.0 | 1.0–2.0 | 967 | $2,373 | $2.45 | 0d | 43 | 1.48mi |
| 6701 Westwood Blvd Orlando, FL | 1.0–2.0 | 1.0–2.0 | 735 | $1,699 | $2.31 | 5d | 6 | 1.48mi |
| 10149 Arise Loop Orlando, FL | 3.0 | 1.0–2.0 | 1014 | $2,791 | $2.75 | 0d | 85 | 1.49mi |
HOA detail
- Monthly dues
- $107 · $1,284/yr
Listing history 18 events
-
2026-06-21days on market $299,900 Active 139 DOM
-
2026-06-18days on market $299,900 Active 136 DOM
-
2026-06-17days on market $299,900 Active 135 DOM
-
2026-06-16days on market $299,900 Active 134 DOM
-
2026-06-15pricedays on market $299,900 Active 133 DOM
-
2026-06-13days on market $339,900 Active 131 DOM
-
2026-06-13days on market $339,900 Active 130 DOM
-
2026-06-09days on market $339,900 Active 127 DOM
-
2026-06-08days on market $339,900 Active 126 DOM
-
2026-06-07days on market $339,900 Active 125 DOM
-
2026-06-04days on market $339,900 Active 122 DOM
-
2026-06-03days on market $339,900 Active 121 DOM
-
2026-06-02days on market $339,900 Active 120 DOM
-
2026-06-02days on market $339,900 Active 119 DOM
-
2026-05-31days on market $339,900 Active 118 DOM
-
2026-02-02$339,900 Active
-
1978-12-01soldstatus $36,900
-
1978-07-01soldstatus $30,200
ⓘ Source: listings_history table (triggers on properties + properties_extension) + one-shot
backfill from property_details.listing_events for pre-trigger history.
Tax reassessment forecast FL · Resets to sale price
- Current annual tax
- $1,303 · $109/mo
- Projected year-2 tax
- $2,489 · $207/mo
- Expected delta
- +$1,186/yr (+$99/mo · 91.0%)
ⓘ Screening estimate from a state-policy table — verify with the county assessor before closing.
Climate risk First Street
- Flood 1/10 Low FEMA zone X (unshaded) · 0% chance over 30 yrs
- Wildfire 4/10 Moderate
- Heat 9/10 Extreme 7 d/yr ≥108°F today · 23 d/yr by 30 yrs out
- Wind 9/10 Extreme 99% chance of damaging wind over 30 yrs
- Air quality 1/10 Low 0 unhealthy d/yr today · 0 by 30 yrs out
Nearby sold comps map
Loading sold comps map…
Walkable amenities ~0.75 mi
Loading nearby amenities…
Taxation est. · year 1
- Rental income
- $27,434
- − Mortgage interest
- −$16,799
- − Property taxes
- −$1,303
- − Insurance
- −$1,500
- − Repairs & maintenance
- −$2,195
- − Management
- −$2,195
- − HOA
- −$1,284
- − Depreciation
- −$8,724
- Taxable loss
- −$6,565
- Est. tax savings @ 24.0%
- +$1,576
- After-tax cash flow
- $290/yr
For passive investors: Depreciation is non-cash, so a rental often shows a tax loss while cash-flowing — sheltering income. Rental losses are passive: they offset passive income freely, and up to $25,000/yr can offset ordinary (W-2) income if you actively participate and your MAGI is under $100k (phasing out to $0 by $150k); unused losses carry forward. On sale, claimed depreciation is recaptured at up to 25%, and gains may owe capital-gains tax (a 1031 exchange can defer both). Figures are a year-1 estimate at your 24.0% rate — not tax advice; consult a CPA.
Schools (NCES district)
- District
- Orange
- NCES district ID
- 1201440
- Math proficiency
- 46% ▼ -9.00%
- Reading proficiency
- 51% ▼ -2.00%
- Median HH income
- $49,350
- Composite
- 41.47/100
- National rank
- #3461
- State rank
- #43 of 73 in FL
Livability — Williamsburg
- Score
- 85/100
- State rank
- #29
- US rank
- #608
Category grades
Schools grade is shown separately in the Schools card above.
Census & demographics
- Census place
- Williamsburg, FL
- County
- Orange County · 1,471,359 people
- Metro
- Orlando-Kissimmee-Sanford, FL
- Population (ZIP)
- 26,161
- Household income
- $69,348
- Rent vs Own
- Severe rent burden
- 1840.0
Population outlook (Orange County) Hauer SSP2
- Today (2025)
- 1,618,226 people
- By 2030
- 1,787,404 · +10.5%
- By 2040
- 2,125,621 · +31.4%
- By 2050
- 2,454,016 · +51.6%
- By 2075
- 3,173,711 · +96.1%
- By 2100
- 3,607,781 · +122.9%
Race, ethnicity, and origin ACS 2023
- Neighborhood character
- Diverse neighborhood (Simpson 0.65)
- Race & ethnicity
- White 43% Hispanic / Latino 41% Two or more races 19% Black 6% Asian 3% Pacific Islander 1% Native American 1%
- Hispanic origin (detail)
- Mexican 3% Puerto Rican 11% Cuban 1% Dominican 4%
- Common ancestry
- Romanian 3% Lithuanian 2% Estonian 2%
- Foreign-born
- 29% · Canada, Jamaica, China
- Languages at home
- 58% English-only · Spanish 32% Other Indo-European 4% Other Asian/Pacific 2%
Political lean MEDSL · Orange
- 2024 margin
- D (+13.6) · D 56.1% · R 42.5% · Other 1.3%
- 2008→2024 swing
- -5.0pp toward R · 2008: 18.6pp · 2024: 13.6pp
- All cycles
- 2024: D+13.6 2020: D+23.1 2016: D+24.6 2012: D+18.2 2008: D+18.6
Not yet ingested
- Civics
- —
Market trends
- HPI YoY
- ▲ 0.30%
- Current HPI
- 300.2268
- Rent YoY
- ▼ -3.20%
- Metro
- Orlando-Kissimmee-Sanford, FL
- State GDP YoY
- ▲ 3.28%
- F500 in state
- 36
Industry mix (Fortune 500 HQ in FL)
| Industry | F500 HQs | Revenue |
|---|---|---|
| Industrial Technology | 2 | $29B |
|
||
| Insurance | 2 | $17B |
|
||
| Retail | 1 | $60B |
|
||
| Technology Distribution | 1 | $58B |
|
||
| Homebuilding | 1 | $35B |
|
||
| Technology Manufacturing | 1 | $35B |
|
||
Price history
+1025.5% since first listed3 events — show timeline
- 2026-02-02 Listed $339,900 Stellar MLS as Distributed by MLS Grid
- 1978-12-01 Sold (Public Records) $36,900 Public Records
- 1978-07-01 Sold (Public Records) $30,200 Public Records
Property tax history
+2.4%/yrLatest (2025): $1,303 · +12.6% YoY. Source: county tax records.
Cash-flow waterfall
monthlySold comps — $/sqft
last 12 mo · ≤1 miLoading sold comps…