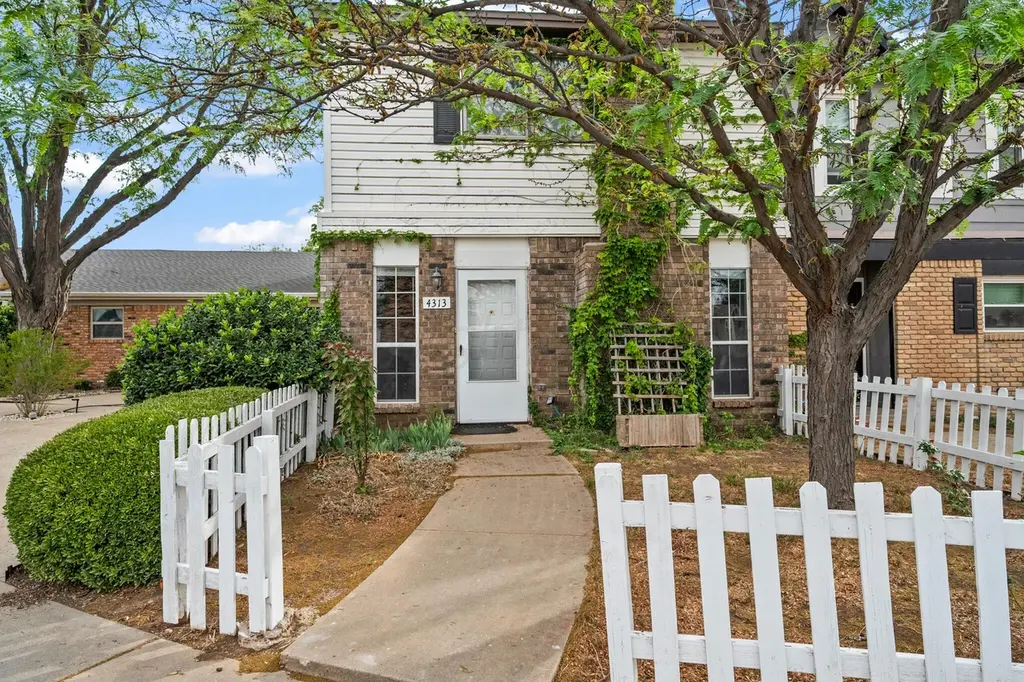
4313 Alicia Dr · Amarillo, TX
Flood risk 1/10 · Minimal
- FEMA flood zone
- X (unshaded)
- Chance of flooding over 30 yrs
- 0.0%
- Est. flood insurance / yr
- $507 – $1,088
Fire risk 3/10 · Minor
- Est. fire insurance / yr
- $1,222 – $2,270
Heat risk 4/10 · Minor
- Hot days now (above 97°F)
- 7 days/yr
- Hot days in 30 yrs
- 18 days/yr
Wind risk 2/10 · Minimal
- Chance of severe wind over 30 yrs
- —
Air-quality risk 2/10 · Minimal
- Unhealthy air days now
- 1 days/yr
- Unhealthy air days in 30 yrs
- 1 days/yr
Risk factors via First Street. Map © Google.
Why this score? — see what drove the C- grade
The composite is a weighted blend of 9 inputs, each scored 0–100. Each bar is that input's sub-score; the figure is the points it added to the 100-point composite (weight × sub-score).
- ARV discount +15.0/15.0
- Cash flow +14.1/30.0
- DSCR +4.3/10.0
- 1% rule +4.0/10.0
- Rent growth +3.8/5.0
- Schools +3.6/10.0
- Livability +3.3/5.0
- Condition / age +2.5/5.0
- Appreciation +0.0/10.0
$226,000
🖨 Deal sheet (PDF) 📄 Offer letter ✓ Due diligence
Listing remarks
Spacious 3-bedroom, 2-bath, 2-car garage townhome featuring a formal dining area, cozy fireplace, and an inviting breakfast nook. The kitchen comes equipped with a microwave, stove, and dishwasher for added convenience. Enjoy the private patio with access from both the isolated master bedroom and the breakfast nook, creating the perfect space for relaxing or entertaining. Comfortable layout with thoughtful design throughout.
Key facts
- Thoughtful design
- Private patio
- Formal dining area
Tags
Property features AI
Finance
- Other: Zoning: 0200 - SW Amarillo in City Limits
Exterior
- Parking: Attached 2-car garage
- Utilities: Public water; Public sewer
- Home design: Single-family residence; Two levels; Residential property
- Construction: Slab foundation
- Exterior features: Wood fencing
Interior
- Kitchen: Range; Dishwasher; Microwave
- Bathrooms: Two full bathrooms
- Heating & cooling: Electric cooling
- Interior features: Fireplace in the living room; Range; Dishwasher; Microwave
Neighborhood map
What this means for you Summary
Snapshot
- This is a 3-bed/2.0-bath townhouse listed at $226k.
Deal economics
- At list price, monthly cash flow is $32 ($381/yr) — positive.
- The deal already cash-flows at list — no discount required.
- To meet the 1% rule (rent ≥ 1% of price), the offer needs to be $203k (10.0% below list).
- Recommended offer: $203k (10.0% below list) — sets the bar for 1% rule.
Location & tenants
- Location reads 66/100 on livability (#624 in TX) — a middle-class / working-renter tenant base. Strengths: cost of living A+, housing A+; Watch: amenities C-, crime F, commute F.
- Amarillo ISD (urban): math 44% / reading 41% proficiency, ranked #336 of 826 in TX (top 41%) — families likely to look elsewhere, expect single-tenant / working-renter base with shorter leases.
- Zoned schools: Puckett El (math 62% / reading 62%, grade B, #321 of 4,322 statewide, top 8%, 344 students, 32% FRL); Bonham Middle (math 61% / reading 49%, grade B-, #248 of 1,662 statewide, top 15%, 867 students, 37% FRL); Amarillo H S (math 55% / reading 64%, grade C+, #275 of 1,632 statewide, top 19%, 2,170 students, 34% FRL) — zoned schools average 34% FRL vs 58% district-wide (24 pts lower); this property's tenant base skews higher-income than the district average.
- Zoned-school proficiency averages 59% at this address vs 42% district-wide (+16 pts) — the actual schools serving this property are materially stronger than the Amarillo ISD average implies; a family-tenant draw the district grade alone would hide.
- Market conditions: Rents rising fast (+5.2%/yr); 157 active listings in the ZIP; 4 comparable units currently listed for rent nearby; rentals lingering (median 44d on market — plan ~5-8 weeks vacancy on turnover, expect pricing pressure); 50% of comp listings sitting > 30 days — soft ceiling on asking rent; 45 units permitted in Randall County in 2024 (0 in 5+ unit buildings).
- This rent runs 35% of the median local income ($70k/yr) — at the standard rent-burdened threshold; future hikes will face affordability resistance.
Forward outlook
- Local home prices are declining (-3.0%/yr); year-one equity from $2k of loan paydown is wiped out by about $7k of value loss. Plan a longer hold.
- Randall County population projected at +36% by 2050 — long-run rental-demand tailwind backs the buy-and-hold thesis.
Negotiation context
- It's been on market 33 days — a 3% lower offer ($219k) is reasonable based on typical stale-listing flexibility.
- 2 sale attempts with the ask held roughly flat each time — persistent listings suggest the price (not the market) is what's stuck; bring a comps-based counter.
Questions for the listing agent
- It's been on market 33 days. Have you received any prior offers? Is the seller open to a 10% concession, seller financing, or rate buy-down credit?
- Is there a deadline driving the sale (1031 exchange, divorce, estate, relocation)? That informs how much negotiation room exists.
- Schools are D-rated, which usually means shorter tenancies and higher turnover. Who's the typical renter profile here, and what's been the actual vacancy rate?
- Crime grade is F in this area — have there been break-ins, vandalism, or insurance claims at this property in the last 3 years? What carrier currently insures it and at what premium?
- What's the average days-on-market for RENTAL listings here right now (not sales)? A rising rental-DOM trend means longer vacancies and softer asking-rent achievability than the comps imply.
- What's the recent tenant-quality profile in this submarket — average credit score on applications, eviction rate, late-payment / NSF rate, and stable-employment percentage? A property-management company in the area should have these aggregated.
- How much new for-sale + rental construction is in the pipeline within 1–3 miles? Heavy new supply typically softens prices + rents 12–24 months out; constrained supply supports both.
Investment metrics
- 1% rule
- 0.90% ✗
- Cap rate
- 6.46%
- Cash-on-cash
- 0.60%
- DSCR
- 1.03
- GRM
- 9.3
CMA / ARV
- ARV (median comp)
- $289,538
- List price
- $226,000
- Delta
- -21.94%
- Verdict
- UNDERPRICED
- Comps
- 1 within 2.0 mi
Projected returns pro-forma
-3.0% appreciation · 5.24% rent growth · sell at horizon
- IRR
- -12.8%
- Equity multiple
- 0.53×
- Total profit
- $-29,876
- Equity at exit
- $33,697
- IRR
- -0.7%
- Equity multiple
- 0.95×
- Total profit
- $-3,130
- Equity at exit
- $19,540
Cash invested: $63,280 (down + closing). Projections, not guarantees.
Landlord ↔ Tenant lean methodology
- Overall (STATE)
- 87 Strongly Landlord-Friendly
- State Texas
- 87 Strongly Landlord-Friendly · R+5
- County
- — inherits STATE
- City
- — inherits STATE
ZIP-level market 79109
- Rents YoY
- 5.2%
- Active inventory
- 157
- Price-to-rent
- 9.3×
Monthly cashflow live
- Estimated rent
- $2,033 medium interval (Pro) →
- Mortgage (P&I)
- −$1,185
- Tax from tax record
- −$295 /mo · $3,542/yr
- Insurance
- −$94
- HOA
- −$0
- Vacancy / Maint / Mgmt
- −$427
- Net cashflow
- $32
Break-even live
Sensitivity live
| Price | -10% $160 | -5% $96 | +0% $32 | +5% $-32 | +10% $-96 |
|---|---|---|---|---|---|
| Rent | -10% $-129 | -5% $-49 | +0% $32 | +5% $112 | +10% $192 |
| Rate | -1.0pp $146 | -0.5pp $89 | base $32 | +0.5pp $-27 | +1.0pp $-86 |
UW: 25.0% down · 7.5% · 30yr · 1.5% tax · 5.0% vac · 8.0% maint · 8.0% mgmt
Financing live
Cash to close
- Down payment
- $56,500
- Closing costs
- $6,780
- Reserves months
- —
- Total cash needed
- —
Loan-product check · same deal, 3 products live
Conventional
25% down · 7.5% · 30yr
- Down + closing
- —
- Monthly P&I
- —
- Monthly cashflow
- —
- DSCR
- —
- Eligible?
- —
Personal DTI + credit; lowest rate.
DSCR
20% down · 8.5% · 30yr
- Down + closing
- —
- Monthly P&I
- —
- Monthly cashflow
- —
- DSCR
- —
- Eligible?
- —
No personal income docs; deal must DSCR.
Hard money
10% down · 12.0% · 12mo
- Down + closing
- —
- Monthly P&I
- —
- Monthly cashflow
- —
- DSCR
- —
- Eligible?
- —
Short-term bridge; refi at stabilization.
Rent comps 4 comps
| Address | Beds | Baths | Sqft | Rent | $/sqft | DOM | Units | Dist |
|---|---|---|---|---|---|---|---|---|
| 7111 Imperial Trl Amarillo, TX | 3.0 | 2.0 | 1970 | $2,150 | $1.09 | 44d | 1 | 1.15mi |
| 7603 Canode Dr Amarillo, TX | 3.0 | 2.0 | 1739 | $2,200 | $1.27 | 14d | 1 | 1.23mi |
| 5101 Harvard St Amarillo, TX | 4.0 | 2.5 | 2339 | $2,275 | $0.97 | 21d | 1 | 1.43mi |
| 7727 Cervin Dr Amarillo, TX | 2.0 | 2.0 | 1696 | $2,200 | $1.30 | 44d | 1 | 1.43mi |
Listing history 16 events
-
2026-06-18days on market $226,000 Active 33 DOM
-
2026-06-17days on market $226,000 Active 32 DOM
-
2026-06-16days on market $226,000 Active 31 DOM
-
2026-06-15days on market $226,000 Active 30 DOM
-
2026-06-14days on market $226,000 Active 28 DOM
-
2026-06-13days on market $226,000 Active 27 DOM
-
2026-06-10days on market $226,000 Active 25 DOM
-
2026-06-09days on market $226,000 Active 24 DOM
-
2026-06-08days on market $226,000 Active 23 DOM
-
2026-06-07days on market $226,000 Active 22 DOM
-
2026-06-03days on market $226,000 Active 18 DOM
-
2026-06-02days on market $226,000 Active 17 DOM
-
2026-06-01status $226,000 Active 16 DOM
-
2026-05-07$226,000 Active 428-char remark
-
2013-05-21soldstatus
-
2006-10-31soldstatus
ⓘ Source: listings_history table (triggers on properties + properties_extension) + one-shot
backfill from property_details.listing_events for pre-trigger history.
Tax reassessment forecast TX · Resets to sale price
- Current annual tax
- $3,542 · $295/mo
- Projected year-2 tax
- $4,136 · $345/mo
- Expected delta
- +$594/yr (+$50/mo · 16.8%)
ⓘ Screening estimate from a state-policy table — verify with the county assessor before closing.
Climate risk First Street
- Flood 1/10 Low FEMA zone X (unshaded) · 0% chance over 30 yrs
- Wildfire 3/10 Moderate
- Heat 4/10 Moderate 7 d/yr ≥97°F today · 18 d/yr by 30 yrs out
- Wind 2/10 Low
- Air quality 2/10 Low 1 unhealthy d/yr today · 1 by 30 yrs out
Nearby sold comps map
Loading sold comps map…
Walkable amenities ~0.75 mi
Loading nearby amenities…
Taxation est. · year 1
- Rental income
- $24,398
- − Mortgage interest
- −$12,660
- − Property taxes
- −$3,542
- − Insurance
- −$1,130
- − Repairs & maintenance
- −$1,952
- − Management
- −$1,952
- − Depreciation
- −$6,575
- Taxable loss
- −$3,411
- Est. tax savings @ 24.0%
- +$819
- After-tax cash flow
- $1,200/yr
For passive investors: Depreciation is non-cash, so a rental often shows a tax loss while cash-flowing — sheltering income. Rental losses are passive: they offset passive income freely, and up to $25,000/yr can offset ordinary (W-2) income if you actively participate and your MAGI is under $100k (phasing out to $0 by $150k); unused losses carry forward. On sale, claimed depreciation is recaptured at up to 25%, and gains may owe capital-gains tax (a 1031 exchange can defer both). Figures are a year-1 estimate at your 24.0% rate — not tax advice; consult a CPA.
Schools (NCES district)
- District
- Amarillo ISD
- NCES district ID
- 4808130
- Math proficiency
- 44% ▼ -9.00%
- Reading proficiency
- 41% ▼ -3.00%
- Median HH income
- $43,478
- Composite
- 35.96/100
- National rank
- #4798
- State rank
- #336 of 826 in TX
Livability — Amarillo
- Score
- 66/100
- State rank
- #624
- US rank
- #11876
Category grades
Schools grade is shown separately in the Schools card above.
Census & demographics
- Census place
- Amarillo, TX
- County
- Randall County · 137,351 people
- City population
- 185,802
- Metro
- Amarillo, TX
- Population (ZIP)
- 43,578
- Household income
- $70,435
- Rent vs Own
- Severe rent burden
- 1640.0
Population outlook (Randall County) Hauer SSP2
- Today (2025)
- 152,140 people
- By 2030
- 163,107 · +7.2%
- By 2040
- 184,999 · +21.6%
- By 2050
- 206,948 · +36.0%
- By 2075
- 260,204 · +71.0%
- By 2100
- 294,980 · +93.9%
Race, ethnicity, and origin ACS 2023
- Neighborhood character
- Predominantly White (70%)
- Race & ethnicity
- White 70% Hispanic / Latino 19% Two or more races 12% Black 5%
- Hispanic origin (detail)
- Mexican 16%
- Common ancestry
- Italian 3% Slovak 2% Lithuanian 2%
- Foreign-born
- 4% · Canada
- Languages at home
- 89% English-only · Spanish 9% Other Indo-European 1%
Political lean MEDSL · Randall
- 2024 margin
- Solid R (+60.4) · D 19.4% · R 79.8%
- 2008→2024 swing
- +2.3pp toward D · 2008: -62.7pp · 2024: -60.4pp
- All cycles
- 2024: R+60.4 2020: R+58.8 2016: R+65.1 2012: R+68.2 2008: R+62.7
Not yet ingested
- Civics
- —
Market trends
- HPI YoY
- ▼ -227.95%
- Current HPI
- 171.6795
- Rent YoY
- ▲ 5.24%
- Metro
- Amarillo, TX
- State GDP YoY
- ▲ 3.95%
- F500 in state
- 110
Industry mix (Fortune 500 HQ in TX)
| Industry | F500 HQs | Revenue |
|---|---|---|
| Energy | 16 | $1,198B |
|
||
| Technology | 5 | $198B |
|
||
| Engineering / Construction | 4 | $72B |
|
||
| Energy Services | 3 | $60B |
|
||
| Utilities | 3 | $41B |
|
||
| Healthcare | 2 | $330B |
|
||
Price history
5 events — show timeline
- 2026-06-01 Relisted — AARMLS
- 2026-05-23 Pending — AARMLS
- 2026-05-07 Listed $226,000 AARMLS
- 2013-05-21 Sold (Public Records) — Public Records
- 2006-10-31 Sold (Public Records) — Public Records
Property tax history
+3.4%/yrLatest (2025): $3,542 · +12.1% YoY. Source: county tax records.
Cash-flow waterfall
monthlySold comps — $/sqft
last 12 mo · ≤1 miLoading sold comps…