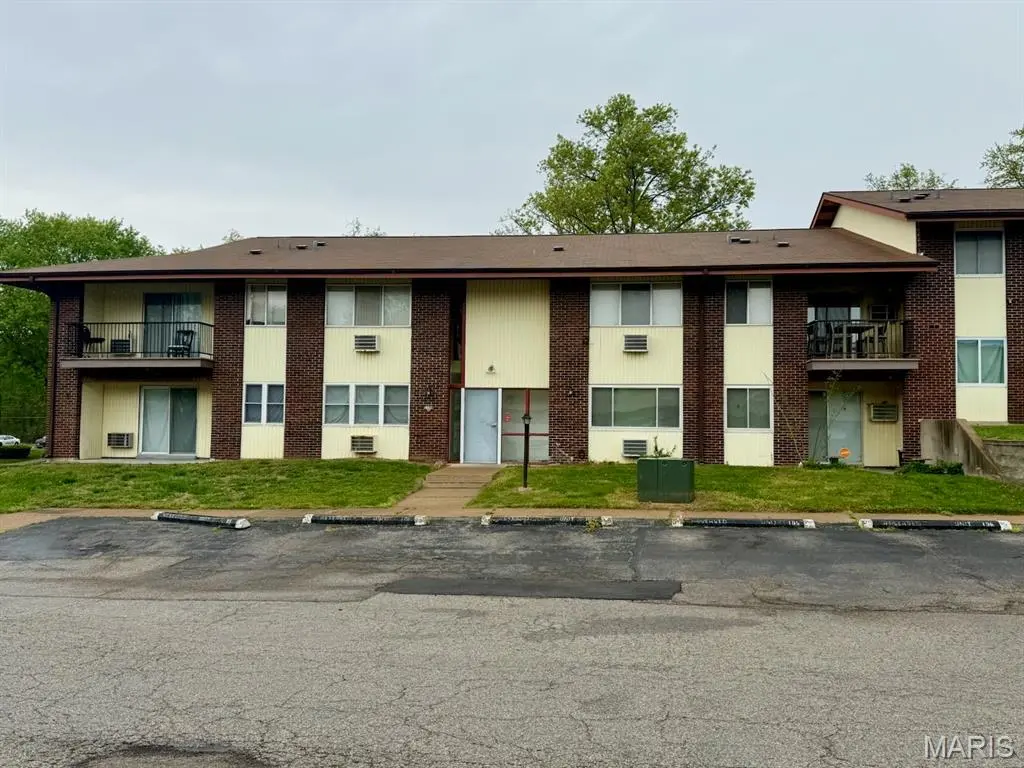
7596 Hazelcrest Dr Unit F · Hazelwood, MO
Flood risk 4/10 · Minor
- FEMA flood zone
- X (unshaded)
- Chance of flooding over 30 yrs
- 0.2%
- Est. flood insurance / yr
- $507 – $1,088
Fire risk 1/10 · Minimal
- Est. fire insurance / yr
- $1,054 – $1,958
Heat risk 5/10 · Moderate
- Hot days now (above 105°F)
- 7 days/yr
- Hot days in 30 yrs
- 22 days/yr
Wind risk 2/10 · Minimal
- Chance of severe wind over 30 yrs
- 1.0%
Air-quality risk 3/10 · Minor
- Unhealthy air days now
- 3 days/yr
- Unhealthy air days in 30 yrs
- 5 days/yr
Risk factors via First Street. Map © Google.
Why this score? — see what drove the C+ grade
The composite is a weighted blend of 9 inputs, each scored 0–100. Each bar is that input's sub-score; the figure is the points it added to the 100-point composite (weight × sub-score).
- Cash flow +30.0/30.0
- 1% rule +10.0/10.0
- DSCR +10.0/10.0
- Rent growth +3.6/5.0
- ARV discount +3.2/15.0
- Livability +3.1/5.0
- Condition / age +2.5/5.0
- Schools +1.2/10.0
- Appreciation +0.0/10.0
$53,000
🖨 Deal sheet (PDF) 📄 Offer letter ✓ Due diligence
Listing remarks MLS
Solid investment opportunity: an occupied one-bedroom, one-bathroom condo currently generating rental income. Ideal for investors looking to add a cash-flowing asset to their portfolio with no vacancy period. Tenant in place, income from day one.
Key facts
- $256 HOA
- Parking
- Built 1965
Neighborhood map
What this means for you Summary
Snapshot
- This is a 1-bed/1.0-bath condo listed at $53k.
Deal economics
- At list price, monthly cash flow is $225 ($3k/yr) — positive.
- The deal already cash-flows at list — no discount required.
- Meets the 1% rule at list price ($1k rent vs $53k).
- Recommended offer: $50k (6.0% below list) — sets the bar for market timing.
- Cap rate 11.4% vs local median 7.3% in Hazelwood — top-decile yield for the area; either an underpriced asset or a hidden risk that comps aren't pricing in. Stress-test before assuming the spread holds.
Location & tenants
- Location reads 62/100 on livability (#395 in MO) — a middle-class / working-renter tenant base. Strengths: cost of living A+, housing A+; Watch: crime F, amenities F, commute F.
- Ferguson-Florissant R-II (suburban): math 7% / reading 20% proficiency, ranked #311 of 324 in MO (top 96%) — low school quality limits family demand, transient renter base, plan for 1-2y turnover; 70% free/reduced lunch — lower-income household profile, screen leases tightly.
- Zoned schools: Combs Elementary (math 7% / reading 17%, grade F, #1,016 of 1,115 statewide, top 92%, 295 students, 99% FRL); Cross Keys Middle (math 5% / reading 10%, grade F, #379 of 391 statewide, top 97%, 625 students, 100% FRL); Mccluer North High (math 5% / reading 28%, grade F, #487 of 521 statewide, top 93%, 1,136 students, 100% FRL) — zoned schools average 99% FRL vs 70% district-wide (30 pts higher); higher-poverty schools than district average — tighter screening recommended.
- Market conditions: Rents rising fast (+4.5%/yr); 68 active listings in the ZIP; 3 comparable units currently listed for rent nearby; rentals at typical pace (median 24d on market — plan ~3-4 weeks tenant-placement turnaround); 920 units permitted in St. Louis County in 2024 (250 in 5+ unit buildings).
Forward outlook
- Local home prices are declining (-3.0%/yr); year-one equity from $366 of loan paydown is wiped out by about $2k of value loss. Plan a longer hold.
- At projected returns (-3.0% appreciation + 4.5% rent growth), your $15k cash investment doubles in ~6 years — after that, you're playing with house money.
Negotiation context
- It's been on market 65 days — a 6% lower offer ($50k) is reasonable based on typical stale-listing flexibility.
- 2 sale attempts with the ask held roughly flat each time — persistent listings suggest the price (not the market) is what's stuck; bring a comps-based counter.
- Current owner paid $25k; list at $53k implies a 112% gain — meaningful room to come down on a strong offer.
Risks & watch-outs
- Watch-outs: HOA is 25% of rent.
- Climate carrying-cost: extreme-heat days projected 7→22/yr by 2055 (HVAC capex compounding) — expect insurance premiums to compound above CPI over the hold.
Questions for the listing agent
- It's been on market 65 days. Have you received any prior offers? Is the seller open to a 6% concession, seller financing, or rate buy-down credit?
- Built in 1965 — when were the roof, HVAC, electrical panel, plumbing, and water heater last replaced?
- What does the HOA fee cover, when was the last increase, and are there any pending special assessments or reserve-fund shortfalls?
- Any open or pending special assessments — roof, HVAC, plumbing, elevator, façade? What's the per-unit balance and payoff schedule, and is the seller paying it off at close or rolling it to the buyer?
- Why hasn't it sold? Are there any deal-killer items the seller is aware of (foundation, flood, title, zoning, code violations)?
- Is there a deadline driving the sale (1031 exchange, divorce, estate, relocation)? That informs how much negotiation room exists.
- Schools are D-rated, which usually means shorter tenancies and higher turnover. Who's the typical renter profile here, and what's been the actual vacancy rate?
- Crime grade is F in this area — have there been break-ins, vandalism, or insurance claims at this property in the last 3 years? What carrier currently insures it and at what premium?
- What's the average days-on-market for RENTAL listings here right now (not sales)? A rising rental-DOM trend means longer vacancies and softer asking-rent achievability than the comps imply.
- What's the recent tenant-quality profile in this submarket — average credit score on applications, eviction rate, late-payment / NSF rate, and stable-employment percentage? A property-management company in the area should have these aggregated.
- How much new apartment / multifamily construction is in the pipeline within 1–3 miles? Heavy new supply (>2% of stock underway) typically softens rents 12–24 months out; light construction supports rent growth.
Investment metrics
- 1% rule
- 1.96% ✓
- Cap rate
- 11.39%
- Cash-on-cash
- 18.22%
- DSCR
- 1.81
- GRM
- 4.2
CMA / ARV
- ARV (median comp)
- $48,362
- List price
- $53,000
- Delta
- 9.59%
- Verdict
- FAIR
- Comps
- 20 within 1.0 mi
Projected returns pro-forma
-3.0% appreciation · 4.45% rent growth · sell at horizon
- IRR
- 12.3%
- Equity multiple
- 1.50×
- Total profit
- $7,460
- Equity at exit
- $7,902
- IRR
- 22.9%
- Equity multiple
- 3.16×
- Total profit
- $32,124
- Equity at exit
- $4,582
Cash invested: $14,840 (down + closing). Projections, not guarantees.
Landlord ↔ Tenant lean methodology
- Overall (STATE)
- 81 Strongly Landlord-Friendly
- State Missouri
- 81 Strongly Landlord-Friendly · R+10
- County
- — inherits STATE
- City
- — inherits STATE
ZIP-level market 63042
- Rents YoY
- 4.5%
- Active inventory
- 68
- Price-to-rent
- 4.2×
Monthly cashflow live
- Estimated rent
- $1,041 medium interval (Pro) →
- Mortgage (P&I)
- −$278
- Tax from tax record
- −$41 /mo · $488/yr
- Insurance
- −$22
- HOA
- −$256
- Vacancy / Maint / Mgmt
- −$219
- Net cashflow
- $225
Break-even live
Sensitivity live
| Price | -10% $255 | -5% $240 | +0% $225 | +5% $210 | +10% $195 |
|---|---|---|---|---|---|
| Rent | -10% $143 | -5% $184 | +0% $225 | +5% $266 | +10% $308 |
| Rate | -1.0pp $252 | -0.5pp $239 | base $225 | +0.5pp $212 | +1.0pp $198 |
UW: 25.0% down · 7.5% · 30yr · 1.5% tax · 5.0% vac · 8.0% maint · 8.0% mgmt
Financing live
Cash to close
- Down payment
- $13,250
- Closing costs
- $1,590
- Reserves months
- —
- Total cash needed
- —
Loan-product check · same deal, 3 products live
Conventional
25% down · 7.5% · 30yr
- Down + closing
- —
- Monthly P&I
- —
- Monthly cashflow
- —
- DSCR
- —
- Eligible?
- —
Personal DTI + credit; lowest rate.
DSCR
20% down · 8.5% · 30yr
- Down + closing
- —
- Monthly P&I
- —
- Monthly cashflow
- —
- DSCR
- —
- Eligible?
- —
No personal income docs; deal must DSCR.
Hard money
10% down · 12.0% · 12mo
- Down + closing
- —
- Monthly P&I
- —
- Monthly cashflow
- —
- DSCR
- —
- Eligible?
- —
Short-term bridge; refi at stabilization.
Rent comps 3 comps
| Address | Beds | Baths | Sqft | Rent | $/sqft | DOM | Units | Dist |
|---|---|---|---|---|---|---|---|---|
| 651 Southwell Ln Florissant, MO | 2.0 | 1.0 | 694 | $1,100 | $1.59 | 19d | 1 | 0.84mi |
| 7410 Olian Dr Hazelwood, MO | 1.0 | 1.0 | 540 | $800 | $1.48 | 24d | 1 | 0.86mi |
| 241 Flora Dr Saint Louis, MO | 2.0 | 1.0 | 703 | $1,075 | $1.53 | 25d | 1 | 1.21mi |
HOA detail condo
- Monthly dues
- $256 · $3,072/yr
- Assessments
- None detected in remarks — confirm with the listing agent.
Listing history 23 events
-
2026-06-21days on market $53,000 Active 65 DOM
-
2026-06-18days on market $53,000 Active 62 DOM
-
2026-06-17days on market $53,000 Active 61 DOM
-
2026-06-16days on market $53,000 Active 60 DOM
-
2026-06-15days on market $53,000 Active 59 DOM
-
2026-06-13days on market $53,000 Active 57 DOM
-
2026-06-13days on market $53,000 Active 56 DOM
-
2026-06-09days on market $53,000 Active 53 DOM
-
2026-06-08days on market $53,000 Active 52 DOM
-
2026-06-07days on market $53,000 Active 51 DOM
-
2026-06-05days on market $53,000 Active 48 DOM
-
2026-06-03days on market $53,000 Active 47 DOM
-
2026-06-02days on market $53,000 Active 46 DOM
-
2026-06-01days on market $53,000 Active 45 DOM
-
2026-05-31days on market $53,000 Active 44 DOM
-
2026-05-08price $53,000 246-char remark
Show marketing remark (246 chars)
Solid investment opportunity: an occupied one-bedroom, one-bathroom condo currently generating rental income. Ideal for investors looking to add a cash-flowing asset to their portfolio with no vacancy period. Tenant in place, income from day one.
-
2026-04-17$55,000 Active 246-char remark
Show marketing remark (246 chars)
Solid investment opportunity: an occupied one-bedroom, one-bathroom condo currently generating rental income. Ideal for investors looking to add a cash-flowing asset to their portfolio with no vacancy period. Tenant in place, income from day one.
-
2025-03-02historical $745
-
2025-02-09price $745
-
2025-01-03$795
-
2023-03-10soldstatus $25,000
-
2021-11-23soldstatus $22,500
-
1994-12-28soldstatus $18,000
ⓘ Source: listings_history table (triggers on properties + properties_extension) + one-shot
backfill from property_details.listing_events for pre-trigger history.
Tax reassessment forecast MO · Resets to sale price
- Current annual tax
- $488 · $41/mo
- Projected year-2 tax
- $514 · $43/mo
- Expected delta
- +$26/yr (+$2/mo · 5.2%)
ⓘ Screening estimate from a state-policy table — verify with the county assessor before closing.
Climate risk First Street
- Flood 4/10 Moderate FEMA zone X (unshaded) · 20% chance over 30 yrs
- Wildfire 1/10 Low
- Heat 5/10 Major 7 d/yr ≥105°F today · 22 d/yr by 30 yrs out
- Wind 2/10 Low 100% chance of damaging wind over 30 yrs
- Air quality 3/10 Moderate 3 unhealthy d/yr today · 5 by 30 yrs out
Nearby sold comps map
Loading sold comps map…
Walkable amenities ~0.75 mi
Loading nearby amenities…
Taxation est. · year 1
- Rental income
- $12,487
- − Mortgage interest
- −$2,969
- − Property taxes
- −$488
- − Insurance
- −$265
- − Repairs & maintenance
- −$999
- − Management
- −$999
- − HOA
- −$3,072
- − Depreciation
- −$1,542
- Taxable income
- $2,153
- Est. tax owed @ 24.0%
- −$517
- After-tax cash flow
- $2,187/yr
For passive investors: Depreciation is non-cash, so a rental often shows a tax loss while cash-flowing — sheltering income. Rental losses are passive: they offset passive income freely, and up to $25,000/yr can offset ordinary (W-2) income if you actively participate and your MAGI is under $100k (phasing out to $0 by $150k); unused losses carry forward. On sale, claimed depreciation is recaptured at up to 25%, and gains may owe capital-gains tax (a 1031 exchange can defer both). Figures are a year-1 estimate at your 24.0% rate — not tax advice; consult a CPA.
Schools (NCES district)
- District
- Ferguson-Florissant R-II
- NCES district ID
- 2912010
- Math proficiency
- 7% ▼ -9.00%
- Reading proficiency
- 20% ▼ -6.00%
- Median HH income
- $44,610
- Composite
- 11.96/100
- National rank
- #9666
- State rank
- #311 of 324 in MO
Livability — Hazelwood
- Score
- 62/100
- State rank
- #395
- US rank
- #16956
Category grades
Schools grade is shown separately in the Schools card above.
Census & demographics
- Census place
- Hazelwood, MO
- County
- Saint Louis County · 888,823 people
- City population
- 17,813
- Metro
- St. Louis, MO-IL
- Population (ZIP)
- 17,813
- Household income
- $49,453
- Rent vs Own
- Severe rent burden
- 766.0
Population outlook (St. Louis County) Hauer SSP2
- Today (2025)
- 1,025,227 people
- By 2030
- 1,028,023 · +0.3%
- By 2040
- 1,020,940 · -0.4%
- By 2050
- 1,007,280 · -1.8%
- By 2075
- 987,277 · -3.7%
- By 2100
- 921,984 · -10.1%
Race, ethnicity, and origin ACS 2023
- Neighborhood character
- Diverse neighborhood (Simpson 0.64)
- Race & ethnicity
- White 46% Black 38% Two or more races 10% Hispanic / Latino 4% Asian 2%
- Common ancestry
- Lithuanian 3% Romanian 1% Italian 1%
- Foreign-born
- 5% · Canada, Vietnam
- Languages at home
- 94% English-only · Spanish 3% Vietnamese 1% Tagalog/Filipino 1%
Political lean MEDSL · St. Louis
- 2024 margin
- Strong D (+23.4) · D 60.8% · R 37.4% · Other 1.7%
- 2008→2024 swing
- +3.5pp toward D · 2008: 19.9pp · 2024: 23.4pp
- All cycles
- 2024: D+23.4 2020: D+24.0 2016: D+16.2 2012: D+13.7 2008: D+19.9
Not yet ingested
- Civics
- —
Market trends
- HPI YoY
- ▼ -204.48%
- Current HPI
- 234.7353
- Rent YoY
- ▲ 4.45%
- Metro
- St. Louis, MO-IL
- State GDP YoY
- ▲ 1.84%
- F500 in state
- 20
Industry mix (Fortune 500 HQ in MO)
| Industry | F500 HQs | Revenue |
|---|---|---|
| Healthcare | 1 | $163B |
|
||
| Insurance | 1 | $21B |
|
||
| Industrial Technology | 1 | $17B |
|
||
| Retail | 1 | $16B |
|
||
| Industrial Distribution | 1 | $10B |
|
||
| Utilities | 1 | $9B |
|
||
Price history
+194.4% since first listed8 events — show timeline
- 2026-05-08 Price Changed $53,000 MARIS as Distributed by MLS Grid
- 2026-04-17 Listed $55,000 MARIS as Distributed by MLS Grid
- 2025-03-02 Rental Removed $745 SHOWMOJO
- 2025-02-09 Price Changed $745 SHOWMOJO
- 2025-01-03 Listed for Rent $795 SHOWMOJO
- 2023-03-10 Sold (Public Records) $25,000 Public Records
- 2021-11-23 Sold (Public Records) $22,500 Public Records
- 1994-12-28 Sold (Public Records) $18,000 Public Records
Property tax history
+3.1%/yrLatest (2022): $488 · +0.6% YoY. Source: county tax records.
Cash-flow waterfall
monthlySold comps — $/sqft
last 12 mo · ≤1 miLoading sold comps…