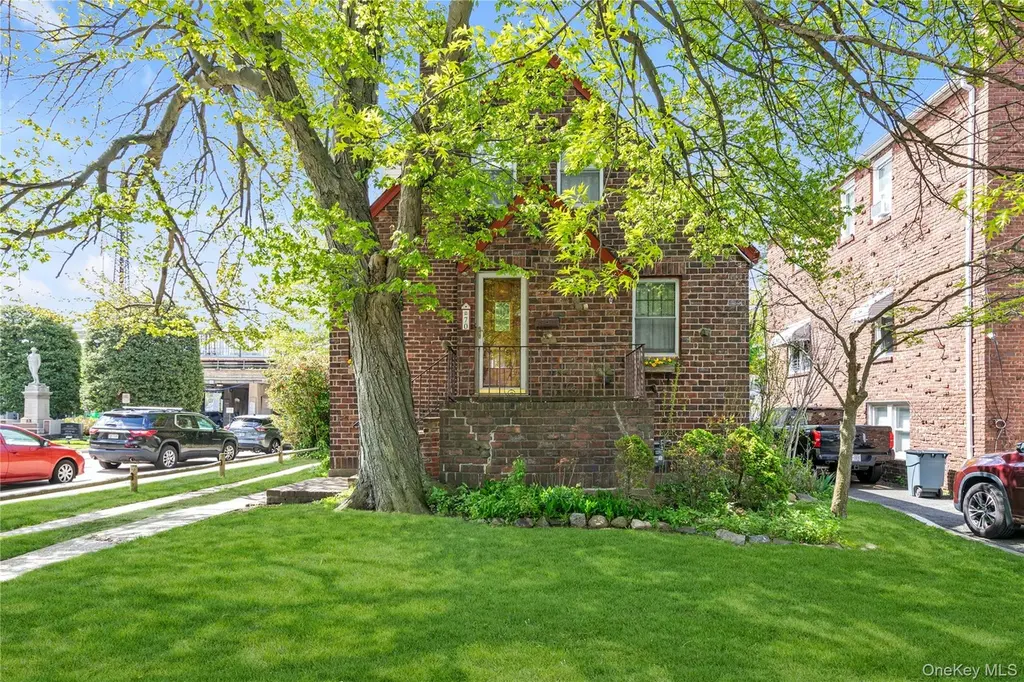
70 Lyon Pl · Lynbrook, NY
Flood risk 7/10 · Major
- FEMA flood zone
- X (unshaded)
- Chance of flooding over 30 yrs
- 0.77%
- Est. flood insurance / yr
- $473 – $860
Fire risk 1/10 · Minimal
- Est. fire insurance / yr
- $691 – $1,283
Heat risk 7/10 · Major
- Hot days now (above 97°F)
- 7 days/yr
- Hot days in 30 yrs
- 16 days/yr
Wind risk 6/10 · Moderate
- Chance of severe wind over 30 yrs
- 68.0%
Air-quality risk 3/10 · Minor
- Unhealthy air days now
- 4 days/yr
- Unhealthy air days in 30 yrs
- 4 days/yr
Risk factors via First Street. Map © Google.
Why this score? — see what drove the D grade
The composite is a weighted blend of 9 inputs, each scored 0–100. Each bar is that input's sub-score; the figure is the points it added to the 100-point composite (weight × sub-score).
- ARV discount +15.0/15.0
- Cash flow +7.7/30.0
- Schools +6.7/10.0
- Livability +4.4/5.0
- Rent growth +2.5/5.0
- Condition / age +2.5/5.0
- DSCR +1.8/10.0
- 1% rule +1.0/10.0
- Appreciation +0.0/10.0
$599,000
🖨 Deal sheet (PDF) 📄 Offer letter ✓ Due diligence
Listing remarks
Charming and cozy 3br brick cape in the heart of Lynbrook. Features include a warm and inviting Living room with wood-burning fireplace, formal dining room, expanded eat in kitchen with vaulted ceilings and a door leading to the private backyard. The main floor offers a convenient bedroom and full bath with jacuzzi tub while the Second floor has 2 additional bedrooms and unfinished section for ample storage. Full basement has lots of possibilities for recreation or family room. There are beautiful oak floors on the main level and under the carpet on the second level. Oil heat with the tank in the basement. A gas connection already in the home makes for an easy conversion. Steps to the LIRR
Key facts
- Private backyard
- Gas connection
- Full basement
Tags
Property features AI
Exterior
- Parking: Driveway; Garage with 1 car space; No carport
- Utilities: Electricity connected (PSEG); Natural gas connected; Public sewer
- Home design: Single family residence; Living area recorded in public records
- Construction: Brick construction
- Exterior features: Brick exterior; Not waterfront
Interior
- Kitchen: Electric cooktop; Electric oven; Refrigerator
- Bedrooms: Includes a first-floor bedroom
- Bathrooms: 1 full bathroom
- Heating & cooling: Oil heating; Steam heat; No central cooling
- Interior features: First-floor bedroom; First-floor full bathroom; Full unfinished basement; Dormer attic
- Laundry & utility: Basement utility space
Neighborhood map
What this means for you Summary
Snapshot
- This is a 3-bed/1.0-bath single-family listed at $599k.
Deal economics
- At list price, monthly cash flow is $-736 ($-9k/yr) — negative.
- To cash-flow at today's rent, offer at most $469k (21.7% below list).
- To meet the 1% rule (rent ≥ 1% of price), the offer needs to be $359k (40.1% below list).
- Recommended offer: $359k (40.1% below list) — sets the bar for 1% rule.
- Cap rate 4.9% vs local median 3.2% in Lynbrook — top-decile yield for the area; either an underpriced asset or a hidden risk that comps aren't pricing in. Stress-test before assuming the spread holds.
Location & tenants
- Location reads 88/100 on livability (#10 in NY, #221 nationally) — a professional / high-income tenant draw. Strengths: crime A+, amenities A+, commute A+; Watch: cost of living F.
- Lynbrook Union Free School District (suburban): math 75% / reading 73% proficiency, ranked #72 of 590 in NY (top 12%) — strong family-tenant draw, lease renewals of 3-5y typical; only 8% free/reduced lunch — higher-income household profile.
- Zoned schools: West End School (math 82% / reading 82%, grade A+, #138 of 2,108 statewide, top 8%, 401 students, 0% FRL); Lynbrook North Middle School (math 42% / reading 67%, grade B-, #214 of 729 statewide, top 31%, 266 students, 15% FRL); Lynbrook Senior High School (math 97% / reading 82%, grade A+, #265 of 1,100 statewide, top 26%, 850 students, 19% FRL) — zoned schools at 11% FRL track the district average.
- Market conditions: 134 active listings in the ZIP; 24 comparable units currently listed for rent nearby; rentals at typical pace (median 23d on market — plan ~3-4 weeks tenant-placement turnaround); high-income renter base; 824 units permitted in Nassau County in 2024 (153 in 5+ unit buildings).
- This rent runs 31% of the median local income ($137k/yr) — at the standard rent-burdened threshold; future hikes will face affordability resistance.
Forward outlook
- Local home prices are declining (-3.0%/yr); year-one equity from $4k of loan paydown is wiped out by about $18k of value loss. Plan a longer hold.
- Nassau County population projected at +7% by 2050 — modest demand growth; plan on rents tracking national, not racing it.
Negotiation context
- It's been on market 34 days — a 3% lower offer ($581k) is reasonable based on typical stale-listing flexibility.
- 2 sale attempts; this cycle's ask has dropped $50k (8%) from the opening price — seller is motivated, your offer sets the floor, not the list.
- Current owner paid $85k; list at $599k implies a 605% gain — meaningful room to come down on a strong offer.
Risks & watch-outs
- Watch-outs: flood insurance adds $56/mo; built in 1930 — expect roof / HVAC / electrical / plumbing capex.
- Climate carrying-cost: major flood risk; major wind risk, 68% chance of damaging wind over 30y; extreme-heat days projected 7→16/yr by 2055 (HVAC capex compounding) — expect insurance premiums to compound above CPI over the hold.
Questions for the listing agent
- What do current leases actually rent for vs. the listed asking? Can we see a recent rent roll and the last 12 months of T-12 income?
- It's been on market 34 days. Have you received any prior offers? Is the seller open to a 40% concession, seller financing, or rate buy-down credit?
- Built in 1930 — when were the roof, HVAC, electrical panel, plumbing, and water heater last replaced?
- What's the actual annual flood-insurance premium (NFIP or private), and is the property in a SFHA with mandatory coverage?
- Is there a deadline driving the sale (1031 exchange, divorce, estate, relocation)? That informs how much negotiation room exists.
- Schools are A-rated — typically a magnet for longer-tenancy family renters. What's the average tenant stay here, and is there a school-zone premium baked into asking?
- The area grade is low — what's the realistic commute time and amenity access for the typical tenant pool here? Any planned neighborhood developments (good or bad) we should know about?
- What's the average days-on-market for RENTAL listings here right now (not sales)? A rising rental-DOM trend means longer vacancies and softer asking-rent achievability than the comps imply.
- What's the recent tenant-quality profile in this submarket — average credit score on applications, eviction rate, late-payment / NSF rate, and stable-employment percentage? A property-management company in the area should have these aggregated.
- How much new for-sale + rental construction is in the pipeline within 1–3 miles? Heavy new supply typically softens prices + rents 12–24 months out; constrained supply supports both.
Investment metrics
- 1% rule
- 0.60% ✗
- Cap rate
- 4.93%
- Cash-on-cash
- -4.87%
- DSCR
- 0.78
- GRM
- 13.9
CMA / ARV
- ARV (median comp)
- $789,605
- List price
- $599,000
- Delta
- -24.14%
- Verdict
- UNDERPRICED
- Comps
- 20 within 1.0 mi
Show comp detail 12 sales within ~0.75 mi
| Address | Dist | Beds/Ba | Sqft | Sold | Price | $/sf | Match |
|---|---|---|---|---|---|---|---|
| 30 Putnam Ave | 0.15mi | 3/1.5 | 1,256 (+3%) | 1mo | $575,000 | $458 | 86 |
| 251 Forest Ave | 0.60mi | 3/1.0 | 1,188 (-3%) | 1mo | $740,000 | $623 | 66 |
| 11 Wood St | 0.45mi | 4/1.0 (+1) | 1,176 (-4%) | 4mo | $550,000 | $468 | 64 |
| 21 Washington Ave | 0.71mi | 3/2.0 | 1,224 (+0%) | 1mo | $640,000 | $523 | 61 |
| 16 Farnum St | 0.64mi | 3/1.5 | 1,252 (+2%) | 3mo | $830,000 | $663 | 61 |
| 21 Oceanview Ave | 0.67mi | 3/1.5 | 1,174 (-4%) | 0mo | $675,000 | $575 | 60 |
| 189 Surrey | 0.52mi | 2/1.0 (-1) | 1,161 (-5%) | 3mo | $601,500 | $518 | 60 |
| 40 Hendrickson Ave | 0.65mi | 3/2.5 | 1,250 (+2%) | 1mo | $770,000 | $616 | 58 |
| 75 Denton Ave | 0.61mi | 4/1.0 (+1) | 1,299 (+6%) | 1mo | $710,000 | $547 | 55 |
| 19 Everett St | 0.61mi | 3/1.5 | 1,364 (+12%) | 0mo | $515,000 | $378 | 50 |
| 58 Chestnut St | 0.71mi | 3/2.0 | 1,324 (+8%) | 2mo | $650,000 | $491 | 47 |
| 86 Taft Ave | 0.57mi | 3/1.5 | 1,400 (+15%) | 0mo | $895,000 | $639 | 47 |
Match score weights: distance 35% · size 25% · config 20% · recency 20%. Top-matched comps best support the ARV.
Projected returns pro-forma
-3.0% appreciation · 3.0% rent growth · sell at horizon
- IRR
- -25.4%
- Equity multiple
- 0.14×
- Total profit
- $-144,260
- Equity at exit
- $89,313
- IRR
- -21.8%
- Equity multiple
- -0.12×
- Total profit
- $-187,214
- Equity at exit
- $51,791
Cash invested: $167,720 (down + closing). Projections, not guarantees.
Landlord ↔ Tenant lean methodology
- Overall (STATE)
- 15 Strongly Tenant-Friendly
- State New York
- 15 Strongly Tenant-Friendly · D+10
- County
- — inherits STATE
- City
- — inherits STATE
ZIP-level market 11563
- Active inventory
- 134
- Price-to-rent
- 13.9×
Monthly cashflow live
- Estimated rent
- $3,586 high interval (Pro) →
- Mortgage (P&I)
- −$3,141
- Tax from tax record
- −$123 /mo · $1,476/yr
- Insurance
- −$250
- Flood insurance flood zone
- −$56 /mo · $666/yr
- HOA
- −$0
- Vacancy / Maint / Mgmt
- −$753
- Net cashflow
- $-736
Break-even live
Sensitivity live
| Price | -10% $-397 | -5% $-567 | +0% $-736 | +5% $-906 | +10% $-1,075 |
|---|---|---|---|---|---|
| Rent | -10% $-1,020 | -5% $-878 | +0% $-736 | +5% $-595 | +10% $-453 |
| Rate | -1.0pp $-435 | -0.5pp $-584 | base $-736 | +0.5pp $-892 | +1.0pp $-1,049 |
UW: 25.0% down · 7.5% · 30yr · 1.5% tax · 5.0% vac · 8.0% maint · 8.0% mgmt
Financing live
Cash to close
- Down payment
- $149,750
- Closing costs
- $17,970
- Reserves months
- —
- Total cash needed
- —
Loan-product check · same deal, 3 products live
Conventional
25% down · 7.5% · 30yr
- Down + closing
- —
- Monthly P&I
- —
- Monthly cashflow
- —
- DSCR
- —
- Eligible?
- —
Personal DTI + credit; lowest rate.
DSCR
20% down · 8.5% · 30yr
- Down + closing
- —
- Monthly P&I
- —
- Monthly cashflow
- —
- DSCR
- —
- Eligible?
- —
No personal income docs; deal must DSCR.
Hard money
10% down · 12.0% · 12mo
- Down + closing
- —
- Monthly P&I
- —
- Monthly cashflow
- —
- DSCR
- —
- Eligible?
- —
Short-term bridge; refi at stabilization.
Rent comps 24 comps
| Address | Beds | Baths | Sqft | Rent | $/sqft | DOM | Units | Dist |
|---|---|---|---|---|---|---|---|---|
| 14 Endview Ave Lynbrook, NY | 2.0 | 2.0 | 1210 | $3,650 | $3.02 | 45d | 1 | 0.07mi |
| 2 Fowler Ave Unit 211 Lynbrook, NY | 3.0 | 2.0 | 1300 | $3,750 | $2.88 | 26d | 1 | 0.20mi |
| 112 Atlantic Ave Apt 71 Lynbrook, NY | 2.0 | 1.0 | 760 | $3,000 | $3.95 | 14d | 1 | 0.34mi |
| 24 Doxsey Pl Unit 3 Lynbrook, NY | 2.0 | 1.0 | 900 | $3,300 | $3.67 | 26d | 1 | 0.40mi |
| 23 Thompson Pl Unit 2 Lynbrook, NY | 3.0 | 1.0 | 900 | $3,100 | $3.44 | 20d | 1 | 0.44mi |
| 576 Scranton Ave Unit 576-4 Lynbrook, NY | 2.0 | 1.0 | 1212 | $3,750 | $3.09 | 45d | 1 | 0.52mi |
| 68 Shipherd Ave Apt 2 Lynbrook, NY | 2.0 | 1.0 | 1200 | $2,650 | $2.21 | 26d | 1 | 0.62mi |
| 27 Park Pl Unit 2 Lynbrook, NY | 3.0 | 1.0 | 1000 | $3,600 | $3.60 | 45d | 1 | 0.66mi |
| 92 Wavecrest St Valley Stream, NY | 2.0 | 1.0 | 1200 | $2,800 | $2.33 | 25d | 1 | 0.72mi |
| 65 Prospect Ave Apt 15W Lynbrook, NY | 2.0 | 2.0 | 1060 | $3,680 | $3.47 | 23d | 1 | 0.77mi |
| 44 Jefferson Ave Unit Second Floor Lynbrook, NY | 2.0 | 1.0 | 1452 | $2,850 | $1.96 | 45d | 1 | 0.80mi |
| 1 Allen St Unit 1 Lynbrook, NY | 3.0 | 2.0 | 1100 | $3,500 | $3.18 | 18d | 1 | 0.92mi |
| 441 Atlantic Ave Unit 2 East Rockaway, NY | 3.0 | 1.0 | 1150 | $3,500 | $3.04 | 45d | 1 | 1.00mi |
| 100 E Valley Stream Blvd Valley Stream, NY | 3.0 | 2.0 | 800 | $3,000 | $3.75 | 0d | 1 | 1.04mi |
| 127 Gordon Rd Valley Stream, NY | 3.0 | 1.0 | 1200 | $3,350 | $2.79 | 45d | 1 | 1.09mi |
| 125 S Cottage St Valley Stream, NY | 1.0–2.0 | 1.0–2.0 | 1143 | $4,285 | $3.75 | 0d | 7 | 1.11mi |
| 70 S Cottage St Valley Stream, NY | 2.0 | 1.5 | 1290 | $4,000 | $3.10 | 0d | 1 | 1.13mi |
| 35 Gibson Blvd Unit 2 Valley Stream, NY | 2.0 | 1.0 | 1150 | $3,900 | $3.39 | 0d | 1 | 1.32mi |
| 80 N Centre Ave Rockville Centre, NY | 3.0 | 1.0–3.5 | 1254 | $5,935 | $4.73 | 0d | 1 | 1.37mi |
| 111 S Centre Ave Apt 1SS Rockville Centre, NY | 2.0 | 1.0 | 950 | $3,250 | $3.42 | 6d | 1 | 1.41mi |
| 50 Roosevelt Ave Unit A301 Valley Stream, NY | 2.0 | 1.0 | 767 | $3,550 | $4.63 | 0d | 1 | 1.41mi |
| 225 Marina Pointe Dr Unit 225 Oceanside, NY | 2.0 | 2.0 | 1337 | $4,200 | $3.14 | 11d | 1 | 1.43mi |
| 510 Dubois Ave Apt 3C Valley Stream, NY | 2.0 | 1.5 | 1050 | $3,400 | $3.24 | 45d | 1 | 1.46mi |
| 19 Dartmouth St Valley Stream, NY | 3.0 | 3.5 | 1439 | $4,600 | $3.20 | 0d | 1 | 1.50mi |
Listing history 13 events
-
2026-06-18days on market $599,000 Active 34 DOM
-
2026-06-17days on market $599,000 Active 33 DOM
-
2026-06-16days on market $599,000 Active 32 DOM
-
2026-06-15days on market $599,000 Active 31 DOM
-
2026-06-13days on market $599,000 Active 29 DOM
-
2026-06-09days on market $599,000 Active 25 DOM
-
2026-06-04days on market $599,000 Active 24 DOM
-
2026-06-03days on market $599,000 Active 23 DOM
-
2026-06-02days on market $599,000 Active 22 DOM
-
2026-06-01days on market $599,000 Active 21 DOM
-
2026-05-31days on market $599,000 Active 20 DOM
-
2026-02-21$649,000 Active 756-char remark
-
1984-07-01soldstatus $85,000
ⓘ Source: listings_history table (triggers on properties + properties_extension) + one-shot
backfill from property_details.listing_events for pre-trigger history.
Tax reassessment forecast NY · Partial reset (capped growth)
- Current annual tax
- $1,476 · $123/mo
- Projected year-2 tax
- $5,800 · $483/mo
- Expected delta
- +$4,324/yr (+$360/mo · 292.9%)
ⓘ Screening estimate from a state-policy table — verify with the county assessor before closing.
Climate risk First Street
- Flood 7/10 Severe FEMA zone X (unshaded) · 77% chance over 30 yrs
- Wildfire 1/10 Low
- Heat 7/10 Severe 7 d/yr ≥97°F today · 16 d/yr by 30 yrs out
- Wind 6/10 Major 68% chance of damaging wind over 30 yrs
- Air quality 3/10 Moderate 4 unhealthy d/yr today · 4 by 30 yrs out
Nearby sold comps map
Loading sold comps map…
Walkable amenities ~0.75 mi
Loading nearby amenities…
Taxation est. · year 1
- Rental income
- $43,032
- − Mortgage interest
- −$33,553
- − Property taxes
- −$1,476
- − Insurance
- −$3,662
- − Repairs & maintenance
- −$3,443
- − Management
- −$3,443
- − Depreciation
- −$17,425
- Taxable loss
- −$19,969
- Est. tax savings @ 24.0%
- +$4,793
- After-tax cash flow
- $-4,044/yr
For passive investors: Depreciation is non-cash, so a rental often shows a tax loss while cash-flowing — sheltering income. Rental losses are passive: they offset passive income freely, and up to $25,000/yr can offset ordinary (W-2) income if you actively participate and your MAGI is under $100k (phasing out to $0 by $150k); unused losses carry forward. On sale, claimed depreciation is recaptured at up to 25%, and gains may owe capital-gains tax (a 1031 exchange can defer both). Figures are a year-1 estimate at your 24.0% rate — not tax advice; consult a CPA.
Schools (NCES district)
- District
- Lynbrook Union Free School District
- NCES district ID
- 3617910
- Math proficiency
- 75% ▬ 0.00%
- Reading proficiency
- 73% ▲ 2.00%
- Median HH income
- $93,436
- Composite
- 66.85/100
- National rank
- #404
- State rank
- #72 of 590 in NY
Livability — Lynbrook
- Score
- 88/100
- State rank
- #10
- US rank
- #221
Category grades
Schools grade is shown separately in the Schools card above.
Census & demographics
- Census place
- Lynbrook, NY
- County
- Nassau County · 653,051 people
- City population
- 22,899
- Metro
- New York-Newark-Jersey City, NY-NJ-PA
- Population (ZIP)
- 22,899
- Household income
- $136,887
- Rent vs Own
- Severe rent burden
- 618.0
Population outlook (Nassau County) Hauer SSP2
- Today (2025)
- 1,409,302 people
- By 2030
- 1,431,482 · +1.6%
- By 2040
- 1,471,607 · +4.4%
- By 2050
- 1,502,845 · +6.6%
- By 2075
- 1,575,403 · +11.8%
- By 2100
- 1,554,356 · +10.3%
Race, ethnicity, and origin ACS 2023
- Neighborhood character
- Diverse neighborhood (Simpson 0.56)
- Race & ethnicity
- White 62% Hispanic / Latino 21% Two or more races 10% Asian 7% Black 7%
- Hispanic origin (detail)
- Mexican 1% Puerto Rican 4% Cuban 2% Dominican 3%
- Common ancestry
- Hispanic 2% Romanian 2% Scotch-Irish 2%
- Foreign-born
- 17% · Canada, China, Jamaica
- Languages at home
- 74% English-only · Spanish 13% Other Indo-European 7% French/Haitian/Cajun 2%
Political lean MEDSL · Nassau
- 2024 margin
- Toss-up / Even · D 47.9% · R 52.1%
- 2008→2024 swing
- -12.6pp toward R · 2008: 8.4pp · 2024: -4.2pp
- All cycles
- 2024: R+4.2 2020: D+9.5 2016: D+5.3 2012: D+6.7 2008: D+8.4
Not yet ingested
- Civics
- —
Market trends
- HPI YoY
- ▼ -652.00%
- Current HPI
- 317.1455
- Rent YoY
- —
- Metro
- New York-Newark-Jersey City, NY-NJ-PA
- State GDP YoY
- ▲ 2.60%
- F500 in state
- 92
Industry mix (Fortune 500 HQ in NY)
| Industry | F500 HQs | Revenue |
|---|---|---|
| Financial Services | 10 | $950B |
|
||
| Consumer Goods | 9 | $162B |
|
||
| Insurance | 4 | $225B |
|
||
| Telecommunications | 2 | $144B |
|
||
| Pharmaceuticals | 2 | $112B |
|
||
| Media / Entertainment | 2 | $69B |
|
||
Price history
+604.7% since first listed4 events — show timeline
- 2026-06-08 Relisted — OneKey® MLS as Distributed by MLS Grid
- 2026-05-27 Price Changed $599,000 OneKey® MLS as Distributed by MLS Grid
- 2026-02-21 Listed $649,000 OneKey® MLS as Distributed by MLS Grid
- 1984-07-01 Sold (Public Records) $85,000 Public Records
Property tax history
-8.8%/yrLatest (2024): $1,476 · -75.7% YoY. Source: county tax records.
Cash-flow waterfall
monthlySold comps — $/sqft
last 12 mo · ≤1 miLoading sold comps…