 Multi-family
2904 Chapman St · Houston, TX
Flood risk No data
- FEMA flood zone
- —
- Chance of flooding over 30 yrs
- —
- Est. flood insurance / yr
- —
Fire risk No data
- Est. fire insurance / yr
- —
Heat risk No data
- Hot days now (above threshold)
- —
- Hot days in 30 yrs
- —
Wind risk No data
- Chance of severe wind over 30 yrs
- —
Air-quality risk No data
- Unhealthy air days now
- —
- Unhealthy air days in 30 yrs
- —
Risk factors via First Street. Map © Google.
Why this score? — see what drove the C+ grade
The composite is a weighted blend of 9 inputs, each scored 0–100. Each bar is that input's sub-score; the figure is the points it added to the 100-point composite (weight × sub-score).
- Cash flow +30.0/30.0
- 1% rule +10.0/10.0
- DSCR +10.0/10.0
- Condition / age +4.8/5.0
- Livability +3.7/5.0
- Rent growth +2.7/5.0
- Schools +2.7/10.0
- ARV discount +0.0/15.0
- Appreciation +0.0/10.0
$419,990
🖨 Deal sheet (PDF) 📄 Offer letter ✓ Due diligence
Multi-family units
County records classify this as Multi-Family (2-4 Unit). Listing-text estimate: 1 unit. estimate disagrees with records
Listing remarks MLS
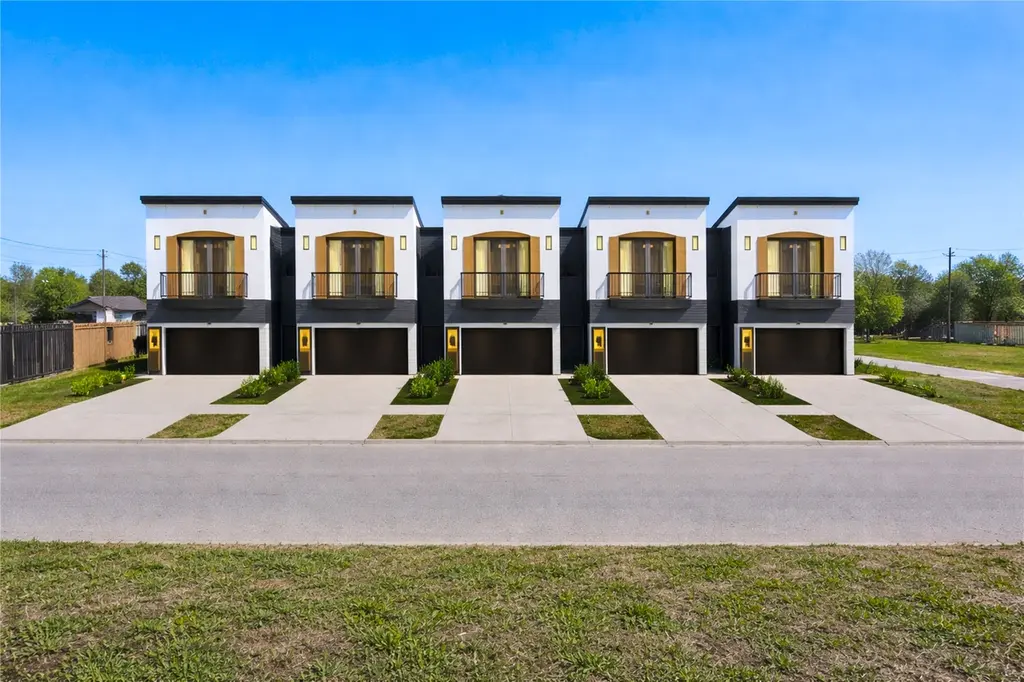
2904 through 2914 Chapman for SALE. Replotted to 4 lots, each lot is 1787 SQ FT. Total lot Size 7150 SF. 5 Tenant-occupied units. Excellent investment opportunity in the heart of Northside Village! This impressive property boasts 3 duplexes/ 6 units, all currently leased at full capacity with a monthly rent of $775 each. Situated on a rare CITY BLOCK, this gem is strategically located within proximity to major highways, bus routes, and is less than 3 miles from both the highly anticipated East River development and the Downtown area. What makes this investment even more enticing is its designation as a qualified opportunity zone, offering potential tax benefits. As part of an up-and-coming neighborhood experiencing significant growth and new construction, this property stands as a testament to the area's transition. 2 additional lots next to these 4 are also available for sale separately.
Key facts
- 3 duplex 6 units
- 7,150 sq ft lot
- Built 1940
Tags
Neighborhood map
What this means for you Summary
Snapshot
- This is a 2-bed/2.0-bath multifamily listed at $420k. Condition is rated excellent.
Deal economics
- At list price, monthly cash flow is $5k ($65k/yr) — positive.
- The deal already cash-flows at list — no discount required.
- Meets the 1% rule at list price ($11k rent vs $420k).
- Recommended offer: $395k (6.0% below list) — sets the bar for market timing.
- Cap rate 21.7% vs local median 3.2% in Houston — top-decile yield for the area; either an underpriced asset or a hidden risk that comps aren't pricing in. Stress-test before assuming the spread holds.
Location & tenants
- Location reads 74/100 on livability (#184 in TX, #4,771 nationally) — a middle-class / working-renter tenant base. Strengths: amenities A+, cost of living A+, housing A+; Watch: schools D, crime F.
- Houston ISD (urban): math 27% / reading 35% proficiency, ranked #593 of 826 in TX (top 72%) — families likely to look elsewhere, expect single-tenant / working-renter base with shorter leases; 71% free/reduced lunch — lower-income household profile, screen leases tightly.
- Market conditions: Rents flat; 595 active listings in the ZIP; 40 comparable units currently listed for rent nearby; rentals lingering (median 44d on market — plan ~5-8 weeks vacancy on turnover, expect pricing pressure); 52% of comp listings sitting > 30 days — soft ceiling on asking rent; solid renter incomes; 29,883 units permitted in Harris County in 2024 (8,621 in 5+ unit buildings).
- At $11,417/mo this rent would consume 165% of the median local household income ($83k/yr) (locally 994% of renters already pay >50% of income on rent) — very limited rent-growth headroom before tenants either downsize or default.
Forward outlook
- Local home prices are declining (-3.0%/yr); year-one equity from $3k of loan paydown is wiped out by about $13k of value loss. Plan a longer hold.
- Harris County population projected at +47% by 2050 — long-run rental-demand tailwind backs the buy-and-hold thesis.
- At projected returns (-3.0% appreciation + 0.8% rent growth), your $118k cash investment doubles in ~3 years — after that, you're playing with house money.
Negotiation context
- It's been on market 71 days — a 6% lower offer ($395k) is reasonable based on typical stale-listing flexibility.
Risks & watch-outs
- Watch-outs: property tax is 3.6% of price; built in 1940 — expect roof / HVAC / electrical / plumbing capex.
Questions for the listing agent
- It's been on market 71 days. Have you received any prior offers? Is the seller open to a 6% concession, seller financing, or rate buy-down credit?
- Built in 1940 — when were the roof, HVAC, electrical panel, plumbing, and water heater last replaced?
- Property tax is high relative to price — has the assessment been appealed recently, and will the sale trigger a re-assessment?
- Why hasn't it sold? Are there any deal-killer items the seller is aware of (foundation, flood, title, zoning, code violations)?
- Is there a deadline driving the sale (1031 exchange, divorce, estate, relocation)? That informs how much negotiation room exists.
- Schools are D-rated, which usually means shorter tenancies and higher turnover. Who's the typical renter profile here, and what's been the actual vacancy rate?
- Crime grade is F in this area — have there been break-ins, vandalism, or insurance claims at this property in the last 3 years? What carrier currently insures it and at what premium?
- What's the average days-on-market for RENTAL listings here right now (not sales)? A rising rental-DOM trend means longer vacancies and softer asking-rent achievability than the comps imply.
- What's the recent tenant-quality profile in this submarket — average credit score on applications, eviction rate, late-payment / NSF rate, and stable-employment percentage? A property-management company in the area should have these aggregated.
- How much new apartment / multifamily construction is in the pipeline within 1–3 miles? Heavy new supply (>2% of stock underway) typically softens rents 12–24 months out; light construction supports rent growth.
Investment metrics
- 1% rule
- 2.72% ✓
- Cap rate
- 21.71%
- Cash-on-cash
- 55.06%
- DSCR
- 3.45
- GRM
- 3.1
CMA / ARV
- ARV (median comp)
- $346,264
- List price
- $419,990
- Delta
- 21.29%
- Verdict
- OVERPRICED
- Comps
- 15 within 1.0 mi
Projected returns pro-forma
-3.0% appreciation · 0.84% rent growth · sell at horizon
- IRR
- 50.7%
- Equity multiple
- 3.14×
- Total profit
- $251,925
- Equity at exit
- $62,622
- IRR
- 55.2%
- Equity multiple
- 5.84×
- Total profit
- $568,939
- Equity at exit
- $36,313
Cash invested: $117,597 (down + closing). Projections, not guarantees.
Landlord ↔ Tenant lean methodology
- Overall (STATE)
- 87 Strongly Landlord-Friendly
- State Texas
- 87 Strongly Landlord-Friendly · R+5
- County
- — inherits STATE
- City
- — inherits STATE
ZIP-level market 77009
- Rents YoY
- 0.8%
- Active inventory
- 595
- Price-to-rent
- 18.4×
Monthly cashflow live
- Estimated rent
- $11,417 high interval (Pro) →
- Mortgage (P&I)
- −$2,202
- Tax from tax record
- −$1,246 /mo · $14,955/yr
- Insurance
- −$175
- HOA
- −$0
- Vacancy / Maint / Mgmt
- −$2,398
- Net cashflow
- $5,396
Break-even live
Sensitivity live
| Price | -10% $5,633 | -5% $5,515 | +0% $5,396 | +5% $5,277 | +10% $5,158 |
|---|---|---|---|---|---|
| Rent | -10% $4,494 | -5% $4,945 | +0% $5,396 | +5% $5,847 | +10% $6,298 |
| Rate | -1.0pp $5,607 | -0.5pp $5,503 | base $5,396 | +0.5pp $5,287 | +1.0pp $5,176 |
6-unit breakdown (identical units grouped — click to expand)
| Units | Beds | Baths | Est. rent |
|---|---|---|---|
| 6× units | 2 | 2 | $11,418 |
| #1 | 2 | 2 | $1,903 |
| #2 | 2 | 2 | $1,903 |
| #3 | 2 | 2 | $1,903 |
| #4 | 2 | 2 | $1,903 |
| #5 | 2 | 2 | $1,903 |
| #6 | 2 | 2 | $1,903 |
| Total (6 units) | $11,417 | ||
UW: 25.0% down · 7.5% · 30yr · 1.5% tax · 5.0% vac · 8.0% maint · 8.0% mgmt
Financing live
Cash to close
- Down payment
- $104,998
- Closing costs
- $12,600
- Reserves months
- —
- Total cash needed
- —
Loan-product check · same deal, 3 products live
Conventional
25% down · 7.5% · 30yr
- Down + closing
- —
- Monthly P&I
- —
- Monthly cashflow
- —
- DSCR
- —
- Eligible?
- —
Personal DTI + credit; lowest rate.
DSCR
20% down · 8.5% · 30yr
- Down + closing
- —
- Monthly P&I
- —
- Monthly cashflow
- —
- DSCR
- —
- Eligible?
- —
No personal income docs; deal must DSCR.
Hard money
10% down · 12.0% · 12mo
- Down + closing
- —
- Monthly P&I
- —
- Monthly cashflow
- —
- DSCR
- —
- Eligible?
- —
Short-term bridge; refi at stabilization.
Rent comps 40 comps
| Address | Beds | Baths | Sqft | Rent | $/sqft | DOM | Units | Dist |
|---|---|---|---|---|---|---|---|---|
| 2209 Gano St Unit 3 Houston, TX | 2.0 | 1.0 | 700 | $1,200 | $1.71 | 44d | 1 | 0.35mi |
| 2209 Gano St Unit 4 Houston, TX | 2.0 | 1.0 | 700 | $1,250 | $1.79 | 44d | 1 | 0.35mi |
| 914 Bunton St Houston, TX | 3.0 | 2.0 | 1389 | $1,950 | $1.40 | 44d | 1 | 0.54mi |
| 3816 Gano St Unit B Houston, TX | 1.0 | 1.0 | 700 | $1,150 | $1.64 | 44d | 1 | 0.58mi |
| 2316 Freeman St Unit 3 Houston, TX | 1.0 | 1.0 | 750 | $985 | $1.31 | 8d | 1 | 0.66mi |
| 2310 N Main St Houston, TX | 2.0 | 2.0 | 997 | $1,687 | $1.69 | 44d | 1 | 0.71mi |
| 2623 Keene St Apt 514 Houston, TX | 1.0 | 1.0 | 1178 | $1,949 | $1.65 | 44d | 1 | 0.77mi |
| 2623 Keene St Houston, TX | 2.0 | 1.0–2.0 | 965 | $3,280 | $3.40 | 17d | 44 | 0.77mi |
| 2016 N Main St Houston, TX | 2.0 | 2.0 | 1169 | $2,200 | $1.88 | 44d | 1 | 0.80mi |
| 1714 Mary St Houston, TX | 2.0 | 2.0 | 1100 | $2,400 | $2.18 | 44d | 1 | 0.82mi |
| 412 Paschall St Unit 1316398P Houston, TX | 3.0 | 2.0 | 1130 | $4,840 | $4.28 | 13d | 1 | 0.86mi |
| 207 Carl St Houston, TX | 2.0 | 2.0 | 1230 | $2,250 | $1.83 | 44d | 1 | 0.88mi |
| 306 North St Houston, TX | 2.0 | 1.0 | 950 | $1,150 | $1.21 | 44d | 1 | 0.88mi |
| 1550 Burnett St Houston, TX | 1.0–2.0 | 1.0–2.0 | 877 | $2,108 | $2.40 | 0d | 37 | 0.92mi |
| 1725 N Main St Houston, TX | 2.0 | 2.0 | 988 | $2,263 | $2.29 | 44d | 1 | 0.93mi |
| 1556 Leona St Houston, TX | 1.0 | 1.0 | 905 | $1,505 | $1.66 | 44d | 1 | 0.94mi |
| 1514 Everett St Houston, TX | 2.0 | 1.0 | 970 | $1,840 | $1.90 | 20d | 1 | 0.96mi |
| 3303 N Main St Houston, TX | 1.0 | 1.0 | 734 | $1,555 | $2.12 | 44d | 1 | 0.96mi |
| 1550 Leona St Houston, TX | 1.0–2.0 | 1.0–2.0 | 835 | $1,905 | $2.28 | 2d | 19 | 0.97mi |
| 1625 N Main St Houston, TX | 3.0 | 1.0–3.0 | 994 | $2,010 | $2.02 | 0d | 41 | 0.98mi |
| 1550 Leona St Unit 1587 Houston, TX | 2.0 | 2.0 | 1131 | $1,942 | $1.72 | 44d | 1 | 1.00mi |
| 1250 Leona St Houston, TX | 2.0 | 1.0–2.0 | 885 | $1,990 | $2.25 | 0d | 14 | 1.01mi |
| 3031 Sumpter St Unit 50 Houston, TX | 2.0 | 1.0 | 732 | $1,200 | $1.64 | 25d | 1 | 1.04mi |
| 200 Hogan St Houston, TX | 2.0 | 2.0 | 1058 | $1,904 | $1.80 | 12d | 1 | 1.08mi |
| 3502 Campbell St Houston, TX | 2.0 | 1.0 | 725 | $800 | $1.10 | 44d | 1 | 1.19mi |
| 913 McKee St Houston, TX | 1.0 | 1.0 | 714 | $1,003 | $1.40 | 44d | 1 | 1.24mi |
| 711 William St Houston, TX | 1.0 | 1.0 | 1340 | $2,250 | $1.68 | 44d | 1 | 1.36mi |
| 711 William St Houston, TX | 1.0 | 1.0 | 960 | $1,700 | $1.77 | 18d | 1 | 1.36mi |
| 1513 Cage St Houston, TX | 3.0 | 2.0 | 1467 | $1,550 | $1.06 | 44d | 1 | 1.40mi |
| 1860 White Oak Dr Houston, TX | 1.0–2.0 | 1.0 | 812 | $1,800 | $2.22 | 2d | 2 | 1.40mi |
| 2516 Ivy St Houston, TX | 3.0 | 1.0 | 1200 | $1,500 | $1.25 | 44d | 1 | 1.42mi |
| 1499 Crockett St Houston, TX | 2.0 | 2.0 | 1062 | $2,424 | $2.28 | 25d | 1 | 1.43mi |
| 650 McKee St Apt 422 Houston, TX | 2.0 | 2.0 | 966 | $1,690 | $1.75 | 8d | 1 | 1.45mi |
| 650 McKee St Unit 424 Houston, TX | 2.0 | 2.0 | 966 | $1,690 | $1.75 | 6d | 1 | 1.45mi |
| 650 McKee St Apt 425 Houston, TX | 2.0 | 2.0 | 966 | $1,725 | $1.79 | 5d | 1 | 1.45mi |
| 650 McKee St Unit 687 Houston, TX | 2.0 | 2.0 | 966 | $1,715 | $1.78 | 44d | 1 | 1.45mi |
| 650 McKee St Unit 3174 Houston, TX | 3.0 | 2.0 | 1136 | $2,114 | $1.86 | 11d | 1 | 1.45mi |
| 650 McKee St Unit 3112 Houston, TX | 3.0 | 2.0 | 1136 | $2,120 | $1.87 | 0d | 1 | 1.45mi |
| 650 McKee St Unit 683 Houston, TX | 3.0 | 2.0 | 1136 | $2,125 | $1.87 | 44d | 1 | 1.45mi |
| 650 McKee St Unit 2148 Houston, TX | 2.0 | 2.0 | 966 | $1,682 | $1.74 | 3d | 1 | 1.45mi |
Listing history 12 events
-
2026-06-18days on market $419,990 Active 71 DOM
-
2026-06-17days on market $419,990 Active 70 DOM
-
2026-06-16days on market $419,990 Active 69 DOM
-
2026-06-15days on market $419,990 Active 68 DOM
-
2026-06-13days on market $419,990 Active 66 DOM
-
2026-06-10days on market $419,990 Active 62 DOM
-
2026-06-08days on market $419,990 Active 61 DOM
-
2026-06-07days on market $419,990 Active 60 DOM
-
2026-06-04days on market $419,990 Active 57 DOM
-
2026-06-01days on market $419,990 Active 54 DOM
-
2026-05-31days on market $419,990 Active 53 DOM
-
2026-04-08$419,990 Active 901-char remark
Show marketing remark (901 chars)
2904 through 2914 Chapman for SALE. Replotted to 4 lots, each lot is 1787 SQ FT. Total lot Size 7150 SF. 5 Tenant-occupied units. Excellent investment opportunity in the heart of Northside Village! This impressive property boasts 3 duplexes/ 6 units, all currently leased at full capacity with a monthly rent of $775 each. Situated on a rare CITY BLOCK, this gem is strategically located within proximity to major highways, bus routes, and is less than 3 miles from both the highly anticipated East River development and the Downtown area. What makes this investment even more enticing is its designation as a qualified opportunity zone, offering potential tax benefits. As part of an up-and-coming neighborhood experiencing significant growth and new construction, this property stands as a testament to the area's transition. 2 additional lots next to these 4 are also available for sale separately.
ⓘ Source: listings_history table (triggers on properties + properties_extension) + one-shot
backfill from property_details.listing_events for pre-trigger history.
Tax reassessment forecast TX · Resets to sale price
- Current annual tax
- $14,955 · $1,246/mo
- Projected year-2 tax
- $14,955 · $1,246/mo
- Expected delta
- $0/yr ($0/mo · 0.0%)
ⓘ Screening estimate from a state-policy table — verify with the county assessor before closing.
Nearby sold comps map
Loading sold comps map…
Walkable amenities ~0.75 mi
Loading nearby amenities…
Taxation est. · year 1
- Rental income
- $137,004
- − Mortgage interest
- −$23,526
- − Property taxes
- −$14,955
- − Insurance
- −$2,100
- − Repairs & maintenance
- −$10,960
- − Management
- −$10,960
- − Depreciation
- −$12,218
- Taxable income
- $62,285
- Est. tax owed @ 24.0%
- −$14,948
- After-tax cash flow
- $49,800/yr
For passive investors: Depreciation is non-cash, so a rental often shows a tax loss while cash-flowing — sheltering income. Rental losses are passive: they offset passive income freely, and up to $25,000/yr can offset ordinary (W-2) income if you actively participate and your MAGI is under $100k (phasing out to $0 by $150k); unused losses carry forward. On sale, claimed depreciation is recaptured at up to 25%, and gains may owe capital-gains tax (a 1031 exchange can defer both). Figures are a year-1 estimate at your 24.0% rate — not tax advice; consult a CPA.
Condition & rehab AI · 12 photos
This multi-family property is in excellent condition with a well-maintained exterior and interior. It offers a great investment opportunity in a prime location with potential tax benefits.
Value-add opportunities
- Both Painting the exterior and landscaping — Enhances curb appeal and can attract more tenants or buyers.
- Both Upgrading the HVAC system — Improves comfort and energy efficiency, which is beneficial for both rental and resale.
Renovation cost estimate screening
Value-add ROI direction
- Both Painting the exterior and landscaping — Enhances curb appeal and can attract more tenants or buyers. ↑
- Both Upgrading the HVAC system — Improves comfort and energy efficiency, which is beneficial for both rental and resale. ↑
ⓘ Cost ranges are severity-bucket heuristics (US national rule-of-thumb). Get contractor quotes + a written scope before underwriting a rehab budget.
Schools (NCES district)
- District
- Houston ISD
- NCES district ID
- 4823640
- Math proficiency
- 27% ▼ -18.00%
- Reading proficiency
- 35% ▼ -6.00%
- Median HH income
- $46,054
- Composite
- 26.63/100
- National rank
- #7173
- State rank
- #593 of 826 in TX
Livability — Houston
- Score
- 74/100
- State rank
- #184
- US rank
- #4771
Category grades
Schools grade is shown separately in the Schools card above.
Census & demographics
- Census place
- Houston, TX
- County
- Harris County · 4,702,590 people
- City population
- 3,226,434
- Metro
- Houston-The Woodlands-Sugar Land, TX
- Population (ZIP)
- 35,769
- Household income
- $83,148
- Rent vs Own
- Severe rent burden
- 994.0
Population outlook (Harris County) Hauer SSP2
- Today (2025)
- 5,571,493 people
- By 2030
- 6,089,821 · +9.3%
- By 2040
- 7,142,806 · +28.2%
- By 2050
- 8,185,864 · +46.9%
- By 2075
- 10,574,329 · +89.8%
- By 2100
- 12,109,958 · +117.4%
Race, ethnicity, and origin ACS 2023
- Neighborhood character
- Diverse neighborhood (Simpson 0.60)
- Race & ethnicity
- Hispanic / Latino 53% White 33% Two or more races 22% Black 8% Asian 3%
- Hispanic origin (detail)
- Mexican 46%
- Common ancestry
- Italian 2% Lithuanian 2% Slovak 1%
- Foreign-born
- 20% · Canada
- Languages at home
- 55% English-only · Spanish 40% Other Indo-European 2% Other Asian/Pacific 1%
Political lean MEDSL · Harris
- 2024 margin
- Lean D (+5.5) · D 52.0% · R 46.4% · Other 1.6%
- 2008→2024 swing
- +3.9pp toward D · 2008: 1.6pp · 2024: 5.5pp
- All cycles
- 2024: D+5.5 2020: D+13.3 2016: D+12.4 2012: D+0.1 2008: D+1.6
Not yet ingested
- Civics
- —
Market trends
- HPI YoY
- ▼ -533.57%
- Current HPI
- 219.5037
- Rent YoY
- ▲ 0.84%
- Metro
- Houston-The Woodlands-Sugar Land, TX
- State GDP YoY
- ▲ 3.95%
- F500 in state
- 110
Industry mix (Fortune 500 HQ in TX)
| Industry | F500 HQs | Revenue |
|---|---|---|
| Energy | 16 | $1,198B |
|
||
| Technology | 5 | $198B |
|
||
| Engineering / Construction | 4 | $72B |
|
||
| Energy Services | 3 | $60B |
|
||
| Utilities | 3 | $41B |
|
||
| Healthcare | 2 | $330B |
|
||
Price history
1 event — show timeline
- 2026-04-08 Listed $419,990 HARMLS
Property tax history
+508.1%/yrLatest (2025): $14,955 · +508.1% YoY. Source: county tax records.
Cash-flow waterfall
monthlySold comps — $/sqft
last 12 mo · ≤1 miLoading sold comps…