37 Le Blanc St · River Rouge, MI
Flood risk 1/10 · Minimal
- FEMA flood zone
- X (unshaded)
- Chance of flooding over 30 yrs
- 0.0%
- Est. flood insurance / yr
- $507 – $1,088
Fire risk 1/10 · Minimal
- Est. fire insurance / yr
- $784 – $1,456
Heat risk 3/10 · Minor
- Hot days now (above 95°F)
- 7 days/yr
- Hot days in 30 yrs
- 16 days/yr
Wind risk 2/10 · Minimal
- Chance of severe wind over 30 yrs
- —
Air-quality risk 4/10 · Minor
- Unhealthy air days now
- 6 days/yr
- Unhealthy air days in 30 yrs
- 8 days/yr
Risk factors via First Street. Map © Google.
Why this score? — see what drove the C grade
The composite is a weighted blend of 9 inputs, each scored 0–100. Each bar is that input's sub-score; the figure is the points it added to the 100-point composite (weight × sub-score).
- Cash flow +22.9/30.0
- Appreciation +10.0/10.0
- DSCR +7.3/10.0
- 1% rule +6.3/10.0
- ARV discount +4.0/15.0
- Livability +3.2/5.0
- Rent growth +2.5/5.0
- Condition / age +2.5/5.0
- Schools +0.5/10.0
$94,900
🖨 Deal sheet (PDF) 📄 Offer letter ✓ Due diligence
Listing remarks MLS
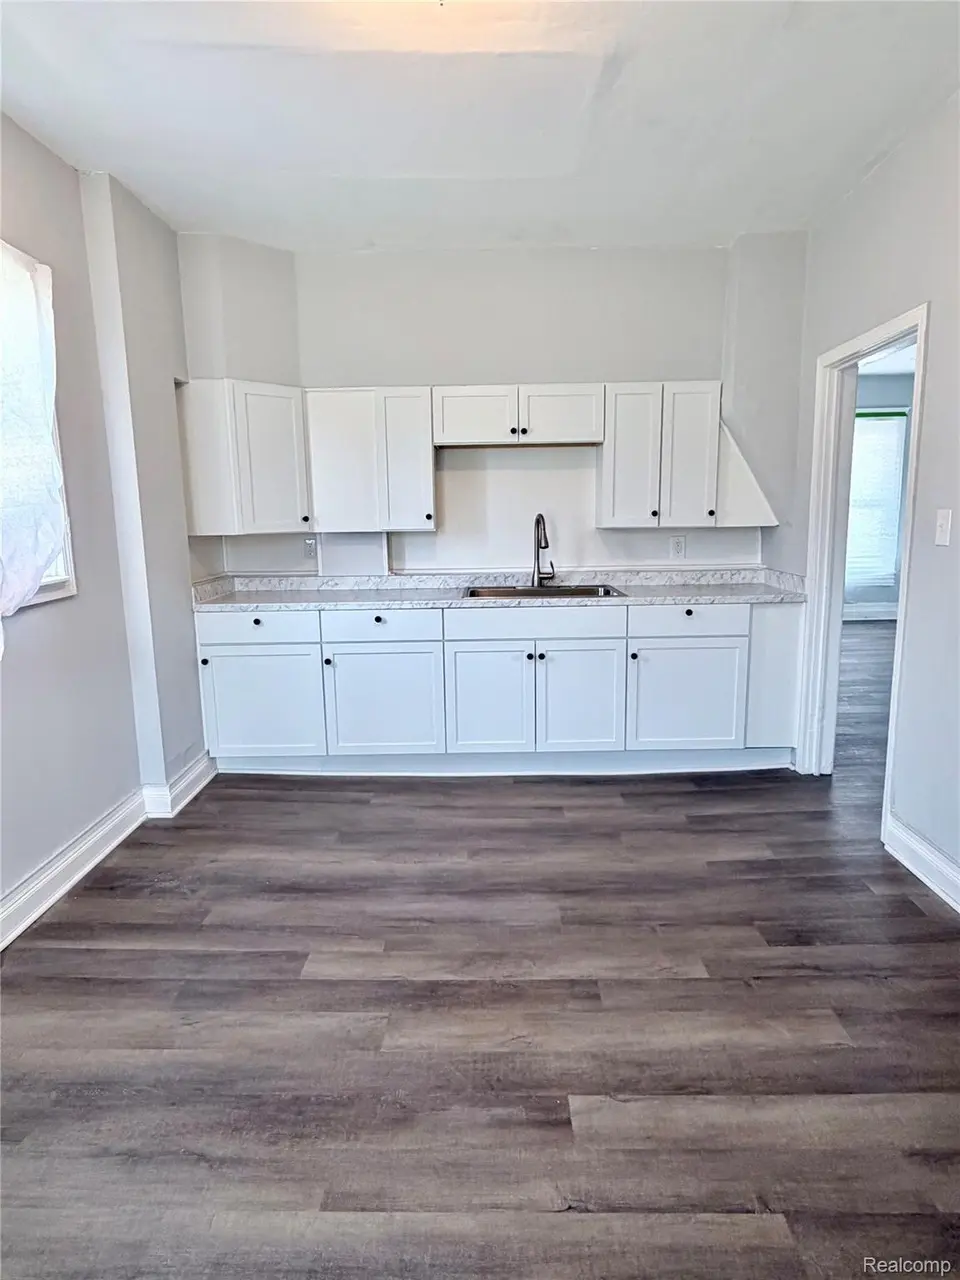
Back on the market! This time, it's ready Go and Show! Calling all investors and 1st time home buyers! This home has been remodeled with new EVERYTHING! Exterior and interior. New roof, siding, windows and flooring throughout. New kitchen and bath remodeled 3/2026. Perfectly located in the center of everything. Seller is acquiring the CO from the city. BATVAI Schedule your appointment today!
Key facts
- Remodeled
- New kitchen
- New siding
Tags
Property features AI
Exterior
- Parking: No garage
- Utilities: Public water; Public sewer; Electric with circuit breakers
- Home design: Single-family residence; Two levels; Ground-level entry with steps
- Construction: Vinyl siding; Asphalt roof
- Exterior features: Enclosed patio/porch; Paved road access
Interior
- Kitchen: No appliances listed other than gas water heater
- Bedrooms: 6 total rooms (includes bedrooms and living spaces)
- Bathrooms: 1 full bathroom
- Heating & cooling: Forced air heating (natural gas); No cooling
- Interior features: Gas water heater; Enclosed basement
- Laundry & utility: No laundry appliances listed
Neighborhood map
What this means for you Summary
Snapshot
- This is a 3-bed/1.0-bath single-family listed at $95k.
Deal economics
- At list price, monthly cash flow is $166 ($2k/yr) — positive.
- The deal already cash-flows at list — no discount required.
- Meets the 1% rule at list price ($1k rent vs $95k).
- Recommended offer: $86k (9.0% below list) — sets the bar for market timing.
Location & tenants
- Location reads 65/100 on livability (#454 in MI) — a middle-class / working-renter tenant base. Strengths: commute A+, cost of living A+, housing B+; Watch: health & safety D, crime F, amenities F.
- River Rouge School District (suburban): math 3% / reading 12% proficiency, ranked #535 of 540 in MI (top 99%) — low school quality limits family demand, transient renter base, plan for 1-2y turnover; 89% free/reduced lunch — lower-income household profile, screen leases tightly.
- Zoned schools: Ann Visger K5 Preparatory Academy (math 2% / reading 8%, grade F, #1,325 of 1,397 statewide, top 99%, 621 students, 93% FRL); Cb Sabbath 68 Preparatory Academy (math 2% / reading 12%, grade F, #481 of 493 statewide, top 98%, 301 students, 93% FRL); River Rouge High School (math 2% / reading 8%, grade F, #704 of 713 statewide, top 100%, 966 students, 85% FRL) — zoned schools at 90% FRL track the district average.
- Market conditions: 60 active listings in the ZIP; 8 comparable units currently listed for rent nearby; rentals at typical pace (median 19d on market — plan ~3-4 weeks tenant-placement turnaround); 2,639 units permitted in Wayne County in 2024 (1,216 in 5+ unit buildings).
Forward outlook
- In year one you build about $10k of equity ($656 loan paydown + $9k appreciation (10.0% local appreciation)).
- Wayne County population projected at -17% by 2050 — secular population decline; favor cash flow + early exit over multi-decade hold.
- At projected returns (10.0% appreciation + 3.0% rent growth), your $27k cash investment doubles in ~3 years — after that, you're playing with house money.
- By year 4, paydown + projected appreciation supports a ~$36k cash-out refi (75% LTV) — recoverable capital for the next deal without selling this one.
Negotiation context
- It's been on market 91 days — a 9% lower offer ($86k) is reasonable based on typical stale-listing flexibility.
- 14 sale attempts since 21y ago; this cycle's ask has dropped $35k (27%) from the opening price — seller is motivated, your offer sets the floor, not the list.
- Current owner paid $35k; list at $95k implies a 171% gain — meaningful room to come down on a strong offer.
Risks & watch-outs
- Watch-outs: built in 1921 — expect roof / HVAC / electrical / plumbing capex.
Questions for the listing agent
- It's been on market 91 days. Have you received any prior offers? Is the seller open to a 9% concession, seller financing, or rate buy-down credit?
- Built in 1921 — when were the roof, HVAC, electrical panel, plumbing, and water heater last replaced?
- Why hasn't it sold? Are there any deal-killer items the seller is aware of (foundation, flood, title, zoning, code violations)?
- Is there a deadline driving the sale (1031 exchange, divorce, estate, relocation)? That informs how much negotiation room exists.
- Schools are F-rated, which usually means shorter tenancies and higher turnover. Who's the typical renter profile here, and what's been the actual vacancy rate?
- Crime grade is F in this area — have there been break-ins, vandalism, or insurance claims at this property in the last 3 years? What carrier currently insures it and at what premium?
- What's the average days-on-market for RENTAL listings here right now (not sales)? A rising rental-DOM trend means longer vacancies and softer asking-rent achievability than the comps imply.
- What's the recent tenant-quality profile in this submarket — average credit score on applications, eviction rate, late-payment / NSF rate, and stable-employment percentage? A property-management company in the area should have these aggregated.
- How much new for-sale + rental construction is in the pipeline within 1–3 miles? Heavy new supply typically softens prices + rents 12–24 months out; constrained supply supports both.
Investment metrics
- 1% rule
- 1.13% ✓
- Cap rate
- 8.40%
- Cash-on-cash
- 7.51%
- DSCR
- 1.33
- GRM
- 7.4
CMA / ARV
- ARV (on-the-fly)
- $88,110
- Comps found
- 12
Show comp detail 12 sales within ~0.75 mi
| Address | Dist | Beds/Ba | Sqft | Sold | Price | $/sf | Match |
|---|---|---|---|---|---|---|---|
| 60 Forest St | 0.27mi | 3/1.0 | 1,005 (+2%) | 2mo | $45,625 | $45 | 84 |
| 47 E Auburn St | 0.25mi | 3/1.0 | 950 (-4%) | 6mo | $35,000 | $37 | 77 |
| 10 E Auburn Ave | 0.18mi | 2/1.0 (-1) | 942 (-5%) | 4mo | $60,000 | $64 | 75 |
| 41 Le Blanc St | 0.01mi | 3/1.0 | 1,133 (+14%) | 2mo | $112,500 | $99 | 73 |
| 251 Richter St | 0.69mi | 3/1.0 | 974 (-2%) | 5mo | $87,700 | $90 | 61 |
| 462 Campbell St | 0.64mi | 3/1.0 | 1,056 (+7%) | 1mo | $37,500 | $36 | 58 |
| 294 Richter St | 0.57mi | 3/1.0 | 1,056 (+7%) | 6mo | $123,000 | $116 | 57 |
| 349 Frazier St | 0.65mi | 3/2.0 | 1,036 (+5%) | 2mo | $120,000 | $116 | 57 |
| 3765 12th St | 0.47mi | 3/2.0 | 864 (-13%) | 2mo | $50,000 | $58 | 52 |
| 319 Polk Ave | 0.61mi | 2/1.0 (-1) | 912 (-8%) | 6mo | $38,500 | $42 | 48 |
| 3973 10th St | 0.74mi | 3/1.5 | 1,064 (+8%) | 6mo | $106,000 | $100 | 46 |
| 3929 14th St | 0.70mi | 3/1.0 | 876 (-12%) | 3mo | $78,000 | $89 | 46 |
Match score weights: distance 35% · size 25% · config 20% · recency 20%. Top-matched comps best support the ARV.
Projected returns pro-forma
10.0% appreciation · 3.0% rent growth · sell at horizon
- IRR
- 29.8%
- Equity multiple
- 3.34×
- Total profit
- $62,306
- Equity at exit
- $85,493
- IRR
- 25.8%
- Equity multiple
- 7.59×
- Total profit
- $175,218
- Equity at exit
- $184,370
Cash invested: $26,572 (down + closing). Projections, not guarantees.
Landlord ↔ Tenant lean methodology
- Overall (STATE)
- 62 Landlord-Friendly
- State Michigan
- 62 Landlord-Friendly · EVEN
- County
- — inherits STATE
- City
- — inherits STATE
ZIP-level market 48218
- Home prices YoY
- 28.4%
- Active inventory
- 60
- Price-to-rent
- 7.4×
Monthly cashflow live
- Estimated rent
- $1,074 high interval (Pro) →
- Mortgage (P&I)
- −$498
- Tax from tax record
- −$145 /mo · $1,741/yr
- Insurance
- −$40
- HOA
- −$0
- Vacancy / Maint / Mgmt
- −$226
- Net cashflow
- $166
Break-even live
Sensitivity live
| Price | -10% $220 | -5% $193 | +0% $166 | +5% $139 | +10% $113 |
|---|---|---|---|---|---|
| Rent | -10% $81 | -5% $124 | +0% $166 | +5% $209 | +10% $251 |
| Rate | -1.0pp $214 | -0.5pp $190 | base $166 | +0.5pp $142 | +1.0pp $117 |
UW: 25.0% down · 7.5% · 30yr · 1.5% tax · 5.0% vac · 8.0% maint · 8.0% mgmt
Financing live
Cash to close
- Down payment
- $23,725
- Closing costs
- $2,847
- Reserves months
- —
- Total cash needed
- —
Loan-product check · same deal, 3 products live
Conventional
25% down · 7.5% · 30yr
- Down + closing
- —
- Monthly P&I
- —
- Monthly cashflow
- —
- DSCR
- —
- Eligible?
- —
Personal DTI + credit; lowest rate.
DSCR
20% down · 8.5% · 30yr
- Down + closing
- —
- Monthly P&I
- —
- Monthly cashflow
- —
- DSCR
- —
- Eligible?
- —
No personal income docs; deal must DSCR.
Hard money
10% down · 12.0% · 12mo
- Down + closing
- —
- Monthly P&I
- —
- Monthly cashflow
- —
- DSCR
- —
- Eligible?
- —
Short-term bridge; refi at stabilization.
Rent comps 8 comps
| Address | Beds | Baths | Sqft | Rent | $/sqft | DOM | Units | Dist |
|---|---|---|---|---|---|---|---|---|
| 3748 15th St Ecorse, MI | 2.0 | 1.0 | 528 | $1,099 | $2.08 | 18d | 1 | 0.57mi |
| 97 Batavia St Unit 1 River Rouge, MI | 2.0 | 1.0 | 900 | $825 | $0.92 | 26d | 1 | 0.79mi |
| 17 W James St Unit 17 W James Lower River Rouge, MI | 2.0 | 1.0 | 900 | $950 | $1.06 | 16d | 1 | 1.00mi |
| 1139 S Bassett St Detroit, MI | 3.0 | 1.0 | 927 | $1,120 | $1.21 | 45d | 1 | 1.05mi |
| 1139 S Bassett St Detroit, MI | 3.0 | 1.0 | 927 | $1,050 | $1.13 | 26d | 1 | 1.05mi |
| 3575 S Ethel St Detroit, MI | 3.0 | 1.0 | 894 | $1,350 | $1.51 | 19d | 1 | 1.09mi |
| 1331 Pingree Ave Lincoln Park, MI | 2.0 | 1.0 | 725 | $1,300 | $1.79 | 1d | 1 | 1.40mi |
| 4435 High St Ecorse, MI | 2.0 | 1.0 | 792 | $1,095 | $1.38 | 6d | 1 | 1.46mi |
Listing history 50 events
-
2026-06-21days on market $94,900 Active 91 DOM
-
2026-06-18days on market $94,900 Active 88 DOM
-
2026-06-17days on market $94,900 Active 87 DOM
-
2026-06-16days on market $94,900 Active 86 DOM
-
2026-06-15days on market $94,900 Active 85 DOM
-
2026-06-13pricedays on market $94,900 Active 83 DOM
-
2026-06-09days on market $104,900 Active 79 DOM
-
2026-06-08days on market $104,900 Active 78 DOM
-
2026-06-07days on market $104,900 Active 77 DOM
-
2026-06-04days on market $104,900 Active 74 DOM
-
2026-06-03days on market $104,900 Active 73 DOM
-
2026-06-02days on market $104,900 Active 72 DOM
-
2026-06-01days on market $104,900 Active 71 DOM
-
2026-05-31days on market $104,900 Active 70 DOM
-
2026-05-16price $104,900 394-char remark
Show marketing remark (394 chars)
Back on the market! This time, it's ready Go and Show! Calling all investors and 1st time home buyers! This home has been remodeled with new EVERYTHING! Exterior and interior. New roof, siding, windows and flooring throughout. New kitchen and bath remodeled 3/2026. Perfectly located in the center of everything. Seller is acquiring the CO from the city. BATVAI Schedule your appointment today!
-
2026-05-15price $104,900
-
2026-05-01price $109,900 394-char remark
Show marketing remark (394 chars)
Back on the market! This time, it's ready Go and Show! Calling all investors and 1st time home buyers! This home has been remodeled with new EVERYTHING! Exterior and interior. New roof, siding, windows and flooring throughout. New kitchen and bath remodeled 3/2026. Perfectly located in the center of everything. Seller is acquiring the CO from the city. BATVAI Schedule your appointment today!
-
2026-04-30price $109,900
-
2026-04-15price $119,900 394-char remark
Show marketing remark (394 chars)
Back on the market! This time, it's ready Go and Show! Calling all investors and 1st time home buyers! This home has been remodeled with new EVERYTHING! Exterior and interior. New roof, siding, windows and flooring throughout. New kitchen and bath remodeled 3/2026. Perfectly located in the center of everything. Seller is acquiring the CO from the city. BATVAI Schedule your appointment today!
-
2026-04-14price $119,900
-
2026-03-25status Active 394-char remark
Show marketing remark (394 chars)
Back on the market! This time, it's ready Go and Show! Calling all investors and 1st time home buyers! This home has been remodeled with new EVERYTHING! Exterior and interior. New roof, siding, windows and flooring throughout. New kitchen and bath remodeled 3/2026. Perfectly located in the center of everything. Seller is acquiring the CO from the city. BATVAI Schedule your appointment today!
-
2026-03-23historical 394-char remark
Show marketing remark (394 chars)
Back on the market! This time, it's ready Go and Show! Calling all investors and 1st time home buyers! This home has been remodeled with new EVERYTHING! Exterior and interior. New roof, siding, windows and flooring throughout. New kitchen and bath remodeled 3/2026. Perfectly located in the center of everything. Seller is acquiring the CO from the city. BATVAI Schedule your appointment today!
-
2026-03-23$129,900 Active
Show marketing remark (394 chars)
Back on the market! This time, it's ready Go and Show! Calling all investors and 1st time home buyers! This home has been remodeled with new EVERYTHING! Exterior and interior. New roof, siding, windows and flooring throughout. New kitchen and bath remodeled 3/2026. Perfectly located in the center of everything. Seller is acquiring the CO from the city. BATVAI Schedule your appointment today!
-
2026-03-22$129,900 Active 394-char remark
Show marketing remark (394 chars)
Back on the market! This time, it's ready Go and Show! Calling all investors and 1st time home buyers! This home has been remodeled with new EVERYTHING! Exterior and interior. New roof, siding, windows and flooring throughout. New kitchen and bath remodeled 3/2026. Perfectly located in the center of everything. Seller is acquiring the CO from the city. BATVAI Schedule your appointment today!
-
2026-02-01historical
-
2026-02-01historical
-
2025-07-17price $89,900
-
2025-07-16price $89,900
-
2025-07-10$120,000 Active
-
2025-07-10$120,000 Active
-
2022-01-07soldstatus $35,000 Sold
-
2022-01-07soldstatus $35,000 Closed
-
2022-01-05status Pending
-
2022-01-05status Pending
-
2021-11-10$39,900 Active
-
2021-11-10$39,900 Active
-
2018-07-20soldstatus $6,900 Sold
-
2018-07-20soldstatus $6,900 Closed
-
2018-07-16status Pending
-
2018-07-16status Pending
-
2018-07-11status Active
-
2018-07-11status Active
-
2018-07-09status Pending
-
2018-07-09status Pending
-
2018-06-06price $8,900
-
2018-06-06price $8,900
-
2018-05-30price $12,900
-
2018-05-30price $12,900
-
2018-04-23$27,000 Active
-
2018-04-23$27,000 Active
ⓘ Source: listings_history table (triggers on properties + properties_extension) + one-shot
backfill from property_details.listing_events for pre-trigger history.
Tax reassessment forecast MI · Partial reset (capped growth)
- Current annual tax
- $1,741 · $145/mo
- Projected year-2 tax
- $1,741 · $145/mo
- Expected delta
- $0/yr ($0/mo · 0.0%)
ⓘ Screening estimate from a state-policy table — verify with the county assessor before closing.
Climate risk First Street
- Flood 1/10 Low FEMA zone X (unshaded) · 0% chance over 30 yrs
- Wildfire 1/10 Low
- Heat 3/10 Moderate 7 d/yr ≥95°F today · 16 d/yr by 30 yrs out
- Wind 2/10 Low
- Air quality 4/10 Moderate 6 unhealthy d/yr today · 8 by 30 yrs out
Nearby sold comps map
Loading sold comps map…
Walkable amenities ~0.75 mi
Loading nearby amenities…
Taxation est. · year 1
- Rental income
- $12,889
- − Mortgage interest
- −$5,316
- − Property taxes
- −$1,741
- − Insurance
- −$474
- − Repairs & maintenance
- −$1,031
- − Management
- −$1,031
- − Depreciation
- −$2,761
- Taxable income
- $535
- Est. tax owed @ 24.0%
- −$128
- After-tax cash flow
- $1,867/yr
For passive investors: Depreciation is non-cash, so a rental often shows a tax loss while cash-flowing — sheltering income. Rental losses are passive: they offset passive income freely, and up to $25,000/yr can offset ordinary (W-2) income if you actively participate and your MAGI is under $100k (phasing out to $0 by $150k); unused losses carry forward. On sale, claimed depreciation is recaptured at up to 25%, and gains may owe capital-gains tax (a 1031 exchange can defer both). Figures are a year-1 estimate at your 24.0% rate — not tax advice; consult a CPA.
Schools (NCES district)
- District
- River Rouge School District
- NCES district ID
- 2629760
- Math proficiency
- 3% ▼ -7.00%
- Reading proficiency
- 12% ▼ -4.00%
- Median HH income
- $26,664
- Composite
- 5.29/100
- National rank
- #10033
- State rank
- #535 of 540 in MI
Livability — River Rouge
- Score
- 65/100
- State rank
- #454
- US rank
- #12700
Category grades
Schools grade is shown separately in the Schools card above.
Census & demographics
- Census place
- River Rouge, MI
- City population
- 7,096
- Population (ZIP)
- 7,096
Population outlook (Wayne County) Hauer SSP2
- Today (2025)
- 1,675,273 people
- By 2030
- 1,620,300 · -3.3%
- By 2040
- 1,502,341 · -10.3%
- By 2050
- 1,384,039 · -17.4%
- By 2075
- 1,124,592 · -32.9%
- By 2100
- 881,193 · -47.4%
Race, ethnicity, and origin ACS 2023
- Neighborhood character
- Diverse neighborhood (Simpson 0.66)
- Race & ethnicity
- Black 45% White 34% Two or more races 16% Hispanic / Latino 16%
- Hispanic origin (detail)
- Mexican 9% Puerto Rican 5%
- Common ancestry
- Romanian 4% Lithuanian 2% Italian 1%
- Foreign-born
- 6% · Canada
- Languages at home
- 86% English-only · Spanish 11% Arabic 2% Other Indo-European 1%
Political lean MEDSL · Wayne
- 2024 margin
- Strong D (+29.0) · D 62.7% · R 33.7% · Other 3.6%
- 2008→2024 swing
- -20.5pp toward R · 2008: 49.5pp · 2024: 29.0pp
- All cycles
- 2024: D+29.0 2020: D+38.1 2016: D+37.3 2012: D+46.9 2008: D+49.5
Not yet ingested
- Civics
- —
Market trends
- HPI YoY
- ▲ 77.93%
- Current HPI
- 352.3551
- Rent YoY
- —
- Metro
- —
- State GDP YoY
- ▲ 1.37%
- F500 in state
- 28
Industry mix (Fortune 500 HQ in MI)
| Industry | F500 HQs | Revenue |
|---|---|---|
| Automotive Parts | 3 | $48B |
|
||
| Automotive | 2 | $372B |
|
||
| Chemicals | 1 | $45B |
|
||
| Automotive Retail | 1 | $29B |
|
||
| Healthcare / Medical Devices | 1 | $23B |
|
||
| Automotive Technology | 1 | $20B |
|
||
Price history
+109.8% since first listed44 events — show timeline
- 2026-05-16 Price Changed $104,900 MiRealSource-MiMLS
- 2026-05-15 Price Changed $104,900 REALCOMP
- 2026-05-01 Price Changed $109,900 MiRealSource-MiMLS
- 2026-04-30 Price Changed $109,900 REALCOMP
- 2026-04-15 Price Changed $119,900 MiRealSource-MiMLS
- 2026-04-14 Price Changed $119,900 REALCOMP
- 2026-03-25 Relisted — MiRealSource-MiMLS
- 2026-03-23 Listing Removed — MiRealSource-MiMLS
- 2026-03-23 Listed $129,900 REALCOMP
- 2026-03-22 Listed $129,900 MiRealSource-MiMLS
- 2026-02-01 Listing Removed — REALCOMP
- 2026-02-01 Listing Removed — MiRealSource-MiMLS
- 2025-07-17 Price Changed $89,900 MiRealSource-MiMLS
- 2025-07-16 Price Changed $89,900 REALCOMP
- 2025-07-10 Listed $120,000 MiRealSource-MiMLS
- 2025-07-10 Listed $120,000 REALCOMP
- 2022-01-07 Sold (MLS) $35,000 MiRealSource-MiMLS
- 2022-01-07 Sold (MLS) $35,000 REALCOMP
- 2022-01-05 Pending — MiRealSource-MiMLS
- 2022-01-05 Pending — REALCOMP
- 2021-11-10 Listed $39,900 MiRealSource-MiMLS
- 2021-11-10 Listed $39,900 REALCOMP
- 2018-07-20 Sold (MLS) $6,900 MiRealSource-MiMLS
- 2018-07-20 Sold (MLS) $6,900 REALCOMP
- 2018-07-16 Pending — MiRealSource-MiMLS
- 2018-07-16 Pending — REALCOMP
- 2018-07-11 Relisted — MiRealSource-MiMLS
- 2018-07-11 Relisted — REALCOMP
- 2018-07-09 Pending — MiRealSource-MiMLS
- 2018-07-09 Pending — REALCOMP
- 2018-06-06 Price Changed $8,900 MiRealSource-MiMLS
- 2018-06-06 Price Changed $8,900 REALCOMP
- 2018-05-30 Price Changed $12,900 MiRealSource-MiMLS
- 2018-05-30 Price Changed $12,900 REALCOMP
- 2018-04-23 Listed $27,000 MiRealSource-MiMLS
- 2018-04-23 Listed $27,000 REALCOMP
- 2009-07-14 Sold (MLS) $2,500 REALCOMP
- 2009-03-12 Listed $4,900 REALCOMP
- 2005-08-03 Sold (Public Records) $45,000 Public Records
- 2005-06-16 Sold (MLS) $45,000 MiRealSource-MiMLS
- 2005-05-25 Listing Removed — MiRealSource-MiMLS
- 2005-05-19 Listing Removed — REALCOMP
- 2005-02-05 Listed $49,900 REALCOMP
- 2005-02-01 Listed $49,999 MiRealSource-MiMLS
Property tax history
-1.2%/yrLatest (2025): $1,741 · -7.8% YoY. Source: county tax records.
Cash-flow waterfall
monthlySold comps — $/sqft
last 12 mo · ≤1 miLoading sold comps…