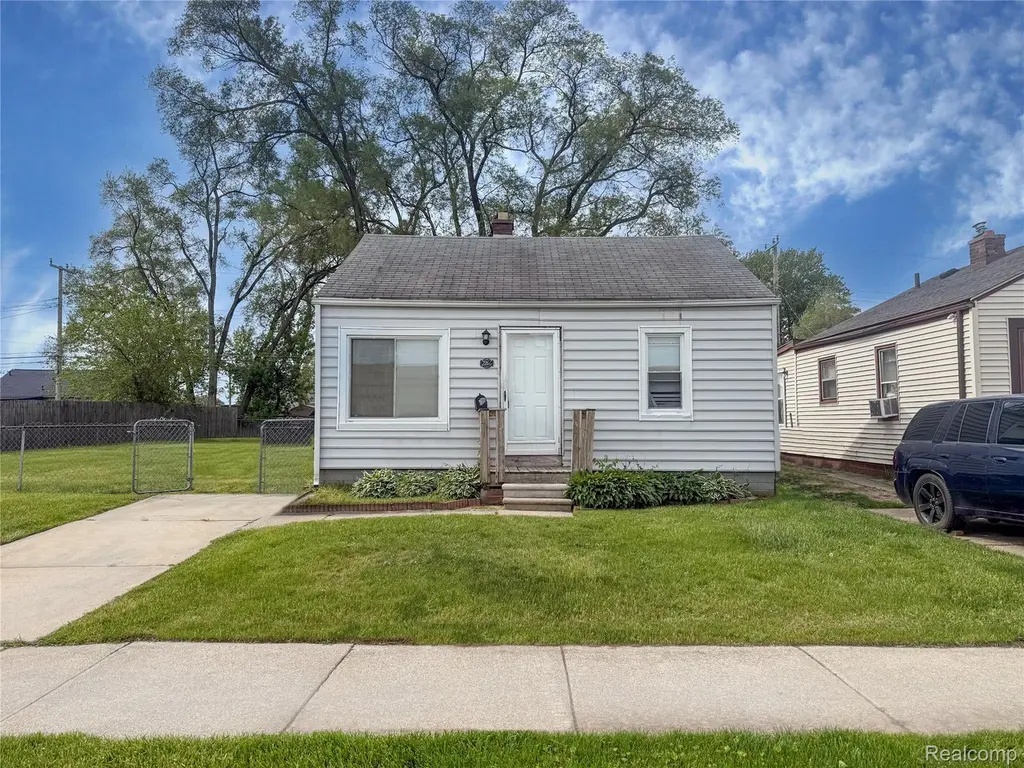
2266 John B Ave · Warren, MI
Flood risk 1/10 · Minimal
- FEMA flood zone
- X (unshaded)
- Chance of flooding over 30 yrs
- 0.0%
- Est. flood insurance / yr
- $507 – $1,088
Fire risk 1/10 · Minimal
- Est. fire insurance / yr
- $784 – $1,456
Heat risk 3/10 · Minor
- Hot days now (above 97°F)
- 7 days/yr
- Hot days in 30 yrs
- 15 days/yr
Wind risk 1/10 · Minimal
- Chance of severe wind over 30 yrs
- —
Air-quality risk 4/10 · Minor
- Unhealthy air days now
- 4 days/yr
- Unhealthy air days in 30 yrs
- 6 days/yr
Risk factors via First Street. Map © Google.
Why this score? — see what drove the C+ grade
The composite is a weighted blend of 9 inputs, each scored 0–100. Each bar is that input's sub-score; the figure is the points it added to the 100-point composite (weight × sub-score).
- Cash flow +30.0/30.0
- 1% rule +10.0/10.0
- DSCR +10.0/10.0
- Livability +3.7/5.0
- Rent growth +3.1/5.0
- Condition / age +2.5/5.0
- ARV discount +2.1/15.0
- Schools +1.3/10.0
- Appreciation +0.0/10.0
$74,900
🖨 Deal sheet (PDF) 📄 Offer letter ✓ Due diligence
Listing remarks MLS
Great opportunity for homeowners and investors alike! This cozy Warren home with a spacious backyard offers plenty of potential to make it your own. Perfect for buyers looking to add their personal touches and updates while building equity. Bring your vision and unlock the potential this home has to offer!
Key facts
- 4,356 sq ft lot
- Built 1949
- Listed 26 days
Property features AI
Finance
- Other: Listed by TrustLink Real Estate
Exterior
- Parking: No garage
- Utilities: Public water; Public sewer
- Home design: Single-family residence; One story; Vinyl siding
- Construction: Vinyl siding construction; One-level layout
- Exterior features: Paved road access; Lot approximately 0.1 acres (35 x 123)
Interior
- Bedrooms: 2 total rooms (includes living areas and sleeping areas)
- Bathrooms: 1 full bathroom
- Heating & cooling: Forced air heating (natural gas); No central cooling
- Interior features: Crawl space basement; Ground-level entry
Neighborhood map
What this means for you Summary
Snapshot
- This is a 2-bed/1.0-bath single-family listed at $75k.
Deal economics
- At list price, monthly cash flow is $450 ($5k/yr) — positive.
- The deal already cash-flows at list — no discount required.
- Meets the 1% rule at list price ($1k rent vs $75k).
- Recommended offer: $74k (1.5% below list) — sets the bar for market timing.
- Cap rate 13.5% vs local median 5.2% in Warren — top-decile yield for the area; either an underpriced asset or a hidden risk that comps aren't pricing in. Stress-test before assuming the spread holds.
Location & tenants
- Location reads 74/100 on livability (#171 in MI, #4,491 nationally) — a middle-class / working-renter tenant base. Strengths: commute A+, cost of living A+, housing A+; Watch: amenities D, employment D, crime D-.
- Fitzgerald Public Schools (urban): math 8% / reading 23% proficiency, ranked #503 of 540 in MI (top 93%) — low school quality limits family demand, transient renter base, plan for 1-2y turnover; 77% free/reduced lunch — lower-income household profile, screen leases tightly.
- Zoned schools: Westview Elementary School (math 12% / reading 22%, grade F, #1,149 of 1,397 statewide, top 84%, 451 students, 84% FRL); Pd Chatterton Middle School (math 9% / reading 27%, grade F, #433 of 493 statewide, top 88%, 410 students, 86% FRL); Fitzgerald Senior High School (math 8% / reading 26%, grade F, #636 of 713 statewide, top 89%, 806 students, 82% FRL).
- Market conditions: Rents rising (+2.4%/yr); 170 active listings in the ZIP; 10 comparable units currently listed for rent nearby; rentals at typical pace (median 26d on market — plan ~3-4 weeks tenant-placement turnaround); 1,321 units permitted in Macomb County in 2024 (86 in 5+ unit buildings).
Forward outlook
- Local home prices are declining (-3.0%/yr); year-one equity from $518 of loan paydown is wiped out by about $2k of value loss. Plan a longer hold.
- Macomb County population projected at +9% by 2050 — modest demand growth; plan on rents tracking national, not racing it.
- At projected returns (-3.0% appreciation + 2.4% rent growth), your $21k cash investment doubles in ~5 years — after that, you're playing with house money.
Negotiation context
- It's been on market 26 days — a 2% lower offer ($74k) is reasonable based on typical stale-listing flexibility.
- 5 sale attempts since 25y ago with the ask held roughly flat each time — persistent listings suggest the price (not the market) is what's stuck; bring a comps-based counter.
- Current owner paid $7k; list at $75k implies a 970% gain — meaningful room to come down on a strong offer.
Risks & watch-outs
- Watch-outs: built in 1949 — expect roof / HVAC / electrical / plumbing capex.
Questions for the listing agent
- Built in 1949 — when were the roof, HVAC, electrical panel, plumbing, and water heater last replaced?
- Is there a deadline driving the sale (1031 exchange, divorce, estate, relocation)? That informs how much negotiation room exists.
- Schools are D-rated, which usually means shorter tenancies and higher turnover. Who's the typical renter profile here, and what's been the actual vacancy rate?
- Crime grade is D in this area — have there been break-ins, vandalism, or insurance claims at this property in the last 3 years? What carrier currently insures it and at what premium?
- What's the average days-on-market for RENTAL listings here right now (not sales)? A rising rental-DOM trend means longer vacancies and softer asking-rent achievability than the comps imply.
- What's the recent tenant-quality profile in this submarket — average credit score on applications, eviction rate, late-payment / NSF rate, and stable-employment percentage? A property-management company in the area should have these aggregated.
- How much new for-sale + rental construction is in the pipeline within 1–3 miles? Heavy new supply typically softens prices + rents 12–24 months out; constrained supply supports both.
Investment metrics
- 1% rule
- 1.65% ✓
- Cap rate
- 13.50%
- Cash-on-cash
- 25.74%
- DSCR
- 2.15
- GRM
- 5.1
CMA / ARV
- ARV (on-the-fly)
- $66,816
- Comps found
- 2
Show comp detail 2 sales within ~0.75 mi
| Address | Dist | Beds/Ba | Sqft | Sold | Price | $/sf | Match |
|---|---|---|---|---|---|---|---|
| 1929 Michael Ave | 0.47mi | 1/1.0 (-1) | 598 (+4%) | 11mo | $69,500 | $116 | 58 |
| 1424 E Harry Ave | 0.75mi | 1/1.0 (-1) | 643 (+12%) | 10mo | $65,000 | $101 | 33 |
Match score weights: distance 35% · size 25% · config 20% · recency 20%. Top-matched comps best support the ARV.
Projected returns pro-forma
-3.0% appreciation · 2.35% rent growth · sell at horizon
- IRR
- 18.7%
- Equity multiple
- 1.75×
- Total profit
- $15,735
- Equity at exit
- $11,168
- IRR
- 26.6%
- Equity multiple
- 3.26×
- Total profit
- $47,440
- Equity at exit
- $6,476
Cash invested: $20,972 (down + closing). Projections, not guarantees.
Landlord ↔ Tenant lean methodology
- Overall (STATE)
- 62 Landlord-Friendly
- State Michigan
- 62 Landlord-Friendly · EVEN
- County
- — inherits STATE
- City
- — inherits STATE
ZIP-level market 48091
- Rents YoY
- 2.4%
- Active inventory
- 170
- Price-to-rent
- 5.1×
Monthly cashflow live
- Estimated rent
- $1,235 high interval (Pro) →
- Mortgage (P&I)
- −$393
- Tax from tax record
- −$102 /mo · $1,223/yr
- Insurance
- −$31
- HOA
- −$0
- Vacancy / Maint / Mgmt
- −$259
- Net cashflow
- $450
Break-even live
Sensitivity live
| Price | -10% $492 | -5% $471 | +0% $450 | +5% $429 | +10% $407 |
|---|---|---|---|---|---|
| Rent | -10% $352 | -5% $401 | +0% $450 | +5% $499 | +10% $547 |
| Rate | -1.0pp $488 | -0.5pp $469 | base $450 | +0.5pp $430 | +1.0pp $411 |
UW: 25.0% down · 7.5% · 30yr · 1.5% tax · 5.0% vac · 8.0% maint · 8.0% mgmt
Financing live
Cash to close
- Down payment
- $18,725
- Closing costs
- $2,247
- Reserves months
- —
- Total cash needed
- —
Loan-product check · same deal, 3 products live
Conventional
25% down · 7.5% · 30yr
- Down + closing
- —
- Monthly P&I
- —
- Monthly cashflow
- —
- DSCR
- —
- Eligible?
- —
Personal DTI + credit; lowest rate.
DSCR
20% down · 8.5% · 30yr
- Down + closing
- —
- Monthly P&I
- —
- Monthly cashflow
- —
- DSCR
- —
- Eligible?
- —
No personal income docs; deal must DSCR.
Hard money
10% down · 12.0% · 12mo
- Down + closing
- —
- Monthly P&I
- —
- Monthly cashflow
- —
- DSCR
- —
- Eligible?
- —
Short-term bridge; refi at stabilization.
Rent comps 10 comps
| Address | Beds | Baths | Sqft | Rent | $/sqft | DOM | Units | Dist |
|---|---|---|---|---|---|---|---|---|
| 21155 Warner Ave Warren, MI | 2.0 | 1.0 | 756 | $1,029 | $1.36 | 25d | 1 | 0.18mi |
| 21516 Dequindre Rd Warren, MI | 1.0–2.0 | 1.0 | 837 | $1,375 | $1.64 | 23d | 1 | 0.33mi |
| 1621 E Evelyn Ave Hazel Park, MI | 2.0 | 1.0 | 749 | $1,295 | $1.73 | 19d | 1 | 0.52mi |
| 1211 E Bernhard Ave Hazel Park, MI | 2.0 | 1.0 | 721 | $1,500 | $2.08 | 25d | 1 | 0.68mi |
| 27 E Milton Ave Hazel Park, MI | 1.0 | 1.0 | 568 | $1,050 | $1.85 | 16d | 1 | 1.20mi |
| 23115 Tawas Ave Hazel Park, MI | 2.0 | 1.0 | 706 | $1,375 | $1.95 | 25d | 1 | 1.38mi |
| 155 W George Ave Hazel Park, MI | 2.0 | 1.0 | 725 | $1,000 | $1.38 | 25d | 1 | 1.38mi |
| 1770 E Woodward Heights Blvd Hazel Park, MI | 1.0–2.0 | 1.0 | 712 | $1,400 | $1.96 | 6d | 1 | 1.41mi |
| 1770 E Woodward Heights Blvd Unit C1 Hazel Park, MI | 1.0 | 1.0 | 550 | $1,350 | $2.45 | 25d | 1 | 1.41mi |
| 1770 E Woodward Heights Blvd Unit C6 Hazel Park, MI | 1.0 | 1.0 | 550 | $1,100 | $2.00 | 25d | 1 | 1.41mi |
Listing history 25 events
-
2026-06-21days on market $74,900 Active 26 DOM
-
2026-06-18days on market $74,900 Active 23 DOM
-
2026-06-17days on market $74,900 Active 22 DOM
-
2026-06-16days on market $74,900 Active 21 DOM
-
2026-06-15days on market $74,900 Active 20 DOM
-
2026-06-13days on market $74,900 Active 18 DOM
-
2026-06-13days on market $74,900 Active 17 DOM
-
2026-06-09days on market $74,900 Active 14 DOM
-
2026-06-08days on market $74,900 Active 13 DOM
-
2026-06-07days on market $74,900 Active 12 DOM
-
2026-06-04days on market $74,900 Active 9 DOM
-
2026-06-03days on market $74,900 Active 8 DOM
-
2026-06-02days on market $74,900 Active 7 DOM
-
2026-06-01days on market $74,900 Active 6 DOM
-
2026-05-31days on market $74,900 Active 5 DOM
-
2026-05-26$74,900 Active
Show marketing remark (307 chars)
Great opportunity for homeowners and investors alike! This cozy Warren home with a spacious backyard offers plenty of potential to make it your own. Perfect for buyers looking to add their personal touches and updates while building equity. Bring your vision and unlock the potential this home has to offer!
-
2026-05-26$74,900 Active 307-char remark
Show marketing remark (307 chars)
Great opportunity for homeowners and investors alike! This cozy Warren home with a spacious backyard offers plenty of potential to make it your own. Perfect for buyers looking to add their personal touches and updates while building equity. Bring your vision and unlock the potential this home has to offer!
-
2010-04-09soldstatus $7,000 112-char remark
Show marketing remark (112 chars)
Bank Owned 2 bedroom large Yard. Priced to sell. Quick response. EZ to view. Central air, refrigerator included.
-
2010-04-09soldstatus $7,000
Show marketing remark (112 chars)
Bank Owned 2 bedroom large Yard. Priced to sell. Quick response. EZ to view. Central air, refrigerator included.
-
2010-03-10$6,650 112-char remark
Show marketing remark (112 chars)
Bank Owned 2 bedroom large Yard. Priced to sell. Quick response. EZ to view. Central air, refrigerator included.
-
2010-03-10$6,650
Show marketing remark (112 chars)
Bank Owned 2 bedroom large Yard. Priced to sell. Quick response. EZ to view. Central air, refrigerator included.
-
2001-07-25soldstatus $37,000
-
2001-05-07historical
-
2001-03-29$42,000
-
1996-08-23soldstatus $30,000
ⓘ Source: listings_history table (triggers on properties + properties_extension) + one-shot
backfill from property_details.listing_events for pre-trigger history.
Tax reassessment forecast MI · Partial reset (capped growth)
- Current annual tax
- $1,223 · $102/mo
- Projected year-2 tax
- $1,223 · $102/mo
- Expected delta
- $0/yr ($0/mo · 0.0%)
ⓘ Screening estimate from a state-policy table — verify with the county assessor before closing.
Climate risk First Street
- Flood 1/10 Low FEMA zone X (unshaded) · 0% chance over 30 yrs
- Wildfire 1/10 Low
- Heat 3/10 Moderate 7 d/yr ≥97°F today · 15 d/yr by 30 yrs out
- Wind 1/10 Low
- Air quality 4/10 Moderate 4 unhealthy d/yr today · 6 by 30 yrs out
Nearby sold comps map
Loading sold comps map…
Walkable amenities ~0.75 mi
Loading nearby amenities…
Taxation est. · year 1
- Rental income
- $14,822
- − Mortgage interest
- −$4,196
- − Property taxes
- −$1,223
- − Insurance
- −$374
- − Repairs & maintenance
- −$1,186
- − Management
- −$1,186
- − Depreciation
- −$2,179
- Taxable income
- $4,478
- Est. tax owed @ 24.0%
- −$1,075
- After-tax cash flow
- $4,323/yr
For passive investors: Depreciation is non-cash, so a rental often shows a tax loss while cash-flowing — sheltering income. Rental losses are passive: they offset passive income freely, and up to $25,000/yr can offset ordinary (W-2) income if you actively participate and your MAGI is under $100k (phasing out to $0 by $150k); unused losses carry forward. On sale, claimed depreciation is recaptured at up to 25%, and gains may owe capital-gains tax (a 1031 exchange can defer both). Figures are a year-1 estimate at your 24.0% rate — not tax advice; consult a CPA.
Schools (NCES district)
- District
- Fitzgerald Public Schools
- NCES district ID
- 2614460
- Math proficiency
- 8% ▼ -8.00%
- Reading proficiency
- 23% ▼ -11.00%
- Median HH income
- $34,828
- Composite
- 12.67/100
- National rank
- #9608
- State rank
- #503 of 540 in MI
Livability — Warren
- Score
- 74/100
- State rank
- #171
- US rank
- #4491
Category grades
Schools grade is shown separately in the Schools card above.
Census & demographics
- Census place
- Warren, MI
- County
- Macomb County · 638,552 people
- City population
- 114,937
- Metro
- Detroit-Warren-Dearborn, MI
- Population (ZIP)
- 30,696
- Household income
- $54,230
- Rent vs Own
- Severe rent burden
- 1296.0
Population outlook (Macomb County) Hauer SSP2
- Today (2025)
- 925,296 people
- By 2030
- 948,226 · +2.5%
- By 2040
- 983,961 · +6.3%
- By 2050
- 1,010,200 · +9.2%
- By 2075
- 1,076,222 · +16.3%
- By 2100
- 1,077,065 · +16.4%
Race, ethnicity, and origin ACS 2023
- Neighborhood character
- Diverse neighborhood (Simpson 0.68)
- Race & ethnicity
- White 47% Black 25% Asian 19% Two or more races 5% Hispanic / Latino 3% Native American 2%
- Common ancestry
- Romanian 7% Lithuanian 2% Slovak 1%
- Foreign-born
- 16% · Canada
- Languages at home
- 77% English-only · Other Indo-European 14% Other Asian/Pacific 3% Russian/Polish/Slavic 2%
Political lean MEDSL · Macomb
- 2024 margin
- R (+13.7) · D 42.2% · R 55.9% · Other 1.9%
- 2008→2024 swing
- -22.3pp toward R · 2008: 8.6pp · 2024: -13.7pp
- All cycles
- 2024: R+13.7 2020: R+8.1 2016: R+11.6 2012: D+4.0 2008: D+8.6
Not yet ingested
- Civics
- —
Market trends
- HPI YoY
- ▼ -199.66%
- Current HPI
- 177.9273
- Rent YoY
- ▲ 2.35%
- Metro
- Detroit-Warren-Dearborn, MI
- State GDP YoY
- ▲ 1.37%
- F500 in state
- 28
Industry mix (Fortune 500 HQ in MI)
| Industry | F500 HQs | Revenue |
|---|---|---|
| Automotive Parts | 3 | $48B |
|
||
| Automotive | 2 | $372B |
|
||
| Chemicals | 1 | $45B |
|
||
| Automotive Retail | 1 | $29B |
|
||
| Healthcare / Medical Devices | 1 | $23B |
|
||
| Automotive Technology | 1 | $20B |
|
||
Price history
+149.7% since first listed10 events — show timeline
- 2026-05-26 Listed $74,900 REALCOMP
- 2026-05-26 Listed $74,900 MiRealSource-MiMLS
- 2010-04-09 Sold (MLS) $7,000 REALCOMP
- 2010-04-09 Sold (MLS) $7,000 MiRealSource-MiMLS
- 2010-03-10 Listed $6,650 REALCOMP
- 2010-03-10 Listed $6,650 MiRealSource-MiMLS
- 2001-07-25 Sold (MLS) $37,000 MiRealSource-MiMLS
- 2001-05-07 Listing Removed — MiRealSource-MiMLS
- 2001-03-29 Listed $42,000 MiRealSource-MiMLS
- 1996-08-23 Sold (Public Records) $30,000 Public Records
Property tax history
+8.7%/yrLatest (2025): $1,223 · +2.5% YoY. Source: county tax records.
Cash-flow waterfall
monthlySold comps — $/sqft
last 12 mo · ≤1 miLoading sold comps…