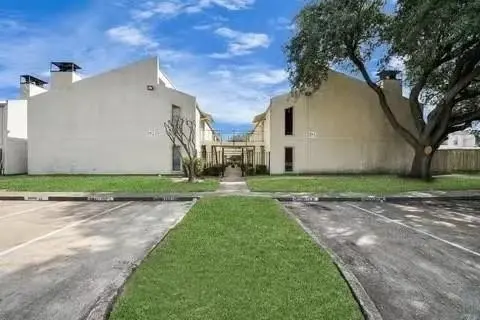
10075 Westpark Dr #52 · Houston, TX
Flood risk 1/10 · Minimal
- FEMA flood zone
- X (unshaded)
- Chance of flooding over 30 yrs
- 0.0%
- Est. flood insurance / yr
- $507 – $1,088
Fire risk 1/10 · Minimal
- Est. fire insurance / yr
- $1,222 – $2,270
Heat risk 9/10 · Severe
- Hot days now (above 110°F)
- 7 days/yr
- Hot days in 30 yrs
- 23 days/yr
Wind risk 9/10 · Severe
- Chance of severe wind over 30 yrs
- 99.0%
Air-quality risk 2/10 · Minimal
- Unhealthy air days now
- 2 days/yr
- Unhealthy air days in 30 yrs
- 2 days/yr
Risk factors via First Street. Map © Google.
Why this score? — see what drove the D grade
The composite is a weighted blend of 9 inputs, each scored 0–100. Each bar is that input's sub-score; the figure is the points it added to the 100-point composite (weight × sub-score).
- Cash flow +10.9/30.0
- 1% rule +9.3/10.0
- ARV discount +7.5/15.0
- Livability +3.7/5.0
- DSCR +3.2/10.0
- Condition / age +2.5/5.0
- Schools +2.1/10.0
- Rent growth +1.9/5.0
- Appreciation +0.0/10.0
$65,000
🖨 Deal sheet (PDF) 📄 Offer letter ✓ Due diligence
Key facts
- $260 HOA
- Community pool
- Built 1978
Neighborhood map
What this means for you Summary
Snapshot
- This is a 1-bed/1.0-bath condo listed at $65k.
Deal economics
- At list price, monthly cash flow is $-29 ($-346/yr) — negative.
- To cash-flow at today's rent, offer at most $60k (7.8% below list).
- Meets the 1% rule at list price ($930 rent vs $65k).
- Recommended offer: $60k (7.8% below list) — sets the bar for cash-flow.
- Cap rate 5.8% vs local median 3.1% in Houston — top-decile yield for the area; either an underpriced asset or a hidden risk that comps aren't pricing in. Stress-test before assuming the spread holds.
Location & tenants
- Location reads 74/100 on livability (#184 in TX, #4,771 nationally) — a middle-class / working-renter tenant base. Strengths: amenities A+, cost of living A+, housing A+; Watch: crime F.
- Alief ISD (urban): math 23% / reading 28% proficiency, ranked #717 of 826 in TX (top 87%) — low school quality limits family demand, transient renter base, plan for 1-2y turnover; 74% free/reduced lunch — lower-income household profile, screen leases tightly.
- Zoned schools: Sneed El (math 19% / reading 19%, grade F, #3,739 of 4,322 statewide, top 87%, 1,033 students, 92% FRL); O'Donnell Middle (math 32% / reading 33%, grade F, #947 of 1,662 statewide, top 58%, 1,230 students, 89% FRL); Alief Isd J J A E P (13 students, 77% FRL).
- Market conditions: Rents soft (-2.3%/yr); 249 active listings in the ZIP; 40 comparable units currently listed for rent nearby; rentals leasing fast (median 13d on market — plan ~1-2 weeks tenant-placement turnaround); 29,883 units permitted in Harris County in 2024 (8,621 in 5+ unit buildings).
Forward outlook
- Local home prices are declining (-3.0%/yr); year-one equity from $449 of loan paydown is wiped out by about $2k of value loss. Plan a longer hold.
- Harris County population projected at +47% by 2050 — long-run rental-demand tailwind backs the buy-and-hold thesis.
Negotiation context
- Only 6 days on market — expect competitive offers; lowballing is unlikely to land.
Risks & watch-outs
- Watch-outs: property tax is 2.5% of price; HOA is 28% of rent.
- Climate carrying-cost: severe wind risk, 99% chance of damaging wind over 30y; extreme-heat days projected 7→23/yr by 2055 (HVAC capex compounding) — expect insurance premiums to compound above CPI over the hold.
Questions for the listing agent
- What do current leases actually rent for vs. the listed asking? Can we see a recent rent roll and the last 12 months of T-12 income?
- Built in 1978 — when were the roof, HVAC, electrical panel, plumbing, and water heater last replaced?
- Property tax is high relative to price — has the assessment been appealed recently, and will the sale trigger a re-assessment?
- What does the HOA fee cover, when was the last increase, and are there any pending special assessments or reserve-fund shortfalls?
- Any open or pending special assessments — roof, HVAC, plumbing, elevator, façade? What's the per-unit balance and payoff schedule, and is the seller paying it off at close or rolling it to the buyer?
- Is there a deadline driving the sale (1031 exchange, divorce, estate, relocation)? That informs how much negotiation room exists.
- Schools are D-rated, which usually means shorter tenancies and higher turnover. Who's the typical renter profile here, and what's been the actual vacancy rate?
- Crime grade is F in this area — have there been break-ins, vandalism, or insurance claims at this property in the last 3 years? What carrier currently insures it and at what premium?
- The area grade is low — what's the realistic commute time and amenity access for the typical tenant pool here? Any planned neighborhood developments (good or bad) we should know about?
- What's the average days-on-market for RENTAL listings here right now (not sales)? A rising rental-DOM trend means longer vacancies and softer asking-rent achievability than the comps imply.
- What's the recent tenant-quality profile in this submarket — average credit score on applications, eviction rate, late-payment / NSF rate, and stable-employment percentage? A property-management company in the area should have these aggregated.
- How much new apartment / multifamily construction is in the pipeline within 1–3 miles? Heavy new supply (>2% of stock underway) typically softens rents 12–24 months out; light construction supports rent growth.
Investment metrics
- 1% rule
- 1.43% ✓
- Cap rate
- 5.76%
- Cash-on-cash
- -1.90%
- DSCR
- 0.92
- GRM
- 5.8
CMA / ARV
No comps found within radius.
Projected returns pro-forma
-3.0% appreciation · 0.0% rent growth · sell at horizon
- IRR
- -25.2%
- Equity multiple
- 0.18×
- Total profit
- $-14,886
- Equity at exit
- $9,692
- IRR
- -54.1%
- Equity multiple
- -0.37×
- Total profit
- $-25,017
- Equity at exit
- $5,620
Cash invested: $18,200 (down + closing). Projections, not guarantees.
Landlord ↔ Tenant lean methodology
- Overall (STATE)
- 87 Strongly Landlord-Friendly
- State Texas
- 87 Strongly Landlord-Friendly · R+5
- County
- — inherits STATE
- City
- — inherits STATE
ZIP-level market 77042
- Rents YoY
- -2.3%
- Active inventory
- 249
- Price-to-rent
- 5.8×
Monthly cashflow live
- Estimated rent
- $930 high interval (Pro) →
- Mortgage (P&I)
- −$341
- Tax from tax record
- −$136 /mo · $1,628/yr
- Insurance
- −$27
- HOA
- −$260
- Vacancy / Maint / Mgmt
- −$195
- Net cashflow
- $-29
Break-even live
Sensitivity live
| Price | -10% $8 | -5% $-10 | +0% $-29 | +5% $-47 | +10% $-66 |
|---|---|---|---|---|---|
| Rent | -10% $-102 | -5% $-66 | +0% $-29 | +5% $8 | +10% $45 |
| Rate | -1.0pp $4 | -0.5pp $-12 | base $-29 | +0.5pp $-46 | +1.0pp $-63 |
UW: 25.0% down · 7.5% · 30yr · 1.5% tax · 5.0% vac · 8.0% maint · 8.0% mgmt
Financing live
Cash to close
- Down payment
- $16,250
- Closing costs
- $1,950
- Reserves months
- —
- Total cash needed
- —
Loan-product check · same deal, 3 products live
Conventional
25% down · 7.5% · 30yr
- Down + closing
- —
- Monthly P&I
- —
- Monthly cashflow
- —
- DSCR
- —
- Eligible?
- —
Personal DTI + credit; lowest rate.
DSCR
20% down · 8.5% · 30yr
- Down + closing
- —
- Monthly P&I
- —
- Monthly cashflow
- —
- DSCR
- —
- Eligible?
- —
No personal income docs; deal must DSCR.
Hard money
10% down · 12.0% · 12mo
- Down + closing
- —
- Monthly P&I
- —
- Monthly cashflow
- —
- DSCR
- —
- Eligible?
- —
Short-term bridge; refi at stabilization.
Rent comps 40 comps
| Address | Beds | Baths | Sqft | Rent | $/sqft | DOM | Units | Dist |
|---|---|---|---|---|---|---|---|---|
| 10070 Westpark Dr Houston, TX | 1.0–2.0 | 1.0–2.0 | 720 | $785 | $1.09 | 1d | 19 | 0.12mi |
| 10051 Westpark Dr #263 Houston, TX | 1.0 | 1.0 | 680 | $950 | $1.40 | 45d | 1 | 0.14mi |
| 3900 Woodchase Dr Houston, TX | 1.0 | 1.0 | 502 | $1,000 | $1.99 | 45d | 1 | 0.16mi |
| 10100 Westpark Dr Houston, TX | 1.0–2.0 | 1.0–2.0 | 891 | $729 | $0.82 | 19d | 21 | 0.19mi |
| 3900 Woodchase Dr Houston, TX | 1.0–2.0 | 1.0 | 612 | $1,000 | $1.63 | 1d | 3 | 0.21mi |
| 10010 Westpark Dr Unit 1104 Houston, TX | 1.0 | 1.0 | 710 | $1,069 | $1.51 | 26d | 1 | 0.21mi |
| 3406 Woodchase Dr Houston, TX | 1.0 | 1.0 | 704 | $864 | $1.23 | 45d | 1 | 0.33mi |
| 3400 Woodchase Dr Houston, TX | 1.0–2.0 | 1.0–2.0 | 797 | $699 | $0.88 | 4d | 28 | 0.39mi |
| 3777 S Gessner Rd Unit 1108 Houston, TX | 1.0 | 1.0 | 670 | $920 | $1.37 | 45d | 1 | 0.39mi |
| 3777 S Gessner Rd Unit 1213 Houston, TX | 1.0 | 1.0 | 576 | $820 | $1.42 | 45d | 1 | 0.39mi |
| 9850 Richmond Ave Houston, TX | 1.0–2.0 | 1.0–2.0 | 898 | $1,239 | $1.38 | 0d | 9 | 0.46mi |
| 9940 Richmond Ave Houston, TX | 1.0 | 1.0 | 733 | $925 | $1.26 | 17d | 1 | 0.51mi |
| 5909 Ranchester Dr Unit 5951 Houston, TX | 1.0 | 1.0 | 380 | $771 | $2.03 | 12d | 1 | 0.54mi |
| 5909 Ranchester Dr Unit 5960 Houston, TX | 1.0 | 1.0 | 563 | $708 | $1.26 | 17d | 1 | 0.54mi |
| 5909 Ranchester Dr Unit 1162 Houston, TX | 1.0 | 1.0 | 610 | $836 | $1.37 | 9d | 1 | 0.54mi |
| 5909 Ranchester Dr Unit 1165 Houston, TX | 1.0 | 1.0 | 610 | $825 | $1.35 | 1d | 1 | 0.54mi |
| 5909 Ranchester Dr Unit 165 Houston, TX | 1.0 | 1.0 | 380 | $741 | $1.95 | 1d | 1 | 0.54mi |
| 5909 Ranchester Dr Unit 5930 Houston, TX | 1.0 | 1.0 | 610 | $875 | $1.43 | 12d | 1 | 0.54mi |
| 9940 Richmond Ave Unit 9991 Houston, TX | 1.0 | 1.0 | 733 | $945 | $1.29 | 45d | 1 | 0.55mi |
| 3230 S Gessner Rd Houston, TX | 1.0–2.0 | 1.0 | 710 | $759 | $1.07 | 26d | 9 | 0.56mi |
| 5915 Ranchester Dr Houston, TX | 1.0 | 1.0 | 563 | $841 | $1.49 | 45d | 1 | 0.57mi |
| 8707 Town Park Dr Unit 3282 Houston, TX | 1.0 | 1.0 | 653 | $799 | $1.22 | 26d | 1 | 0.64mi |
| 9797 Meadowglen Ln Unit 9839 Houston, TX | 1.0 | 1.0 | 410 | $613 | $1.50 | 1d | 1 | 0.66mi |
| 9797 Meadowglen Ln Unit 1396 Houston, TX | 1.0 | 1.0 | 527 | $644 | $1.22 | 1d | 1 | 0.66mi |
| 8701 Town Park Dr Houston, TX | 1.0–2.0 | 1.0–2.0 | 890 | $655 | $0.74 | 0d | 75 | 0.67mi |
| 10575 Westpark Dr Houston, TX | 1.0–2.0 | 1.0–2.0 | 878 | $1,121 | $1.28 | 0d | 20 | 0.70mi |
| 4033 W Sam Houston Pkwy S Houston, TX | 1.0 | 1.0 | 365 | $1,104 | $3.02 | 1d | 12 | 0.72mi |
| 3505 W Sam Houston Pkwy S Houston, TX | 1.0–2.0 | 1.0–2.0 | 914 | $1,267 | $1.39 | 0d | 26 | 0.77mi |
| 3030 Elmside Dr Houston, TX | 1.0–2.0 | 1.0–2.0 | 870 | $849 | $0.98 | 1d | 20 | 0.79mi |
| 2900 S Gessner Rd Unit 1047 Houston, TX | 1.0 | 1.0 | 715 | $750 | $1.05 | 13d | 1 | 0.80mi |
| 2900 S Gessner Rd Unit 2974 Houston, TX | 1.0 | 1.0 | 715 | $785 | $1.10 | 15d | 1 | 0.87mi |
| 2900 S Gessner Rd Unit 2974 Houston, TX | 1.0 | 1.0 | 715 | $699 | $0.98 | 1d | 1 | 0.87mi |
| 2900 S Gessner Rd Unit 1162 Houston, TX | 1.0 | 1.0 | 715 | $710 | $0.99 | 9d | 1 | 0.87mi |
| 2900 S Gessner Rd Unit 2951 Houston, TX | 1.0 | 1.0 | 715 | $699 | $0.98 | 15d | 1 | 0.87mi |
| 2927 Briarpark Dr Houston, TX | 1.0 | 1.0 | 641 | $1,040 | $1.62 | 45d | 1 | 0.88mi |
| 2727 Elmside Dr Unit 1174 Houston, TX | 1.0 | 1.0 | 623 | $990 | $1.59 | 17d | 1 | 0.91mi |
| 9698 Winsome Ln Unit MOWR Houston, TX | 1.0 | 1.0 | 641 | $1,001 | $1.56 | 14d | 1 | 0.92mi |
| 2921 Briarpark Dr Unit 1174 Houston, TX | 1.0 | 1.0 | 639 | $1,024 | $1.60 | 1d | 1 | 0.94mi |
| 2921 Briarpark Dr Unit 1165 Houston, TX | 1.0 | 1.0 | 639 | $983 | $1.54 | 1d | 1 | 0.94mi |
| 2921 Briarpark Dr Unit 2942 Houston, TX | 1.0 | 1.0 | 639 | $1,029 | $1.61 | 15d | 1 | 0.94mi |
HOA detail condo
- Monthly dues
- $260 · $3,120/yr
- Assessments
- None detected in remarks — confirm with the listing agent.
Listing history 5 events
-
2026-06-21days on market $65,000 Active 6 DOM
-
2026-06-18days on market $65,000 Active 3 DOM
-
2026-06-17days on market $65,000 Active 2 DOM
-
2026-06-15status $65,000 Active 1 DOM
-
2026-06-15$65,000 Coming Soon 1 DOM
ⓘ Source: listings_history table (triggers on properties + properties_extension) + one-shot
backfill from property_details.listing_events for pre-trigger history.
Tax reassessment forecast TX · Resets to sale price
- Current annual tax
- $1,628 · $136/mo
- Projected year-2 tax
- $1,628 · $136/mo
- Expected delta
- $0/yr ($0/mo · 0.0%)
ⓘ Screening estimate from a state-policy table — verify with the county assessor before closing.
Climate risk First Street
- Flood 1/10 Low FEMA zone X (unshaded) · 0% chance over 30 yrs
- Wildfire 1/10 Low
- Heat 9/10 Extreme 7 d/yr ≥110°F today · 23 d/yr by 30 yrs out
- Wind 9/10 Extreme 99% chance of damaging wind over 30 yrs
- Air quality 2/10 Low 2 unhealthy d/yr today · 2 by 30 yrs out
Nearby sold comps map
Loading sold comps map…
Walkable amenities ~0.75 mi
Loading nearby amenities…
Taxation est. · year 1
- Rental income
- $11,161
- − Mortgage interest
- −$3,641
- − Property taxes
- −$1,628
- − Insurance
- −$325
- − Repairs & maintenance
- −$893
- − Management
- −$893
- − HOA
- −$3,120
- − Depreciation
- −$1,891
- Taxable loss
- −$1,229
- Est. tax savings @ 24.0%
- +$295
- After-tax cash flow
- $-51/yr
For passive investors: Depreciation is non-cash, so a rental often shows a tax loss while cash-flowing — sheltering income. Rental losses are passive: they offset passive income freely, and up to $25,000/yr can offset ordinary (W-2) income if you actively participate and your MAGI is under $100k (phasing out to $0 by $150k); unused losses carry forward. On sale, claimed depreciation is recaptured at up to 25%, and gains may owe capital-gains tax (a 1031 exchange can defer both). Figures are a year-1 estimate at your 24.0% rate — not tax advice; consult a CPA.
Schools (NCES district)
- District
- Alief ISD
- NCES district ID
- 4807830
- Math proficiency
- 23% ▼ -19.00%
- Reading proficiency
- 28% ▼ -8.00%
- Median HH income
- $37,775
- Composite
- 21.29/100
- National rank
- #8391
- State rank
- #717 of 826 in TX
Livability — Houston
- Score
- 74/100
- State rank
- #184
- US rank
- #4771
Category grades
Schools grade is shown separately in the Schools card above.
Census & demographics
- Census place
- Houston, TX
- County
- Harris County · 4,702,590 people
- City population
- 3,226,434
- Metro
- Houston-The Woodlands-Sugar Land, TX
- Population (ZIP)
- 38,721
- Household income
- $59,097
- Rent vs Own
- Severe rent burden
- 3994.0
Population outlook (Harris County) Hauer SSP2
- Today (2025)
- 5,571,493 people
- By 2030
- 6,089,821 · +9.3%
- By 2040
- 7,142,806 · +28.2%
- By 2050
- 8,185,864 · +46.9%
- By 2075
- 10,574,329 · +89.8%
- By 2100
- 12,109,958 · +117.4%
Race, ethnicity, and origin ACS 2023
- Neighborhood character
- Highly diverse neighborhood (Simpson 0.72)
- Race & ethnicity
- Hispanic / Latino 36% White 31% Black 24% Two or more races 18% Asian 6% Native American 1%
- Hispanic origin (detail)
- Mexican 14% Cuban 4%
- Common ancestry
- Romanian 1% Serbian 1% Italian 1%
- Foreign-born
- 35% · Canada, Jamaica, China
- Languages at home
- 55% English-only · Spanish 31% Other Indo-European 2% Russian/Polish/Slavic 2%
Political lean MEDSL · Harris
- 2024 margin
- Lean D (+5.5) · D 52.0% · R 46.4% · Other 1.6%
- 2008→2024 swing
- +3.9pp toward D · 2008: 1.6pp · 2024: 5.5pp
- All cycles
- 2024: D+5.5 2020: D+13.3 2016: D+12.4 2012: D+0.1 2008: D+1.6
Not yet ingested
- Civics
- —
Market trends
- HPI YoY
- ▼ -234.36%
- Current HPI
- 215.9671
- Rent YoY
- ▼ -2.30%
- Metro
- Houston-The Woodlands-Sugar Land, TX
- State GDP YoY
- ▲ 3.95%
- F500 in state
- 110
Industry mix (Fortune 500 HQ in TX)
| Industry | F500 HQs | Revenue |
|---|---|---|
| Energy | 16 | $1,198B |
|
||
| Technology | 5 | $198B |
|
||
| Engineering / Construction | 4 | $72B |
|
||
| Energy Services | 3 | $60B |
|
||
| Utilities | 3 | $41B |
|
||
| Healthcare | 2 | $330B |
|
||
Price history
6 events — show timeline
- 2026-06-14 Coming Soon $65,000 HARMLS
- 2026-06-07 Price Changed $900 HARMLS
- 2026-05-25 Listed for Rent $800 HARMLS
- 2017-06-07 Sold (Public Records) — Public Records
- 2006-03-15 Sold (Public Records) — Public Records
- 2001-03-12 Sold (Public Records) — Public Records
Property tax history
+7.9%/yrLatest (2025): $1,628 · -0.8% YoY. Source: county tax records.
Cash-flow waterfall
monthlySold comps — $/sqft
last 12 mo · ≤1 miLoading sold comps…