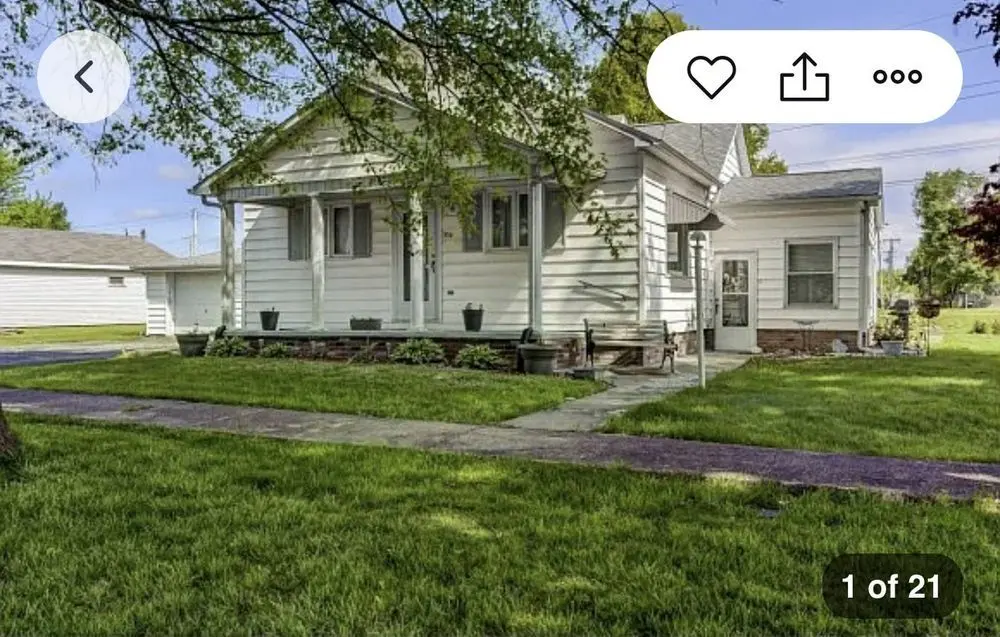
306 Elm St · Kincaid, IL
Flood risk 1/10 · Minimal
- FEMA flood zone
- X (unshaded)
- Chance of flooding over 30 yrs
- 0.0%
- Est. flood insurance / yr
- $473 – $860
Fire risk 1/10 · Minimal
- Est. fire insurance / yr
- $804 – $1,492
Heat risk 4/10 · Minor
- Hot days now (above 105°F)
- 7 days/yr
- Hot days in 30 yrs
- 20 days/yr
Wind risk 2/10 · Minimal
- Chance of severe wind over 30 yrs
- 2.0%
Air-quality risk 2/10 · Minimal
- Unhealthy air days now
- 0 days/yr
- Unhealthy air days in 30 yrs
- 1 days/yr
Risk factors via First Street. Map © Google.
Why this score? — see what drove the C+ grade
The composite is a weighted blend of 9 inputs, each scored 0–100. Each bar is that input's sub-score; the figure is the points it added to the 100-point composite (weight × sub-score).
- Cash flow +19.7/30.0
- ARV discount +14.7/15.0
- Appreciation +6.9/10.0
- DSCR +6.2/10.0
- 1% rule +4.6/10.0
- Livability +3.2/5.0
- Rent growth +2.5/5.0
- Condition / age +2.5/5.0
- Schools +1.8/10.0
$105,000
🖨 Deal sheet 📄 Offer letter ✓ Due diligence
Listing remarks MLS
"Neat as a pin" 2 bedroom, 1 1/2 bath home has nice kitchen with lots of oak cabinets and all appliances. Sunroom has sliding glass doors. Half bath in full basement. New roof 2009. Huge 2 1/2 car garage with storage area in back for lawn equipment and extras.
Key facts
- Propane
- 0.41 acre lot
- Built 1930
Tags
Property features AI
Exterior
- Home design: House
- Exterior features: Lot of approximately 17,952 sq ft
Neighborhood map
What this means for you Summary
Snapshot
- This is a 2-bed/3.0-bath single-family listed at $105k.
Deal economics
- At list price, monthly cash flow is $124 ($1k/yr) — positive.
- The deal already cash-flows at list — no discount required.
- To meet the 1% rule (rent ≥ 1% of price), the offer needs to be $100k (4.4% below list).
- Recommended offer: $100k (4.4% below list) — sets the bar for 1% rule.
Location & tenants
- Location reads 65/100 on livability (#622 in IL) — a middle-class / working-renter tenant base. Strengths: crime A+, cost of living A+, housing A+; Watch: schools F, amenities F, commute F.
- South Fork SD 14 (rural): math 10% / reading 25% proficiency, ranked #744 of 919 in IL (top 81%) — low school quality limits family demand, transient renter base, plan for 1-2y turnover.
- Market conditions: 5 active listings in the ZIP; 26 units permitted in Christian County in 2024 (0 in 5+ unit buildings).
Forward outlook
- In year one you build about $5k of equity ($726 loan paydown + $4k appreciation (3.7% local appreciation)).
- Christian County population projected at -24% by 2050 — secular population decline; favor cash flow + early exit over multi-decade hold.
- At projected returns (3.7% appreciation + 3.0% rent growth), your $29k cash investment doubles in ~5 years — after that, you're playing with house money.
- By year 8, paydown + projected appreciation supports a ~$34k cash-out refi (75% LTV) — recoverable capital for the next deal without selling this one.
Negotiation context
- Only 14 days on market — expect competitive offers; lowballing is unlikely to land.
- 2 sale attempts since 14y ago with the ask held roughly flat each time — persistent listings suggest the price (not the market) is what's stuck; bring a comps-based counter.
- Current owner paid $54k; list at $105k implies a 94% gain — meaningful room to come down on a strong offer.
Risks & watch-outs
- Watch-outs: built in 1930 — expect roof / HVAC / electrical / plumbing capex.
Questions for the listing agent
- Built in 1930 — when were the roof, HVAC, electrical panel, plumbing, and water heater last replaced?
- Is there a deadline driving the sale (1031 exchange, divorce, estate, relocation)? That informs how much negotiation room exists.
- Schools are F-rated, which usually means shorter tenancies and higher turnover. Who's the typical renter profile here, and what's been the actual vacancy rate?
- What's the average days-on-market for RENTAL listings here right now (not sales)? A rising rental-DOM trend means longer vacancies and softer asking-rent achievability than the comps imply.
- What's the recent tenant-quality profile in this submarket — average credit score on applications, eviction rate, late-payment / NSF rate, and stable-employment percentage? A property-management company in the area should have these aggregated.
- How much new for-sale + rental construction is in the pipeline within 1–3 miles? Heavy new supply typically softens prices + rents 12–24 months out; constrained supply supports both.
Investment metrics
- 1% rule
- 0.96% ✗
- Cap rate
- 7.71%
- Cash-on-cash
- 5.05%
- DSCR
- 1.22
- GRM
- 8.7
CMA / ARV
- ARV (on-the-fly)
- $125,080
- Comps found
- 12
Show comp detail 12 sales within ~0.75 mi
| Address | Dist | Beds/Ba | Sqft | Sold | Price | $/sf | Match |
|---|---|---|---|---|---|---|---|
| 223 Elm St | 0.07mi | 2/2.0 | 1,018 (-14%) | 6mo | $110,000 | $108 | 65 |
| 200 Hickory St | 0.18mi | 3/2.0 (+1) | 1,244 (+5%) | 12mo | $145,000 | $117 | 64 |
| 214 Hickory St | 0.16mi | 3/1.0 (+1) | 1,190 (+1%) | 20mo | $126,000 | $106 | 62 |
| 121 Walnut St | 0.22mi | 3/2.0 (+1) | 1,308 (+11%) | 3mo | $165,000 | $126 | 60 |
| 305 North Ave | 0.31mi | 2/1.0 | 1,232 (+4%) | 18mo | $30,000 | $24 | 55 |
| 305 North Ave | 0.31mi | 2/1.0 | 1,232 (+4%) | 18mo | $30,000 | $24 | 55 |
| 326 Hickory St | 0.15mi | 3/1.0 (+1) | 1,128 (-4%) | 22mo | $103,500 | $92 | 55 |
| 313 Hickory St | 0.15mi | 3/1.0 (+1) | 1,128 (-4%) | 22mo | $88,000 | $78 | 54 |
| 108 Garrison St | 0.42mi | 2/1.0 | 1,100 (-7%) | 11mo | $130,000 | $118 | 52 |
| 460 George St | 0.66mi | 1/1.0 (-1) | 1,237 (+5%) | 5mo | $61,000 | $49 | 43 |
| 107 N Avenue St | 0.19mi | 3/1.0 (+1) | 1,320 (+12%) | 21mo | $125,000 | $95 | 41 |
| 201 Miss Debra Ave | 0.72mi | 2/1.0 | 1,048 (-11%) | 6mo | $121,000 | $115 | 34 |
Match score weights: distance 35% · size 25% · config 20% · recency 20%. Top-matched comps best support the ARV.
Projected returns pro-forma
3.73% appreciation · 3.0% rent growth · sell at horizon
- IRR
- 14.1%
- Equity multiple
- 1.84×
- Total profit
- $24,606
- Equity at exit
- $51,574
- IRR
- 15.4%
- Equity multiple
- 3.44×
- Total profit
- $71,626
- Equity at exit
- $83,053
Cash invested: $29,400 (down + closing). Projections, not guarantees.
Landlord ↔ Tenant lean methodology
- Overall (STATE)
- 43 Moderately Tenant-Leaning
- State Illinois
- 43 Moderately Tenant-Leaning · D+7
- County
- — inherits STATE
- City
- — inherits STATE
ZIP-level market 62540
- Home prices YoY
- 2.5%
- Active inventory
- 5
- Price-to-rent
- 8.7×
Monthly cashflow live
- Estimated rent
- $1,004 medium interval (Pro) →
- Mortgage (P&I)
- −$551
- Tax from tax record
- −$75 /mo · $898/yr
- Insurance
- −$44
- HOA
- −$0
- Vacancy / Maint / Mgmt
- −$211
- Net cashflow
- $124
Break-even live
UW: 25.0% down · 7.5% · 30yr · 1.5% tax · 5.0% vac · 8.0% maint · 8.0% mgmt
Financing live
Cash to close
- Down payment
- $26,250
- Closing costs
- $3,150
- Reserves months
- —
- Total cash needed
- —
Loan-product check · same deal, 3 products live
Conventional
25% down · 7.5% · 30yr
- Down + closing
- —
- Monthly P&I
- —
- Monthly cashflow
- —
- DSCR
- —
- Eligible?
- —
Personal DTI + credit; lowest rate.
DSCR
20% down · 8.5% · 30yr
- Down + closing
- —
- Monthly P&I
- —
- Monthly cashflow
- —
- DSCR
- —
- Eligible?
- —
No personal income docs; deal must DSCR.
Hard money
10% down · 12.0% · 12mo
- Down + closing
- —
- Monthly P&I
- —
- Monthly cashflow
- —
- DSCR
- —
- Eligible?
- —
Short-term bridge; refi at stabilization.
Listing history 11 events
-
2026-06-18days on market $105,000 Active 14 DOM
-
2026-06-17days on market $105,000 Active 13 DOM
-
2026-06-16days on market $105,000 Active 12 DOM
-
2026-06-15days on market $105,000 Active 11 DOM
-
2026-06-13days on market $105,000 Active 9 DOM
-
2026-06-12days on market $105,000 Active 8 DOM
-
2026-06-09days on market $105,000 Active 5 DOM
-
2026-06-08days on market $105,000 Active 4 DOM
-
2026-06-07days on market $105,000 Active 3 DOM
-
2026-06-05remarks 114-char remark
-
2026-06-05$105,000 Active 1 DOM
ⓘ Source: listings_history table (triggers on properties + properties_extension) + one-shot
backfill from property_details.listing_events for pre-trigger history.
Tax reassessment forecast IL · Partial reset (capped growth)
- Current annual tax
- $898 · $75/mo
- Projected year-2 tax
- $1,641 · $137/mo
- Expected delta
- +$742/yr (+$62/mo · 82.6%)
ⓘ Screening estimate from a state-policy table — verify with the county assessor before closing.
Climate risk First Street
- Flood 1/10 Low FEMA zone X (unshaded) · 0% chance over 30 yrs
- Wildfire 1/10 Low
- Heat 4/10 Moderate 7 d/yr ≥105°F today · 20 d/yr by 30 yrs out
- Wind 2/10 Low 2% chance of damaging wind over 30 yrs
- Air quality 2/10 Low 0 unhealthy d/yr today · 1 by 30 yrs out
Nearby sold comps map
Loading sold comps map…
Walkable amenities ~0.75 mi
Loading nearby amenities…
Taxation est. · year 1
- Rental income
- $12,045
- − Mortgage interest
- −$5,882
- − Property taxes
- −$898
- − Insurance
- −$525
- − Repairs & maintenance
- −$964
- − Management
- −$964
- − Depreciation
- −$3,055
- Taxable loss
- −$242
- Est. tax savings @ 24.0%
- +$58
- After-tax cash flow
- $1,542/yr
For passive investors: Depreciation is non-cash, so a rental often shows a tax loss while cash-flowing — sheltering income. Rental losses are passive: they offset passive income freely, and up to $25,000/yr can offset ordinary (W-2) income if you actively participate and your MAGI is under $100k (phasing out to $0 by $150k); unused losses carry forward. On sale, claimed depreciation is recaptured at up to 25%, and gains may owe capital-gains tax (a 1031 exchange can defer both). Figures are a year-1 estimate at your 24.0% rate — not tax advice; consult a CPA.
Schools (NCES district)
- District
- South Fork SD 14
- NCES district ID
- 1736640
- Math proficiency
- 10% ▼ -5.00%
- Reading proficiency
- 25% ▲ 5.00%
- Median HH income
- $41,398
- Composite
- 18.34/100
- National rank
- #14054
- State rank
- #744 of 919 in IL
Livability — Kincaid
- Score
- 65/100
- State rank
- #622
- US rank
- #12725
Category grades
Schools grade is shown separately in the Schools card above.
Census & demographics
- Census place
- Kincaid, IL
- City population
- 1,287
- Population (ZIP)
- 1,287
Population outlook (Christian County) Hauer SSP2
- Today (2025)
- 31,182 people
- By 2030
- 29,787 · -4.5%
- By 2040
- 26,793 · -14.1%
- By 2050
- 23,757 · -23.8%
- By 2075
- 17,333 · -44.4%
- By 2100
- 11,573 · -62.9%
Race, ethnicity, and origin ACS 2023
- Neighborhood character
- Predominantly White (94%)
- Race & ethnicity
- White 94% Hispanic / Latino 5% Two or more races 2%
- Hispanic origin (detail)
- Mexican 2%
- Common ancestry
- Lithuanian 2% Danish 1% Italian 1%
- Foreign-born
- 0%
Political lean MEDSL · Christian
- 2024 margin
- Solid R (+46.7) · D 25.9% · R 72.6% · Other 1.5%
- 2008→2024 swing
- -40.4pp toward R · 2008: -6.3pp · 2024: -46.7pp
- All cycles
- 2024: R+46.7 2020: R+44.6 2016: R+42.7 2012: R+23.1 2008: R+6.3
Not yet ingested
- Civics
- —
Market trends
- HPI YoY
- ▲ 3.73%
- Current HPI
- 152.9706
- Rent YoY
- —
- Metro
- —
- State GDP YoY
- ▲ 1.59%
- F500 in state
- 60
Industry mix (Fortune 500 HQ in IL)
| Industry | F500 HQs | Revenue |
|---|---|---|
| Insurance | 4 | $201B |
|
||
| Consumer Goods | 4 | $87B |
|
||
| Industrial Machinery | 3 | $64B |
|
||
| Healthcare | 2 | $55B |
|
||
| Retail / Pharmacy | 1 | $148B |
|
||
| Agriculture / Food | 1 | $86B |
|
||
Price history
+79.5% since first listed5 events — show timeline
- 2026-06-04 Listed $105,000 ForSaleByOwner.com
- 2021-08-06 Listing Removed — RMLSA as Distributed by MLS Grid
- 2012-10-31 Sold (Public Records) $54,000 Public Records
- 2012-10-30 Sold (MLS) $54,000 RMLSA as Distributed by MLS Grid
- 2012-08-18 Listed $58,500 RMLSA as Distributed by MLS Grid
Property tax history
-0.3%/yrLatest (2024): $898 · -5.0% YoY. Source: county tax records.
Cash-flow waterfall
monthlySold comps — $/sqft
last 12 mo · ≤1 miLoading sold comps…