 Multi-family
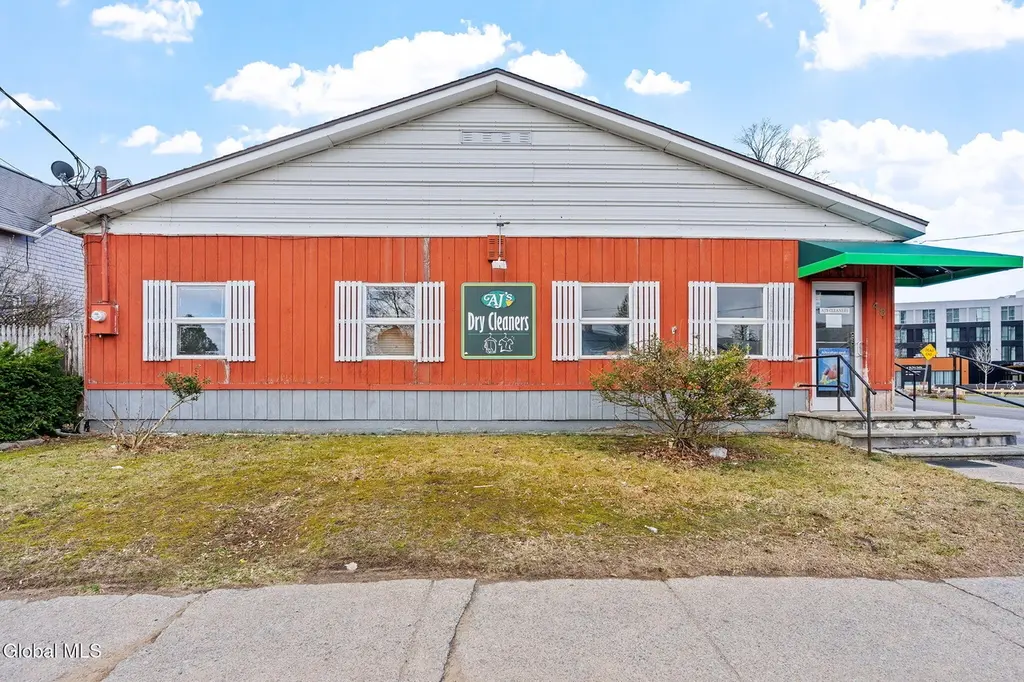
48 Lincoln Ave · Saratoga Springs, NY
Flood risk No data
- FEMA flood zone
- —
- Chance of flooding over 30 yrs
- —
- Est. flood insurance / yr
- —
Fire risk No data
- Est. fire insurance / yr
- —
Heat risk No data
- Hot days now (above threshold)
- —
- Hot days in 30 yrs
- —
Wind risk No data
- Chance of severe wind over 30 yrs
- —
Air-quality risk No data
- Unhealthy air days now
- —
- Unhealthy air days in 30 yrs
- —
Risk factors via First Street. Map © Google.
Why this score? — see what drove the A- grade
The composite is a weighted blend of 9 inputs, each scored 0–100. Each bar is that input's sub-score; the figure is the points it added to the 100-point composite (weight × sub-score).
- Cash flow +30.0/30.0
- ARV discount +15.0/15.0
- 1% rule +10.0/10.0
- DSCR +10.0/10.0
- Schools +6.1/10.0
- Rent growth +4.8/5.0
- Livability +4.1/5.0
- Condition / age +2.0/5.0
- Appreciation +0.0/10.0
$780,000
🖨 Deal sheet (PDF) 📄 Offer letter ✓ Due diligence
Multi-family units
County records classify this as Multi-Family (2-4 Unit). Listing-text estimate: 1 unit. estimate disagrees with records
Listing remarks MLS
As a mixed-use property you have many options here to build not just a commercial business but you may also build residential here! Permitted uses in the NC T5 zoning for this property are for a Townhouse, a Single Family Home, a Two-Family Home or if you choose to build your business on the ground floor you will also be permitted per zoning to build a residence above the business.
Key facts
- Build residential
- Mixed-use property
- Nc t5 zoning
Tags
Neighborhood map
What this means for you Summary
Snapshot
- This is a ?-bed/1.5-bath multifamily listed at $780k. Condition is rated fair.
Deal economics
- At list price, monthly cash flow is $11k ($128k/yr) — positive.
- The deal already cash-flows at list — no discount required.
- Meets the 1% rule at list price ($20k rent vs $780k).
- Recommended offer: $733k (6.0% below list) — sets the bar for market timing.
- Cap rate 22.7% vs local median 2.0% in Saratoga Springs — top-decile yield for the area; either an underpriced asset or a hidden risk that comps aren't pricing in. Stress-test before assuming the spread holds.
Location & tenants
- Location reads 82/100 on livability (#83 in NY, #1,284 nationally) — a professional / high-income tenant draw. Strengths: employment A+, housing A+, health & safety A; Watch: amenities D+, cost of living F.
- Saratoga Springs City SD (suburban): math 67% / reading 72% proficiency, ranked #138 of 590 in NY (top 23%) — acceptable for families but not a draw, mixed tenant base, ~2y average lease; only 15% free/reduced lunch — higher-income household profile.
- Zoned schools: Lake Avenue Elementary School (math 82% / reading 82%, grade A+, #138 of 2,108 statewide, top 8%, 393 students, 21% FRL); Maple Avenue Middle School (math 46% / reading 69%, grade B, #187 of 729 statewide, top 26%, 1,392 students, 27% FRL); Saratoga Springs High School (math 98% / reading 92%, grade A+, #83 of 1,100 statewide, top 8%, 1,947 students, 26% FRL).
- Market conditions: Rents rising fast (+9.2%/yr); 474 active listings in the ZIP; 13 comparable units currently listed for rent nearby; rentals lingering (median 46d on market — plan ~5-8 weeks vacancy on turnover, expect pricing pressure); 62% of comp listings sitting > 30 days — soft ceiling on asking rent; solid renter incomes; 1,132 units permitted in Saratoga County in 2024 (378 in 5+ unit buildings).
- At $20,282/mo this rent would consume 239% of the median local household income ($102k/yr) (locally 1424% of renters already pay >50% of income on rent) — very limited rent-growth headroom before tenants either downsize or default.
Forward outlook
- Local home prices are declining (-3.0%/yr); year-one equity from $5k of loan paydown is wiped out by about $23k of value loss. Plan a longer hold.
- Saratoga County population projected at +4% by 2050 — modest demand growth; plan on rents tracking national, not racing it.
- At projected returns (-3.0% appreciation + 8.0% rent growth), your $218k cash investment doubles in ~2 years — after that, you're playing with house money.
Negotiation context
- It's been on market 80 days — a 6% lower offer ($733k) is reasonable based on typical stale-listing flexibility.
Questions for the listing agent
- It's been on market 80 days. Have you received any prior offers? Is the seller open to a 6% concession, seller financing, or rate buy-down credit?
- Have any recent inspections been done? Can we get a copy of the seller's disclosures and any deferred-maintenance estimates?
- Built in 1960 — when were the roof, HVAC, electrical panel, plumbing, and water heater last replaced?
- Why hasn't it sold? Are there any deal-killer items the seller is aware of (foundation, flood, title, zoning, code violations)?
- Is there a deadline driving the sale (1031 exchange, divorce, estate, relocation)? That informs how much negotiation room exists.
- Schools are A-rated — typically a magnet for longer-tenancy family renters. What's the average tenant stay here, and is there a school-zone premium baked into asking?
- What's the average days-on-market for RENTAL listings here right now (not sales)? A rising rental-DOM trend means longer vacancies and softer asking-rent achievability than the comps imply.
- What's the recent tenant-quality profile in this submarket — average credit score on applications, eviction rate, late-payment / NSF rate, and stable-employment percentage? A property-management company in the area should have these aggregated.
- How much new apartment / multifamily construction is in the pipeline within 1–3 miles? Heavy new supply (>2% of stock underway) typically softens rents 12–24 months out; light construction supports rent growth.
Investment metrics
- 1% rule
- 2.60% ✓
- Cap rate
- 22.65%
- Cash-on-cash
- 58.42%
- DSCR
- 3.60
- GRM
- 3.2
CMA / ARV
- ARV (median comp)
- $1,192,889
- List price
- $780,000
- Delta
- -34.61%
- Verdict
- UNDERPRICED
- Comps
- 20 within 1.0 mi
Show comp detail 5 sales within ~0.75 mi
| Address | Dist | Beds/Ba | Sqft | Sold | Price | $/sf | Match |
|---|---|---|---|---|---|---|---|
| 77 White St | 0.42mi | 4/2.0 | 2,088 (-3%) | 19mo | $780,000 | $374 | 58 |
| 59 Union St | 0.24mi | 4/2.0 | 1,984 (-8%) | 20mo | $465,000 | $234 | 56 |
| 8 Aletta St | 0.31mi | 3/2.0 | 1,928 (-11%) | 18mo | $375,000 | $195 | 51 |
| 58 Woodlawn Ave Ave | 0.74mi | 2/4.0 | 2,047 (-5%) | 7mo | $550,000 | $269 | 41 |
| 191 Elm St | 0.51mi | 4/2.0 | 1,857 (-14%) | 12mo | $550,000 | $296 | 41 |
Match score weights: distance 35% · size 25% · config 20% · recency 20%. Top-matched comps best support the ARV.
Projected returns pro-forma
-3.0% appreciation · 8.0% rent growth · sell at horizon
- IRR
- 62.6%
- Equity multiple
- 4.01×
- Total profit
- $658,302
- Equity at exit
- $116,301
- IRR
- 68.8%
- Equity multiple
- 9.86×
- Total profit
- $1,934,342
- Equity at exit
- $67,440
Cash invested: $218,400 (down + closing). Projections, not guarantees.
Landlord ↔ Tenant lean methodology
- Overall (STATE)
- 15 Strongly Tenant-Friendly
- State New York
- 15 Strongly Tenant-Friendly · D+10
- County
- — inherits STATE
- City
- — inherits STATE
ZIP-level market 12866
- Home prices YoY
- -31.8%
- Rents YoY
- 9.2%
- Active inventory
- 474
- Price-to-rent
- 3.2×
Monthly cashflow live
- Estimated rent
- $20,282 high interval (Pro) →
- Mortgage (P&I)
- −$4,090
- Tax est. 1.5%
- −$975 /mo · $11,700/yr
- Insurance
- −$325
- HOA
- −$0
- Vacancy / Maint / Mgmt
- −$4,259
- Net cashflow
- $10,633
Break-even live
Sensitivity live
| Price | -10% $11,172 | -5% $10,902 | +0% $10,633 | +5% $10,363 | +10% $10,094 |
|---|---|---|---|---|---|
| Rent | -10% $9,030 | -5% $9,832 | +0% $10,633 | +5% $11,434 | +10% $12,235 |
| Rate | -1.0pp $11,025 | -0.5pp $10,831 | base $10,633 | +0.5pp $10,431 | +1.0pp $10,225 |
UW: 25.0% down · 7.5% · 30yr · 1.5% tax · 5.0% vac · 8.0% maint · 8.0% mgmt
Financing live
Cash to close
- Down payment
- $195,000
- Closing costs
- $23,400
- Reserves months
- —
- Total cash needed
- —
Loan-product check · same deal, 3 products live
Conventional
25% down · 7.5% · 30yr
- Down + closing
- —
- Monthly P&I
- —
- Monthly cashflow
- —
- DSCR
- —
- Eligible?
- —
Personal DTI + credit; lowest rate.
DSCR
20% down · 8.5% · 30yr
- Down + closing
- —
- Monthly P&I
- —
- Monthly cashflow
- —
- DSCR
- —
- Eligible?
- —
No personal income docs; deal must DSCR.
Hard money
10% down · 12.0% · 12mo
- Down + closing
- —
- Monthly P&I
- —
- Monthly cashflow
- —
- DSCR
- —
- Eligible?
- —
Short-term bridge; refi at stabilization.
Rent comps 13 comps
| Address | Beds | Baths | Sqft | Rent | $/sqft | DOM | Units | Dist |
|---|---|---|---|---|---|---|---|---|
| 21 Park Pl Saratoga Springs, NY | 3.0 | 3.0 | 2500 | $3,250 | $1.30 | 45d | 1 | 0.27mi |
| 8 Furlong St Saratoga Springs, NY | 3.0 | 2.5 | 2242 | $1,000 | $0.45 | 45d | 1 | 0.42mi |
| 37 Henry St Saratoga Springs, NY | 2.0 | 2.0 | 1890 | $22,000 | $11.64 | 45d | 1 | 0.52mi |
| 34 Hyde St Saratoga Springs, NY | 3.0 | 2.5 | 2283 | $45,000 | $19.71 | 45d | 1 | 0.59mi |
| 2 Madison Ave Saratoga Springs, NY | 2.0 | 1.0 | 2309 | $20,000 | $8.66 | 22d | 1 | 0.66mi |
| 38 High Rock Ave Saratoga Springs, NY | 2.0 | 2.5 | 1589 | $25,000 | $15.73 | 45d | 1 | 0.80mi |
| 5 Maria Ln Saratoga Springs, NY | 3.0 | 3.5 | 1968 | $45,000 | $22.87 | 45d | 1 | 0.81mi |
| 156 Circular St Unit 3 Saratoga Springs, NY | 2.0 | 2.0 | 1600 | $3,250 | $2.03 | 25d | 1 | 0.83mi |
| 106 Van Dam St Saratoga Springs, NY | 2.0 | 2.5 | 1612 | $18,000 | $11.17 | 20d | 1 | 0.86mi |
| 11 Outlook Ave Saratoga Springs, NY | 3.0 | 2.5 | 1706 | $28,000 | $16.41 | 25d | 1 | 0.90mi |
| 5 Alger St Saratoga Springs, NY | 3.0 | 1.5 | 1540 | $2,750 | $1.79 | 45d | 1 | 0.96mi |
| 18 Granite St Saratoga Springs, NY | 3.0 | 3.5 | 2915 | $40,000 | $13.72 | 22d | 1 | 1.02mi |
| 164 High Rock Ave Saratoga Springs, NY | 2.0 | 3.5 | 2723 | $25,000 | $9.18 | 45d | 1 | 1.15mi |
Listing history 20 events
-
2026-06-21days on market $780,000 Active 80 DOM
-
2026-06-18days on market $780,000 Active 77 DOM
-
2026-06-17days on market $780,000 Active 76 DOM
-
2026-06-16days on market $780,000 Active 75 DOM
-
2026-06-15days on market $780,000 Active 74 DOM
-
2026-06-14days on market $780,000 Active 72 DOM
-
2026-06-13days on market $780,000 Active 71 DOM
-
2026-06-10days on market $780,000 Active 69 DOM
-
2026-06-09days on market $780,000 Active 68 DOM
-
2026-06-08days on market $780,000 Active 67 DOM
-
2026-06-07days on market $780,000 Active 66 DOM
-
2026-06-05days on market $780,000 Active 63 DOM
-
2026-06-03days on market $780,000 Active 62 DOM
-
2026-06-02days on market $780,000 Active 61 DOM
-
2026-06-01days on market $780,000 Active 60 DOM
-
2026-05-31days on market $780,000 Active 59 DOM
-
2026-05-31days on market $780,000 Active 58 DOM
-
2026-05-18price $780,000 384-char remark
Show marketing remark (384 chars)
As a mixed-use property you have many options here to build not just a commercial business but you may also build residential here! Permitted uses in the NC T5 zoning for this property are for a Townhouse, a Single Family Home, a Two-Family Home or if you choose to build your business on the ground floor you will also be permitted per zoning to build a residence above the business.
-
2026-04-27price $820,000 384-char remark
Show marketing remark (384 chars)
As a mixed-use property you have many options here to build not just a commercial business but you may also build residential here! Permitted uses in the NC T5 zoning for this property are for a Townhouse, a Single Family Home, a Two-Family Home or if you choose to build your business on the ground floor you will also be permitted per zoning to build a residence above the business.
-
2026-04-02$850,000 Active 384-char remark
Show marketing remark (384 chars)
As a mixed-use property you have many options here to build not just a commercial business but you may also build residential here! Permitted uses in the NC T5 zoning for this property are for a Townhouse, a Single Family Home, a Two-Family Home or if you choose to build your business on the ground floor you will also be permitted per zoning to build a residence above the business.
ⓘ Source: listings_history table (triggers on properties + properties_extension) + one-shot
backfill from property_details.listing_events for pre-trigger history.
Nearby sold comps map
Loading sold comps map…
Walkable amenities ~0.75 mi
Loading nearby amenities…
Taxation est. · year 1
- Rental income
- $243,389
- − Mortgage interest
- −$43,692
- − Property taxes
- −$11,700
- − Insurance
- −$3,900
- − Repairs & maintenance
- −$19,471
- − Management
- −$19,471
- − Depreciation
- −$22,691
- Taxable income
- $122,464
- Est. tax owed @ 24.0%
- −$29,391
- After-tax cash flow
- $98,201/yr
For passive investors: Depreciation is non-cash, so a rental often shows a tax loss while cash-flowing — sheltering income. Rental losses are passive: they offset passive income freely, and up to $25,000/yr can offset ordinary (W-2) income if you actively participate and your MAGI is under $100k (phasing out to $0 by $150k); unused losses carry forward. On sale, claimed depreciation is recaptured at up to 25%, and gains may owe capital-gains tax (a 1031 exchange can defer both). Figures are a year-1 estimate at your 24.0% rate — not tax advice; consult a CPA.
Condition & rehab AI · 12 photos
This property requires extensive renovations to improve its condition and increase its value. Significant repairs and maintenance are needed to address the poor exterior, roof, flooring, interior walls, and systems.
Repairs flagged
- Major siding — Severe weathering
- Major roof — Significant wear
- Major flooring — Concrete in poor condition
- Major interior walls — Exposed subflooring
- Major systems — Exposed wiring and plumbing
Value-add opportunities
- Both exterior renovation — Improves curb appeal and value
- Both roof replacement — Essential for structural integrity and value
- Both flooring replacement — Enhances usability and aesthetics
- Both interior wall repair — Restores structural integrity and enhances value
- Both system upgrades — Ensures functionality and safety
Renovation cost estimate screening
| Repair item | Severity | Est. cost |
|---|---|---|
| siding · Severe weathering | Major | $15,000–50,000 |
| roof · Significant wear | Major | $15,000–50,000 |
| flooring · Concrete in poor condition | Major | $15,000–50,000 |
| interior walls · Exposed subflooring | Major | $15,000–50,000 |
| systems · Exposed wiring and plumbing | Major | $15,000–50,000 |
| Total estimated repair cost · 5 items | $75,000–250,000 |
Value-add ROI direction
- Both exterior renovation — Improves curb appeal and value ↑
- Both roof replacement — Essential for structural integrity and value ↑
- Both flooring replacement — Enhances usability and aesthetics ↑
- Both interior wall repair — Restores structural integrity and enhances value ↑
- Both system upgrades — Ensures functionality and safety ↑
ⓘ Cost ranges are severity-bucket heuristics (US national rule-of-thumb). Get contractor quotes + a written scope before underwriting a rehab budget.
Schools (NCES district)
- District
- Saratoga Springs City SD
- NCES district ID
- 3625770
- Math proficiency
- 67% ▼ -10.00%
- Reading proficiency
- 72% ▲ 6.00%
- Median HH income
- $69,864
- Composite
- 60.83/100
- National rank
- #818
- State rank
- #138 of 590 in NY
Livability — Saratoga Springs
- Score
- 82/100
- State rank
- #83
- US rank
- #1284
Category grades
Schools grade is shown separately in the Schools card above.
Census & demographics
- Census place
- Saratoga Springs, NY
- County
- Saratoga County · 166,192 people
- City population
- 40,057
- Metro
- Albany-Schenectady-Troy, NY
- Population (ZIP)
- 40,057
- Household income
- $101,901
- Rent vs Own
- Severe rent burden
- 1424.0
Population outlook (Saratoga County) Hauer SSP2
- Today (2025)
- 238,889 people
- By 2030
- 243,681 · +2.0%
- By 2040
- 249,118 · +4.3%
- By 2050
- 248,638 · +4.1%
- By 2075
- 241,675 · +1.2%
- By 2100
- 213,150 · -10.8%
Race, ethnicity, and origin ACS 2023
- Neighborhood character
- Predominantly White (87%)
- Race & ethnicity
- White 87% Two or more races 5% Hispanic / Latino 4% Asian 2% Black 2%
- Common ancestry
- Romanian 6% Lithuanian 5% Slovak 2%
- Foreign-born
- 6% · Canada, South Korea, China
- Languages at home
- 92% English-only · Spanish 2% German/W. Germanic 1% Korean 1%
Political lean MEDSL · Saratoga
- 2024 margin
- Toss-up / Even · D 50.9% · R 49.1%
- 2008→2024 swing
- -1.6pp toward R · 2008: 3.4pp · 2024: 1.8pp
- All cycles
- 2024: D+1.8 2020: D+5.4 2016: R+4.4 2012: D+2.1 2008: D+3.4
Not yet ingested
- Civics
- —
Market trends
- HPI YoY
- ▼ -178.78%
- Current HPI
- 382.7429
- Rent YoY
- ▲ 9.15%
- Metro
- Albany-Schenectady-Troy, NY
- State GDP YoY
- ▲ 2.60%
- F500 in state
- 92
Industry mix (Fortune 500 HQ in NY)
| Industry | F500 HQs | Revenue |
|---|---|---|
| Financial Services | 10 | $950B |
|
||
| Consumer Goods | 9 | $162B |
|
||
| Insurance | 4 | $225B |
|
||
| Telecommunications | 2 | $144B |
|
||
| Pharmaceuticals | 2 | $112B |
|
||
| Media / Entertainment | 2 | $69B |
|
||
Price history
-8.2% since first listed3 events — show timeline
- 2026-05-18 Price Changed $780,000 Global MLS
- 2026-04-27 Price Changed $820,000 Global MLS
- 2026-04-02 Listed $850,000 Global MLS
Cash-flow waterfall
monthlySold comps — $/sqft
last 12 mo · ≤1 miLoading sold comps…