 Multi-family
639 1/2 Park Ave #2 · Dunkirk, NY
Flood risk 1/10 · Minimal
- FEMA flood zone
- X
- Chance of flooding over 30 yrs
- 0.0%
- Est. flood insurance / yr
- $473 – $860
Fire risk 1/10 · Minimal
- Est. fire insurance / yr
- $691 – $1,283
Heat risk 2/10 · Minimal
- Hot days now (above 94°F)
- 7 days/yr
- Hot days in 30 yrs
- 16 days/yr
Wind risk 1/10 · Minimal
- Chance of severe wind over 30 yrs
- —
Air-quality risk 2/10 · Minimal
- Unhealthy air days now
- 2 days/yr
- Unhealthy air days in 30 yrs
- 2 days/yr
Risk factors via First Street. Map © Google.
Why this score? — see what drove the C grade
The composite is a weighted blend of 9 inputs, each scored 0–100. Each bar is that input's sub-score; the figure is the points it added to the 100-point composite (weight × sub-score).
- Cash flow +15.6/30.0
- ARV discount +15.0/15.0
- Appreciation +7.5/10.0
- DSCR +4.8/10.0
- 1% rule +4.3/10.0
- Livability +3.5/5.0
- Schools +2.7/10.0
- Rent growth +2.5/5.0
- Condition / age +2.2/5.0
$129,900
🖨 Deal sheet 📄 Offer letter ✓ Due diligence
Multi-family units
County records classify this as Multi-Family (2-4 Unit). Listing-text estimate: 1 unit. estimate disagrees with records
Key facts
- 2,824 sq ft lot
- 2 garage spots
- Built 1898
Neighborhood map
What this means for you Summary
Snapshot
- This is a 6-bed/3.0-bath multifamily listed at $130k. Condition is rated fair.
Deal economics
- At list price, monthly cash flow is $54 ($651/yr) — positive.
- The deal already cash-flows at list — no discount required.
- To meet the 1% rule (rent ≥ 1% of price), the offer needs to be $120k (7.2% below list).
- Recommended offer: $120k (7.2% below list) — sets the bar for 1% rule.
Location & tenants
- Location reads 70/100 on livability (#426 in NY) — a middle-class / working-renter tenant base. Strengths: cost of living A+, housing A+, health & safety A+; Watch: schools C-, amenities F, commute F.
- Dunkirk City School District (town): math 30% / reading 34% proficiency, ranked #575 of 590 in NY (top 98%) — families likely to look elsewhere, expect single-tenant / working-renter base with shorter leases; 65% free/reduced lunch — lower-income household profile, screen leases tightly.
- Market conditions: 70 active listings in the ZIP; 127 units permitted in Chautauqua County in 2024 (0 in 5+ unit buildings).
Forward outlook
- In year one you build about $7k of equity ($898 loan paydown + $6k appreciation (4.9% local appreciation)).
- Chautauqua County population projected at -22% by 2050 — secular population decline; favor cash flow + early exit over multi-decade hold.
- At projected returns (4.9% appreciation + 3.0% rent growth), your $36k cash investment doubles in ~5 years — after that, you're playing with house money.
- By year 5, paydown + projected appreciation supports a ~$32k cash-out refi (75% LTV) — recoverable capital for the next deal without selling this one.
Negotiation context
- It's been on market 29 days — a 2% lower offer ($128k) is reasonable based on typical stale-listing flexibility.
- 2 sale attempts with the ask held roughly flat each time — persistent listings suggest the price (not the market) is what's stuck; bring a comps-based counter.
Risks & watch-outs
- Watch-outs: built in 1898 — expect roof / HVAC / electrical / plumbing capex.
Questions for the listing agent
- Have any recent inspections been done? Can we get a copy of the seller's disclosures and any deferred-maintenance estimates?
- Built in 1898 — when were the roof, HVAC, electrical panel, plumbing, and water heater last replaced?
- Is there a deadline driving the sale (1031 exchange, divorce, estate, relocation)? That informs how much negotiation room exists.
- What's the average days-on-market for RENTAL listings here right now (not sales)? A rising rental-DOM trend means longer vacancies and softer asking-rent achievability than the comps imply.
- What's the recent tenant-quality profile in this submarket — average credit score on applications, eviction rate, late-payment / NSF rate, and stable-employment percentage? A property-management company in the area should have these aggregated.
- How much new apartment / multifamily construction is in the pipeline within 1–3 miles? Heavy new supply (>2% of stock underway) typically softens rents 12–24 months out; light construction supports rent growth.
Investment metrics
- 1% rule
- 0.93% ✗
- Cap rate
- 6.79%
- Cash-on-cash
- 1.79%
- DSCR
- 1.08
- GRM
- 9.0
CMA / ARV
- ARV (median comp)
- $172,776
- List price
- $129,900
- Delta
- -24.82%
- Verdict
- UNDERPRICED
- Comps
- 20 within 1.0 mi
Show comp detail 1 sale within ~0.75 mi
| Address | Dist | Beds/Ba | Sqft | Sold | Price | $/sf | Match |
|---|---|---|---|---|---|---|---|
| 409 Eagle St | 0.40mi | 5/2.5 (-1) | 2,645 (-8%) | 1mo | $196,000 | $74 | 61 |
Match score weights: distance 35% · size 25% · config 20% · recency 20%. Top-matched comps best support the ARV.
Projected returns pro-forma
4.93% appreciation · 3.0% rent growth · sell at horizon
- IRR
- 14.2%
- Equity multiple
- 1.90×
- Total profit
- $32,898
- Equity at exit
- $73,067
- IRR
- 15.0%
- Equity multiple
- 3.66×
- Total profit
- $96,771
- Equity at exit
- $125,655
Cash invested: $36,372 (down + closing). Projections, not guarantees.
Landlord ↔ Tenant lean methodology
- Overall (STATE)
- 15 Strongly Tenant-Friendly
- State New York
- 15 Strongly Tenant-Friendly · D+10
- County
- — inherits STATE
- City
- — inherits STATE
ZIP-level market 14048
- Home prices YoY
- 1.5%
- Active inventory
- 70
- Price-to-rent
- 9.0×
Monthly cashflow live
- Estimated rent
- $1,205 medium interval (Pro) →
- Mortgage (P&I)
- −$681
- Tax est. 1.5%
- −$162 /mo · $1,948/yr
- Insurance
- −$54
- HOA
- −$0
- Vacancy / Maint / Mgmt
- −$253
- Net cashflow
- $54
Break-even live
UW: 25.0% down · 7.5% · 30yr · 1.5% tax · 5.0% vac · 8.0% maint · 8.0% mgmt
Financing live
Cash to close
- Down payment
- $32,475
- Closing costs
- $3,897
- Reserves months
- —
- Total cash needed
- —
Loan-product check · same deal, 3 products live
Conventional
25% down · 7.5% · 30yr
- Down + closing
- —
- Monthly P&I
- —
- Monthly cashflow
- —
- DSCR
- —
- Eligible?
- —
Personal DTI + credit; lowest rate.
DSCR
20% down · 8.5% · 30yr
- Down + closing
- —
- Monthly P&I
- —
- Monthly cashflow
- —
- DSCR
- —
- Eligible?
- —
No personal income docs; deal must DSCR.
Hard money
10% down · 12.0% · 12mo
- Down + closing
- —
- Monthly P&I
- —
- Monthly cashflow
- —
- DSCR
- —
- Eligible?
- —
Short-term bridge; refi at stabilization.
Listing history 3 events
-
2026-05-06status Pending
-
2026-04-07$129,900 Active
-
2025-11-30$129,900 Active
ⓘ Source: listings_history table (triggers on properties + properties_extension) + one-shot
backfill from property_details.listing_events for pre-trigger history.
Climate risk First Street
- Flood 1/10 Low FEMA zone X · 0% chance over 30 yrs
- Wildfire 1/10 Low
- Heat 2/10 Low 7 d/yr ≥94°F today · 16 d/yr by 30 yrs out
- Wind 1/10 Low
- Air quality 2/10 Low 2 unhealthy d/yr today · 2 by 30 yrs out
Nearby sold comps map
Loading sold comps map…
Walkable amenities ~0.75 mi
Loading nearby amenities…
Taxation est. · year 1
- Rental income
- $14,460
- − Mortgage interest
- −$7,276
- − Property taxes
- −$1,948
- − Insurance
- −$650
- − Repairs & maintenance
- −$1,157
- − Management
- −$1,157
- − Depreciation
- −$3,779
- Taxable loss
- −$1,507
- Est. tax savings @ 24.0%
- +$362
- After-tax cash flow
- $1,012/yr
For passive investors: Depreciation is non-cash, so a rental often shows a tax loss while cash-flowing — sheltering income. Rental losses are passive: they offset passive income freely, and up to $25,000/yr can offset ordinary (W-2) income if you actively participate and your MAGI is under $100k (phasing out to $0 by $150k); unused losses carry forward. On sale, claimed depreciation is recaptured at up to 25%, and gains may owe capital-gains tax (a 1031 exchange can defer both). Figures are a year-1 estimate at your 24.0% rate — not tax advice; consult a CPA.
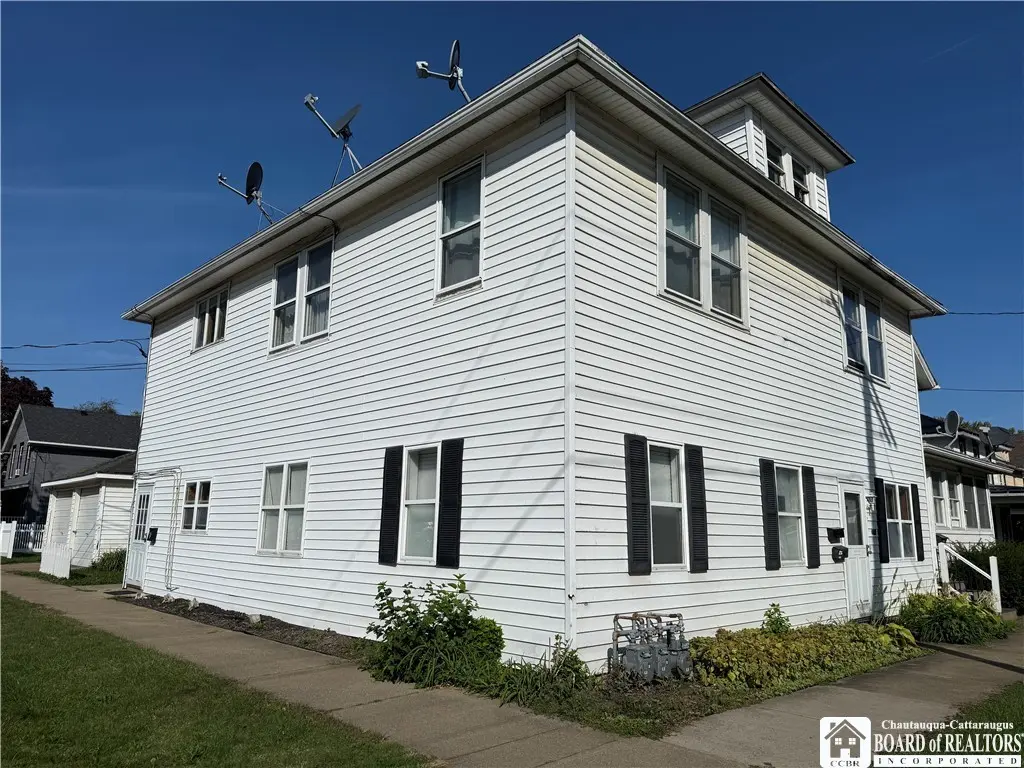
Condition & rehab AI · 1 photo
A moderate rehab is needed to address exterior siding and landscaping, which can significantly boost its resale and rental value.
Repairs flagged
- Major Exterior siding — Significant weathering
- Minor Landscaping — Overgrown vegetation
Value-add opportunities
- Both Paint exterior — Enhances curb appeal and value
- Both Landscaping — Improves curb appeal and rental appeal
Renovation cost estimate screening
| Repair item | Severity | Est. cost |
|---|---|---|
| Exterior siding · Significant weathering | Major | $15,000–50,000 |
| Landscaping · Overgrown vegetation | Minor | $500–3,000 |
| Total estimated repair cost · 2 items | $15,500–53,000 |
Value-add ROI direction
- Both Paint exterior — Enhances curb appeal and value ↑
- Both Landscaping — Improves curb appeal and rental appeal ↑
ⓘ Cost ranges are severity-bucket heuristics (US national rule-of-thumb). Get contractor quotes + a written scope before underwriting a rehab budget.
Schools (NCES district)
- District
- Dunkirk City School District
- NCES district ID
- 3609420
- Math proficiency
- 30% ▼ -11.00%
- Reading proficiency
- 34% ▬ 0.00%
- Median HH income
- $36,345
- Composite
- 26.55/100
- National rank
- #7190
- State rank
- #575 of 590 in NY
Livability — Dunkirk
- Score
- 70/100
- State rank
- #426
- US rank
- #7421
Category grades
Schools grade is shown separately in the Schools card above.
Census & demographics
- Census place
- Dunkirk, NY
- City population
- 14,949
- Population (ZIP)
- 14,949
Population outlook (Chautauqua County) Hauer SSP2
- Today (2025)
- 123,454 people
- By 2030
- 118,509 · -4.0%
- By 2040
- 107,311 · -13.1%
- By 2050
- 96,703 · -21.7%
- By 2075
- 76,757 · -37.8%
- By 2100
- 60,984 · -50.6%
Race, ethnicity, and origin ACS 2023
- Neighborhood character
- Majority White (63%)
- Race & ethnicity
- White 63% Hispanic / Latino 30% Two or more races 12% Black 3%
- Hispanic origin (detail)
- Mexican 2% Puerto Rican 25% Dominican 1%
- Common ancestry
- Romanian 20% Lithuanian 3% Iranian 1%
- Foreign-born
- 3% · Canada
- Languages at home
- 80% English-only · Spanish 18% Other Indo-European 1%
Political lean MEDSL · Chautauqua
- 2024 margin
- Strong R (+22.0) · D 39.0% · R 61.0%
- 2008→2024 swing
- -22.9pp toward R · 2008: 0.9pp · 2024: -22.0pp
- All cycles
- 2024: R+22.0 2020: R+19.8 2016: R+24.6 2012: R+8.2 2008: D+0.9
Not yet ingested
- Civics
- —
Market trends
- HPI YoY
- ▲ 4.93%
- Current HPI
- 325.9188
- Rent YoY
- —
- Metro
- —
- State GDP YoY
- ▲ 2.60%
- F500 in state
- 92
Industry mix (Fortune 500 HQ in NY)
| Industry | F500 HQs | Revenue |
|---|---|---|
| Financial Services | 10 | $950B |
|
||
| Consumer Goods | 9 | $162B |
|
||
| Insurance | 4 | $225B |
|
||
| Telecommunications | 2 | $144B |
|
||
| Pharmaceuticals | 2 | $112B |
|
||
| Media / Entertainment | 2 | $69B |
|
||
Price history
+0.0% since first listed3 events — show timeline
- 2026-05-06 Pending — UNYREIS
- 2026-04-07 Listed $129,900 UNYREIS
- 2025-11-30 Listed $129,900 UNYREIS
Cash-flow waterfall
monthlySold comps — $/sqft
last 12 mo · ≤1 miLoading sold comps…