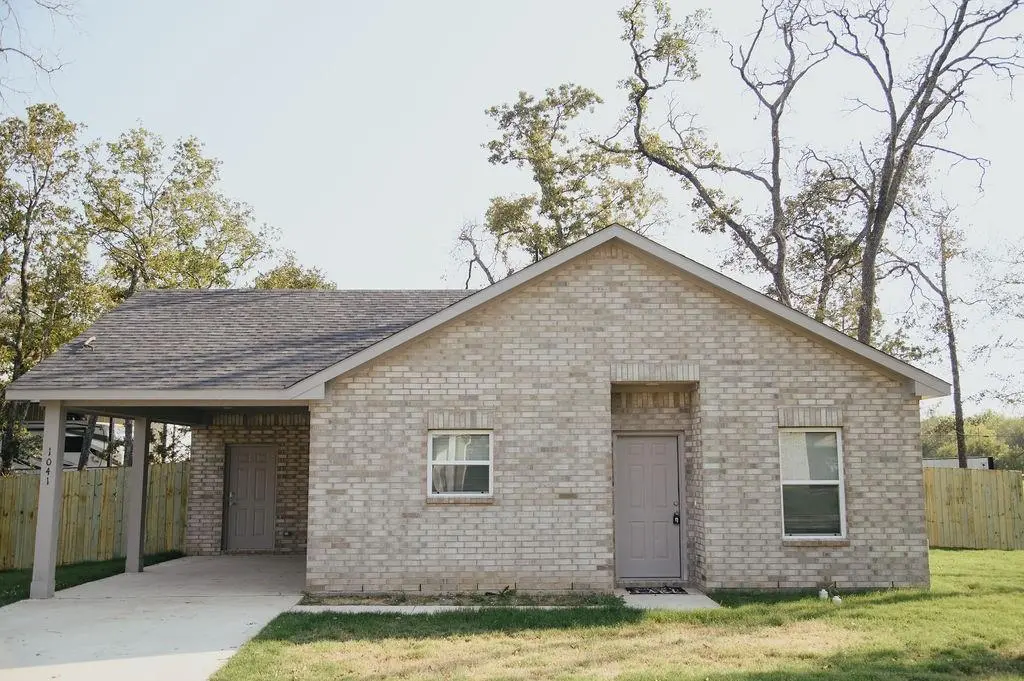
1041 Hillburn Dr · West Tawakoni, TX
Flood risk 1/10 · Minimal
- FEMA flood zone
- X (unshaded)
- Chance of flooding over 30 yrs
- 0.0%
- Est. flood insurance / yr
- $507 – $1,088
Fire risk 3/10 · Minor
- Est. fire insurance / yr
- $1,222 – $2,270
Heat risk 7/10 · Major
- Hot days now (above 110°F)
- 7 days/yr
- Hot days in 30 yrs
- 24 days/yr
Wind risk 6/10 · Moderate
- Chance of severe wind over 30 yrs
- 27.0%
Air-quality risk 2/10 · Minimal
- Unhealthy air days now
- 0 days/yr
- Unhealthy air days in 30 yrs
- 1 days/yr
Risk factors via First Street. Map © Google.
Why this score? — see what drove the D+ grade
The composite is a weighted blend of 9 inputs, each scored 0–100. Each bar is that input's sub-score; the figure is the points it added to the 100-point composite (weight × sub-score).
- Cash flow +11.8/30.0
- Appreciation +10.0/10.0
- ARV discount +9.3/15.0
- 1% rule +3.7/10.0
- DSCR +3.5/10.0
- Livability +2.8/5.0
- Schools +2.6/10.0
- Rent growth +2.5/5.0
- Condition / age +2.5/5.0
$209,900
🖨 Deal sheet (PDF) 📄 Offer letter ✓ Due diligence
Listing remarks
PROPERTY COMES FULLY FURNISHED! Welcome home to 1041 Hillburn Drive, where the possibilities are endless and lake living awaits. Located in the desirable Indian Oaks community with access to a private neighborhood boat ramp, this charming 3 bedroom, 2 bathroom home offers a spacious open-concept floorplan designed for comfortable everyday living and entertaining. Luxury vinyl flooring flows throughout the main living areas, creating a modern and low-maintenance feel. The kitchen is beautifully appointed with granite countertops, stainless steel appliances, ample cabinetry, and a center island overlooking the living and dining spaces. The spacious laundry room includes a convenient mud bench
Key facts
- Granite countertops
- Center island
- Convenient mud bench
Tags
Property features AI
Finance
- Other: Subdivision: Indian Oaks Add; County: Hunt
- HOA & community: Mandatory HOA (Indian Oaks HOA); HOA fee $150 annually; HOA covers grounds maintenance
Exterior
- Parking: Carport (1 car)
- Utilities: All-weather road access; No municipal utility district
- Home design: Single-family residence; One story; Property is attached; Residential property
- Construction: Built in 2023; Preowned
- Exterior features: Wood fencing; Few trees; Interior lot; Boat ramp in community
Interior
- Kitchen: Dishwasher; Electric range; Breakfast bar; Water line to refrigerator
- Bedrooms: 3 bedrooms (all on main level); Primary bedroom with walk-in closet
- Flooring: Vinyl flooring
- Bathrooms: 2 full bathrooms
- Heating & cooling: Central heating (electric); Central air; Ceiling fan(s)
- Interior features: Open floorplan; Eat-in kitchen; Kitchen island; Decorative lighting; Cable TV available; Window coverings; One living area; One dining area; Total of 5 rooms
- Laundry & utility: Full-size washer/dryer area; Washer hookup; Electric dryer hookup; Utility room
Neighborhood map
What this means for you Summary
Snapshot
- This is a 3-bed/2.0-bath single-family listed at $210k.
Deal economics
- At list price, monthly cash flow is $-57 ($-686/yr) — negative.
- To cash-flow at today's rent, offer at most $200k (4.8% below list).
- To meet the 1% rule (rent ≥ 1% of price), the offer needs to be $182k (13.1% below list).
- Recommended offer: $182k (13.1% below list) — sets the bar for 1% rule.
- Cap rate 6.0% vs local median 4.6% in West Tawakoni — meaningfully above typical; check what's discounted (condition, days-on-market, listing class) to confirm the premium yield is real.
Location & tenants
- Location reads 56/100 on livability (#1,337 in TX) — a working-class tenant base; expect higher turnover. Strengths: cost of living A+, housing A+, crime A-; Watch: amenities F, commute F, employment F.
- Quinlan ISD (rural): math 27% / reading 34% proficiency, ranked #610 of 826 in TX (top 74%) — families likely to look elsewhere, expect single-tenant / working-renter base with shorter leases.
- Zoned schools: D C Cannon El (765 students, 81% FRL) — zoned schools average 81% FRL vs 60% district-wide (22 pts higher); higher-poverty schools than district average — tighter screening recommended.
- Market conditions: 335 active listings in the ZIP; 4 comparable units currently listed for rent nearby; rentals leasing fast (median 3d on market — plan ~1-2 weeks tenant-placement turnaround); 1,289 units permitted in Hunt County in 2024 (527 in 5+ unit buildings).
- This rent runs 34% of the median local income ($64k/yr) — at the standard rent-burdened threshold; future hikes will face affordability resistance.
Forward outlook
- In year one you build about $22k of equity ($1k loan paydown + $21k appreciation (10.0% local appreciation)).
- Hunt County population projected at +15% by 2050 — modest demand growth; plan on rents tracking national, not racing it.
- At projected returns (10.0% appreciation + 3.0% rent growth), your $59k cash investment doubles in ~3 years — after that, you're playing with house money.
- By year 2, paydown + projected appreciation supports a ~$36k cash-out refi (75% LTV) — recoverable capital for the next deal without selling this one.
Negotiation context
- It's been on market 35 days — a 3% lower offer ($204k) is reasonable based on typical stale-listing flexibility.
- 2 sale attempts since 3y ago with the ask held roughly flat each time — persistent listings suggest the price (not the market) is what's stuck; bring a comps-based counter.
Risks & watch-outs
- Climate carrying-cost: major wind risk, 27% chance of damaging wind over 30y; extreme-heat days projected 7→24/yr by 2055 (HVAC capex compounding) — expect insurance premiums to compound above CPI over the hold.
Questions for the listing agent
- What do current leases actually rent for vs. the listed asking? Can we see a recent rent roll and the last 12 months of T-12 income?
- It's been on market 35 days. Have you received any prior offers? Is the seller open to a 13% concession, seller financing, or rate buy-down credit?
- What does the HOA fee cover, when was the last increase, and are there any pending special assessments or reserve-fund shortfalls?
- Is there a deadline driving the sale (1031 exchange, divorce, estate, relocation)? That informs how much negotiation room exists.
- Schools are F-rated, which usually means shorter tenancies and higher turnover. Who's the typical renter profile here, and what's been the actual vacancy rate?
- The area grade is low — what's the realistic commute time and amenity access for the typical tenant pool here? Any planned neighborhood developments (good or bad) we should know about?
- What's the average days-on-market for RENTAL listings here right now (not sales)? A rising rental-DOM trend means longer vacancies and softer asking-rent achievability than the comps imply.
- What's the recent tenant-quality profile in this submarket — average credit score on applications, eviction rate, late-payment / NSF rate, and stable-employment percentage? A property-management company in the area should have these aggregated.
- How much new for-sale + rental construction is in the pipeline within 1–3 miles? Heavy new supply typically softens prices + rents 12–24 months out; constrained supply supports both.
Investment metrics
- 1% rule
- 0.87% ✗
- Cap rate
- 5.97%
- Cash-on-cash
- -1.17%
- DSCR
- 0.95
- GRM
- 9.6
CMA / ARV
- ARV (median comp)
- $218,746
- List price
- $209,900
- Delta
- -4.04%
- Verdict
- FAIR
- Comps
- 20 within 1.0 mi
Show comp detail 12 sales within ~0.75 mi
| Address | Dist | Beds/Ba | Sqft | Sold | Price | $/sf | Match |
|---|---|---|---|---|---|---|---|
| 1029 Crestline Dr | 0.07mi | 3/2.0 | 1,345 (+7%) | 3mo | $230,000 | $171 | 83 |
| 1005 Woodland Dr | 0.10mi | 3/2.0 | 1,258 (0%) | 15mo | $199,999 | $159 | 83 |
| 1037 Hillburn Dr | 0.01mi | 3/2.0 | 1,252 (-0%) | 20mo | $218,000 | $174 | 82 |
| 1025 Hillburn Dr | 0.05mi | 3/2.0 | 1,252 (-0%) | 20mo | $200,000 | $160 | 80 |
| 1009 Hillburn Dr | 0.10mi | 3/2.0 | 1,252 (-0%) | 21mo | $200,000 | $160 | 78 |
| 913 Hillburn Dr | 0.16mi | 3/3.0 | 1,350 (+7%) | 2mo | $245,000 | $181 | 75 |
| 109 Seagrove Ln | 0.15mi | 2/1.0 (-1) | 1,335 (+6%) | 8mo | $134,000 | $100 | 68 |
| 912 Oak Hill Dr | 0.19mi | 3/2.0 | 1,404 (+12%) | 7mo | $225,000 | $160 | 66 |
| 401 Shenandoah | 0.53mi | 3/2.0 | 1,322 (+5%) | 8mo | $209,999 | $159 | 60 |
| 425 Shenandoah | 0.55mi | 4/2.0 (+1) | 1,312 (+4%) | 14mo | $244,000 | $186 | 51 |
| 232 Doebecca Pkwy | 0.24mi | 2/1.0 (-1) | 1,120 (-11%) | 13mo | $250,000 | $223 | 51 |
| 408 Bella Vista Dr | 0.64mi | 2/2.0 (-1) | 1,394 (+11%) | 15mo | $395,000 | $283 | 35 |
Match score weights: distance 35% · size 25% · config 20% · recency 20%. Top-matched comps best support the ARV.
Projected returns pro-forma
10.0% appreciation · 3.0% rent growth · sell at horizon
- IRR
- 23.5%
- Equity multiple
- 2.88×
- Total profit
- $110,730
- Equity at exit
- $189,095
- IRR
- 20.9%
- Equity multiple
- 6.60×
- Total profit
- $329,059
- Equity at exit
- $407,790
Cash invested: $58,772 (down + closing). Projections, not guarantees.
Landlord ↔ Tenant lean methodology
- Overall (STATE)
- 87 Strongly Landlord-Friendly
- State Texas
- 87 Strongly Landlord-Friendly · R+5
- County
- — inherits STATE
- City
- — inherits STATE
ZIP-level market 75474
- Home prices YoY
- 7.5%
- Active inventory
- 335
- Price-to-rent
- 9.6×
Monthly cashflow live
- Estimated rent
- $1,823 medium interval (Pro) →
- Mortgage (P&I)
- −$1,101
- Tax from tax record
- −$296 /mo · $3,557/yr
- Insurance
- −$87
- HOA
- −$13
- Vacancy / Maint / Mgmt
- −$383
- Net cashflow
- $-57
Break-even live
Sensitivity live
| Price | -10% $62 | -5% $2 | +0% $-57 | +5% $-117 | +10% $-176 |
|---|---|---|---|---|---|
| Rent | -10% $-201 | -5% $-129 | +0% $-57 | +5% $15 | +10% $87 |
| Rate | -1.0pp $49 | -0.5pp $-4 | base $-57 | +0.5pp $-112 | +1.0pp $-167 |
UW: 25.0% down · 7.5% · 30yr · 1.5% tax · 5.0% vac · 8.0% maint · 8.0% mgmt
Financing live
Cash to close
- Down payment
- $52,475
- Closing costs
- $6,297
- Reserves months
- —
- Total cash needed
- —
Loan-product check · same deal, 3 products live
Conventional
25% down · 7.5% · 30yr
- Down + closing
- —
- Monthly P&I
- —
- Monthly cashflow
- —
- DSCR
- —
- Eligible?
- —
Personal DTI + credit; lowest rate.
DSCR
20% down · 8.5% · 30yr
- Down + closing
- —
- Monthly P&I
- —
- Monthly cashflow
- —
- DSCR
- —
- Eligible?
- —
No personal income docs; deal must DSCR.
Hard money
10% down · 12.0% · 12mo
- Down + closing
- —
- Monthly P&I
- —
- Monthly cashflow
- —
- DSCR
- —
- Eligible?
- —
Short-term bridge; refi at stabilization.
Rent comps 4 comps
| Address | Beds | Baths | Sqft | Rent | $/sqft | DOM | Units | Dist |
|---|---|---|---|---|---|---|---|---|
| 820 Hillside Dr Quinlan, TX | 3.0 | 2.0 | 1410 | $1,800 | $1.28 | 3d | 1 | 0.25mi |
| 200 Dover Dr Unit 1 or 2 West Tawakoni, TX | 3.0 | 2.5 | 1854 | $1,850 | $1.00 | 2d | 1 | 0.37mi |
| 206 Perch Dr Quinlan, TX | 3.0 | 2.0 | 1565 | $1,795 | $1.15 | 2d | 1 | 0.95mi |
| 550 Quail Run Cir Quinlan, TX | 3.0 | 2.0 | 1200 | $1,300 | $1.08 | 16d | 1 | 1.47mi |
HOA detail
- Monthly dues
- $13 · $156/yr
Listing history 16 events
-
2026-06-18days on market $209,900 Active 35 DOM
-
2026-06-17days on market $209,900 Active 34 DOM
-
2026-06-16days on market $209,900 Active 33 DOM
-
2026-06-15days on market $209,900 Active 32 DOM
-
2026-06-13days on market $209,900 Active 30 DOM
-
2026-06-09days on market $209,900 Active 26 DOM
-
2026-06-08days on market $209,900 Active 25 DOM
-
2026-06-07days on market $209,900 Active 24 DOM
-
2026-06-04days on market $209,900 Active 21 DOM
-
2026-06-03days on market $209,900 Active 20 DOM
-
2026-06-02days on market $209,900 Active 19 DOM
-
2026-06-01days on market $209,900 Active 18 DOM
-
2026-05-31days on market $209,900 Active 17 DOM
-
2026-05-14$209,900 Active 1066-char remark
-
2024-05-31historical
-
2023-12-01$225,000 Active
ⓘ Source: listings_history table (triggers on properties + properties_extension) + one-shot
backfill from property_details.listing_events for pre-trigger history.
Tax reassessment forecast TX · Resets to sale price
- Current annual tax
- $3,557 · $296/mo
- Projected year-2 tax
- $3,841 · $320/mo
- Expected delta
- +$284/yr (+$24/mo · 8.0%)
ⓘ Screening estimate from a state-policy table — verify with the county assessor before closing.
Climate risk First Street
- Flood 1/10 Low FEMA zone X (unshaded) · 0% chance over 30 yrs
- Wildfire 3/10 Moderate
- Heat 7/10 Severe 7 d/yr ≥110°F today · 24 d/yr by 30 yrs out
- Wind 6/10 Major 27% chance of damaging wind over 30 yrs
- Air quality 2/10 Low 0 unhealthy d/yr today · 1 by 30 yrs out
Nearby sold comps map
Loading sold comps map…
Walkable amenities ~0.75 mi
Loading nearby amenities…
Taxation est. · year 1
- Rental income
- $21,880
- − Mortgage interest
- −$11,758
- − Property taxes
- −$3,557
- − Insurance
- −$1,050
- − Repairs & maintenance
- −$1,750
- − Management
- −$1,750
- − HOA
- −$156
- − Depreciation
- −$6,106
- Taxable loss
- −$4,247
- Est. tax savings @ 24.0%
- +$1,019
- After-tax cash flow
- $333/yr
For passive investors: Depreciation is non-cash, so a rental often shows a tax loss while cash-flowing — sheltering income. Rental losses are passive: they offset passive income freely, and up to $25,000/yr can offset ordinary (W-2) income if you actively participate and your MAGI is under $100k (phasing out to $0 by $150k); unused losses carry forward. On sale, claimed depreciation is recaptured at up to 25%, and gains may owe capital-gains tax (a 1031 exchange can defer both). Figures are a year-1 estimate at your 24.0% rate — not tax advice; consult a CPA.
Schools (NCES district)
- District
- Quinlan ISD
- NCES district ID
- 4836240
- Math proficiency
- 27% ▼ -10.00%
- Reading proficiency
- 34% ▼ -2.00%
- Median HH income
- $45,461
- Composite
- 26.16/100
- National rank
- #7271
- State rank
- #610 of 826 in TX
Livability — West Tawakoni
- Score
- 56/100
- State rank
- #1337
- US rank
- #23022
Category grades
Schools grade is shown separately in the Schools card above.
Census & demographics
- Census place
- West Tawakoni, TX
- County
- Hunt County · 71,969 people
- Metro
- Dallas-Fort Worth-Arlington, TX
- Population (ZIP)
- 17,671
- Household income
- $64,103
- Rent vs Own
- Severe rent burden
- 181.0
Population outlook (Hunt County) Hauer SSP2
- Today (2025)
- 97,090 people
- By 2030
- 100,452 · +3.5%
- By 2040
- 106,544 · +9.7%
- By 2050
- 111,218 · +14.6%
- By 2075
- 121,695 · +25.3%
- By 2100
- 123,683 · +27.4%
Race, ethnicity, and origin ACS 2023
- Neighborhood character
- Predominantly White (74%)
- Race & ethnicity
- White 74% Hispanic / Latino 19% Two or more races 8% Asian 1% Black 1%
- Hispanic origin (detail)
- Mexican 17%
- Common ancestry
- Lithuanian 2% Romanian 2% Iranian 1%
- Foreign-born
- 8% · Canada
- Languages at home
- 88% English-only · Spanish 10% Other Asian/Pacific 1%
Political lean MEDSL · Hunt
- 2024 margin
- Solid R (+55.5) · D 21.9% · R 77.4%
- 2008→2024 swing
- -14.9pp toward R · 2008: -40.6pp · 2024: -55.5pp
- All cycles
- 2024: R+55.5 2020: R+52.5 2016: R+56.3 2012: R+51.2 2008: R+40.6
Not yet ingested
- Civics
- —
Market trends
- HPI YoY
- ▲ 33.95%
- Current HPI
- 484.21
- Rent YoY
- —
- Metro
- Dallas-Fort Worth-Arlington, TX
- State GDP YoY
- ▲ 3.95%
- F500 in state
- 110
Industry mix (Fortune 500 HQ in TX)
| Industry | F500 HQs | Revenue |
|---|---|---|
| Energy | 16 | $1,198B |
|
||
| Technology | 5 | $198B |
|
||
| Engineering / Construction | 4 | $72B |
|
||
| Energy Services | 3 | $60B |
|
||
| Utilities | 3 | $41B |
|
||
| Healthcare | 2 | $330B |
|
||
Price history
-6.7% since first listed3 events — show timeline
- 2026-05-14 Listed $209,900 NTREIS
- 2024-05-31 Listing Removed — NTREIS
- 2023-12-01 Listed $225,000 NTREIS
Property tax history
+21.1%/yrLatest (2025): $3,557 · -11.0% YoY. Source: county tax records.
Cash-flow waterfall
monthlySold comps — $/sqft
last 12 mo · ≤1 miLoading sold comps…