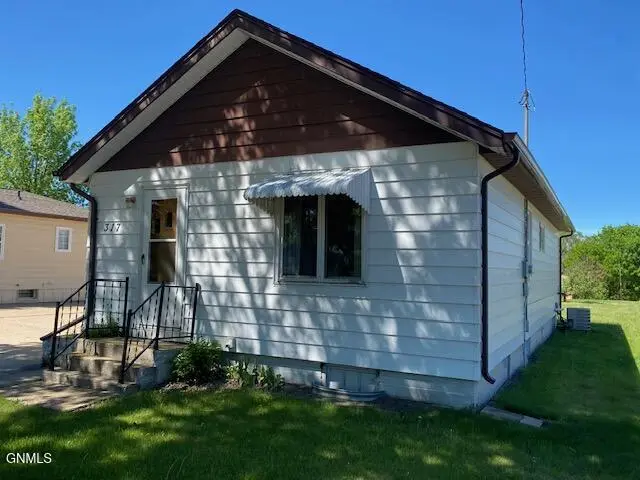
317 3rd Ave NW · Beulah, ND
Flood risk No data
- FEMA flood zone
- —
- Chance of flooding over 30 yrs
- —
- Est. flood insurance / yr
- —
Fire risk No data
- Est. fire insurance / yr
- —
Heat risk No data
- Hot days now (above threshold)
- —
- Hot days in 30 yrs
- —
Wind risk No data
- Chance of severe wind over 30 yrs
- —
Air-quality risk No data
- Unhealthy air days now
- —
- Unhealthy air days in 30 yrs
- —
Risk factors via First Street. Map © Google.
Why this score? — see what drove the D+ grade
The composite is a weighted blend of 9 inputs, each scored 0–100. Each bar is that input's sub-score; the figure is the points it added to the 100-point composite (weight × sub-score).
- Cash flow +20.1/30.0
- DSCR +6.4/10.0
- 1% rule +5.3/10.0
- ARV discount +4.1/15.0
- Livability +3.7/5.0
- Schools +2.9/10.0
- Rent growth +2.5/5.0
- Condition / age +2.2/5.0
- Appreciation +0.0/10.0
$86,000
🖨 Deal sheet (PDF) 📄 Offer letter ✓ Due diligence
Key facts
- New furnace
- Steel siding
- Central air
Tags
Property features AI
Exterior
- Parking: Detached garage with garage door opener; Garage faces front; Additional parking; 2-car garage
- Utilities: Public water; Public sewer; Propane available; Electricity connected
- Home design: Single family residence; One story
- Construction: Metal siding; Block foundation; Built with concrete basement
- Exterior features: Corner, level lot; Publicly maintained road frontage on a city street; No fencing; Asphalt roof
Interior
- Kitchen: Electric range; Refrigerator
- Flooring: Vinyl; Wood; Hardwood; Linoleum
- Bathrooms: One three-quarter bathroom
- Heating & cooling: Forced air heating (propane); Central air conditioning
- Interior features: Accessible entrance with ramp; Concrete basement
- Laundry & utility: Washer; Dryer
Neighborhood map
What this means for you Summary
Snapshot
- This is a 2-bed/1.0-bath single-family listed at $86k. Condition is rated fair.
Deal economics
- At list price, monthly cash flow is $107 ($1k/yr) — positive.
- The deal already cash-flows at list — no discount required.
- Meets the 1% rule at list price ($887 rent vs $86k).
- Recommended offer: $85k (1.5% below list) — sets the bar for market timing.
Location & tenants
- Location reads 74/100 on livability (#27 in ND, #4,527 nationally) — a middle-class / working-renter tenant base. Strengths: crime A+, employment A+, cost of living A+; Watch: health & safety D+, amenities F, commute F.
- Beulah 27 (town): math 31% / reading 33% proficiency, ranked #37 of 53 in ND (top 70%) — families likely to look elsewhere, expect single-tenant / working-renter base with shorter leases; only 17% free/reduced lunch — higher-income household profile.
- Zoned schools: Beulah Elementary School (math 37% / reading 32%, grade F, #162 of 236 statewide, top 73%, 319 students, 24% FRL); Beulah Middle School (math 33% / reading 35%, grade F, #26 of 35 statewide, top 79%, 236 students, 22% FRL); Beulah High School (math 15% / reading 24%, grade F, #134 of 144 statewide, top 93%, 206 students, 14% FRL) — zoned schools at 20% FRL track the district average.
- Market conditions: 24 active listings in the ZIP; 15 units permitted in Mercer County in 2024 (0 in 5+ unit buildings).
Forward outlook
- Local home prices are declining (-3.0%/yr); year-one equity from $595 of loan paydown is wiped out by about $3k of value loss. Plan a longer hold.
- Mercer County population projected at +38% by 2050 — long-run rental-demand tailwind backs the buy-and-hold thesis.
Negotiation context
- It's been on market 15 days — a 2% lower offer ($85k) is reasonable based on typical stale-listing flexibility.
Risks & watch-outs
- Watch-outs: built in 1940 — expect roof / HVAC / electrical / plumbing capex.
Questions for the listing agent
- Have any recent inspections been done? Can we get a copy of the seller's disclosures and any deferred-maintenance estimates?
- Built in 1940 — when were the roof, HVAC, electrical panel, plumbing, and water heater last replaced?
- Is there a deadline driving the sale (1031 exchange, divorce, estate, relocation)? That informs how much negotiation room exists.
- Schools are D-rated, which usually means shorter tenancies and higher turnover. Who's the typical renter profile here, and what's been the actual vacancy rate?
- The area grade is low — what's the realistic commute time and amenity access for the typical tenant pool here? Any planned neighborhood developments (good or bad) we should know about?
- What's the average days-on-market for RENTAL listings here right now (not sales)? A rising rental-DOM trend means longer vacancies and softer asking-rent achievability than the comps imply.
- What's the recent tenant-quality profile in this submarket — average credit score on applications, eviction rate, late-payment / NSF rate, and stable-employment percentage? A property-management company in the area should have these aggregated.
- How much new for-sale + rental construction is in the pipeline within 1–3 miles? Heavy new supply typically softens prices + rents 12–24 months out; constrained supply supports both.
Investment metrics
- 1% rule
- 1.03% ✓
- Cap rate
- 7.78%
- Cash-on-cash
- 5.31%
- DSCR
- 1.24
- GRM
- 8.1
CMA / ARV
- ARV (on-the-fly)
- $80,000
- Comps found
- 1
Show comp detail 1 sale within ~0.75 mi
| Address | Dist | Beds/Ba | Sqft | Sold | Price | $/sf | Match |
|---|---|---|---|---|---|---|---|
| 200 2nd Ave Se Ave SE | 0.49mi | 2/1.0 | 888 (+11%) | 17mo | $89,000 | $100 | 44 |
Match score weights: distance 35% · size 25% · config 20% · recency 20%. Top-matched comps best support the ARV.
Projected returns pro-forma
-3.0% appreciation · 3.0% rent growth · sell at horizon
- IRR
- -8.0%
- Equity multiple
- 0.70×
- Total profit
- $-7,138
- Equity at exit
- $12,823
- IRR
- 1.5%
- Equity multiple
- 1.11×
- Total profit
- $2,574
- Equity at exit
- $7,436
Cash invested: $24,080 (down + closing). Projections, not guarantees.
Landlord ↔ Tenant lean methodology
- Overall (STATE)
- 82 Strongly Landlord-Friendly
- State North Dakota
- 82 Strongly Landlord-Friendly · R+20
- County
- — inherits STATE
- City
- — inherits STATE
ZIP-level market 58523
- Home prices YoY
- -34.8%
- Active inventory
- 24
- Price-to-rent
- 8.1×
Monthly cashflow live
- Estimated rent
- $887 medium interval (Pro) →
- Mortgage (P&I)
- −$451
- Tax est. 1.5%
- −$108 /mo · $1,290/yr
- Insurance
- −$36
- HOA
- −$0
- Vacancy / Maint / Mgmt
- −$186
- Net cashflow
- $107
Break-even live
Sensitivity live
| Price | -10% $166 | -5% $136 | +0% $107 | +5% $77 | +10% $47 |
|---|---|---|---|---|---|
| Rent | -10% $36 | -5% $71 | +0% $107 | +5% $142 | +10% $177 |
| Rate | -1.0pp $150 | -0.5pp $128 | base $107 | +0.5pp $84 | +1.0pp $62 |
UW: 25.0% down · 7.5% · 30yr · 1.5% tax · 5.0% vac · 8.0% maint · 8.0% mgmt
Financing live
Cash to close
- Down payment
- $21,500
- Closing costs
- $2,580
- Reserves months
- —
- Total cash needed
- —
Loan-product check · same deal, 3 products live
Conventional
25% down · 7.5% · 30yr
- Down + closing
- —
- Monthly P&I
- —
- Monthly cashflow
- —
- DSCR
- —
- Eligible?
- —
Personal DTI + credit; lowest rate.
DSCR
20% down · 8.5% · 30yr
- Down + closing
- —
- Monthly P&I
- —
- Monthly cashflow
- —
- DSCR
- —
- Eligible?
- —
No personal income docs; deal must DSCR.
Hard money
10% down · 12.0% · 12mo
- Down + closing
- —
- Monthly P&I
- —
- Monthly cashflow
- —
- DSCR
- —
- Eligible?
- —
Short-term bridge; refi at stabilization.
Listing history 11 events
-
2026-06-21days on market $86,000 Active 15 DOM
-
2026-06-21days on market $86,000 Active 14 DOM
-
2026-06-18days on market $86,000 Active 12 DOM
-
2026-06-17days on market $86,000 Active 11 DOM
-
2026-06-16days on market $86,000 Active 10 DOM
-
2026-06-15days on market $86,000 Active 9 DOM
-
2026-06-13days on market $86,000 Active 7 DOM
-
2026-06-12days on market $86,000 Active 6 DOM
-
2026-06-09days on market $86,000 Active 3 DOM
-
2026-06-08days on market $86,000 Active 2 DOM
-
2026-06-07$86,000 Active 1 DOM
ⓘ Source: listings_history table (triggers on properties + properties_extension) + one-shot
backfill from property_details.listing_events for pre-trigger history.
Nearby sold comps map
Loading sold comps map…
Walkable amenities ~0.75 mi
Loading nearby amenities…
Taxation est. · year 1
- Rental income
- $10,646
- − Mortgage interest
- −$4,817
- − Property taxes
- −$1,290
- − Insurance
- −$430
- − Repairs & maintenance
- −$852
- − Management
- −$852
- − Depreciation
- −$2,502
- Taxable loss
- −$97
- Est. tax savings @ 24.0%
- +$23
- After-tax cash flow
- $1,301/yr
For passive investors: Depreciation is non-cash, so a rental often shows a tax loss while cash-flowing — sheltering income. Rental losses are passive: they offset passive income freely, and up to $25,000/yr can offset ordinary (W-2) income if you actively participate and your MAGI is under $100k (phasing out to $0 by $150k); unused losses carry forward. On sale, claimed depreciation is recaptured at up to 25%, and gains may owe capital-gains tax (a 1031 exchange can defer both). Figures are a year-1 estimate at your 24.0% rate — not tax advice; consult a CPA.
Condition & rehab AI · 13 photos
The home requires moderate repairs and updates to its kitchen, bathrooms, exterior, and flooring to improve its condition and value.
Repairs flagged
- Moderate Kitchen cabinets — Worn condition
- Moderate Bathroom fixtures — Dated appearance
- Moderate Exterior siding — Weathered condition
Value-add opportunities
- Resale Paint interior walls — Fresh paint enhances curb appeal
- Resale Replace countertops — Modern countertops improve functionality and aesthetics
- Resale Replace dated kitchen cabinets — Fresh cabinets modernize the kitchen and increase value
- Resale Replace dated bathroom fixtures — Modern fixtures improve functionality and aesthetics
- Resale Paint exterior siding — Fresh paint enhances curb appeal and value
- Both Replace worn flooring — Fresh flooring improves functionality and aesthetics, increasing both resale and rental value
Renovation cost estimate screening
| Repair item | Severity | Est. cost |
|---|---|---|
| Kitchen cabinets · Worn condition | Moderate | $3,000–15,000 |
| Bathroom fixtures · Dated appearance | Moderate | $3,000–15,000 |
| Exterior siding · Weathered condition | Moderate | $3,000–15,000 |
| Total estimated repair cost · 3 items | $9,000–45,000 |
Value-add ROI direction
- Resale Paint interior walls — Fresh paint enhances curb appeal ↑
- Resale Replace countertops — Modern countertops improve functionality and aesthetics ↑
- Resale Replace dated kitchen cabinets — Fresh cabinets modernize the kitchen and increase value ↑
- Resale Replace dated bathroom fixtures — Modern fixtures improve functionality and aesthetics ↑
- Resale Paint exterior siding — Fresh paint enhances curb appeal and value ↑
- Both Replace worn flooring — Fresh flooring improves functionality and aesthetics, increasing both resale and rental value ↑
ⓘ Cost ranges are severity-bucket heuristics (US national rule-of-thumb). Get contractor quotes + a written scope before underwriting a rehab budget.
Schools (NCES district)
- District
- Beulah 27
- NCES district ID
- 3800032
- Math proficiency
- 31% ▼ -13.00%
- Reading proficiency
- 33% ▼ -6.00%
- Median HH income
- $65,415
- Composite
- 29.33/100
- National rank
- #6547
- State rank
- #37 of 53 in ND
Livability — Beulah
- Score
- 74/100
- State rank
- #27
- US rank
- #4527
Category grades
Schools grade is shown separately in the Schools card above.
Census & demographics
- Census place
- Beulah, ND
- City population
- 3,277
- Population (ZIP)
- 3,277
Population outlook (Mercer County) Hauer SSP2
- Today (2025)
- 9,891 people
- By 2030
- 10,506 · +6.2%
- By 2040
- 11,872 · +20.0%
- By 2050
- 13,612 · +37.6%
- By 2075
- 19,871 · +100.9%
- By 2100
- 25,938 · +162.2%
Race, ethnicity, and origin ACS 2023
- Neighborhood character
- Predominantly White (89%)
- Race & ethnicity
- White 89% Hispanic / Latino 5% Two or more races 4% Native American 2%
- Common ancestry
- Portuguese 12% Scotch-Irish 6% Subsaharan African 3%
- Foreign-born
- 3% · Canada, Guatemala
- Languages at home
- 93% English-only · German/W. Germanic 3% Spanish 1% Other Indo-European 1%
Political lean MEDSL · Mercer
- 2024 margin
- Solid R (+69.0) · D 14.8% · R 83.8% · Other 1.3%
- 2008→2024 swing
- -39.2pp toward R · 2008: -29.9pp · 2024: -69.0pp
- All cycles
- 2024: R+69.0 2020: R+67.4 2016: R+67.9 2012: R+44.9 2008: R+29.9
Not yet ingested
- Civics
- —
Market trends
- HPI YoY
- ▼ -86.64%
- Current HPI
- 162.0576
- Rent YoY
- —
- Metro
- —
- State GDP YoY
- ▲ 2.09%
- F500 in state
- 2
Industry mix (Fortune 500 HQ in ND)
| Industry | F500 HQs | Revenue |
|---|---|---|
| Utilities / Construction | 1 | $6B |
|
||
Price history
+8.9% since first listed2 events — show timeline
- 2026-06-06 Price Changed $86,000 GNMLS
- 2026-06-06 Listed $79,000 GNMLS
Cash-flow waterfall
monthlySold comps — $/sqft
last 12 mo · ≤1 miLoading sold comps…